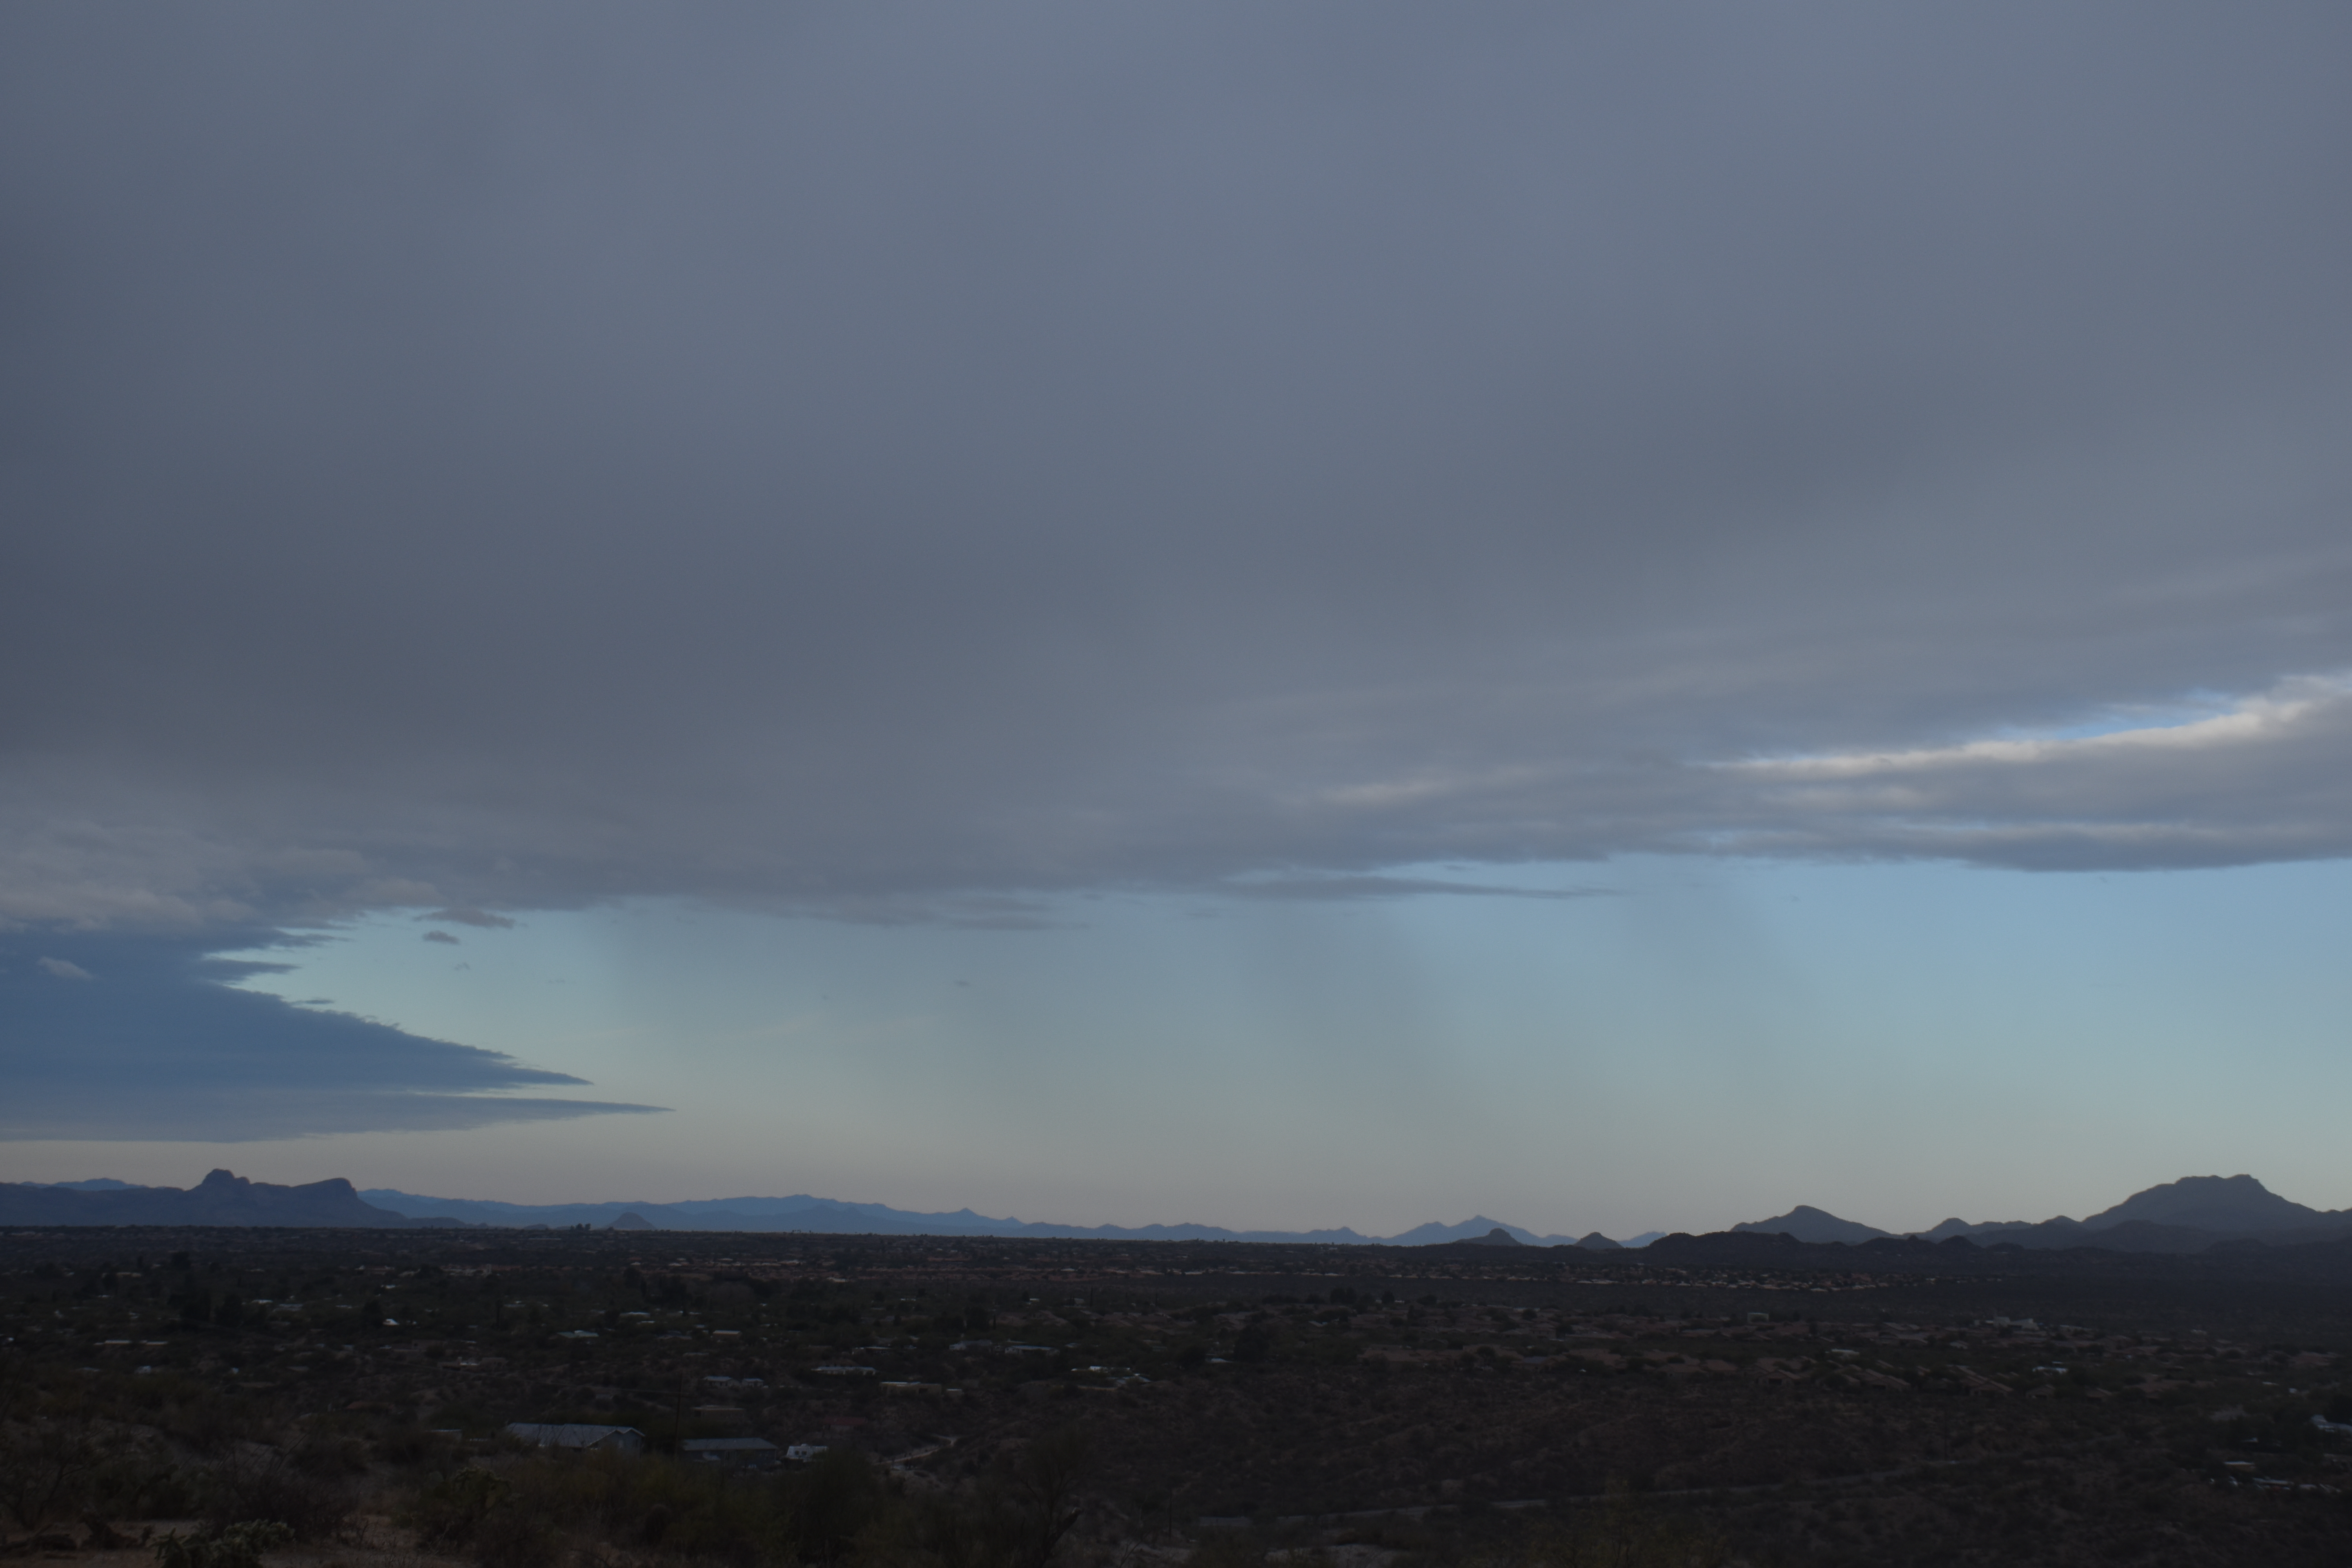
Yep, unless you were outside yesterday morning, you probably missed the few drops that fell. But fall they did, giving us officially a trace of rain for January! In case you don’t believe me, here is a shot of the incoming shafts of rain. OK, “veils” of rain.
Now, a historical forecasting criteria note after that paragraphical blog title, a criterion that still holds true:
In the 1950s and 1960s, the Los Angeles forecast office used the 564 decameter height on 500 mb weather maps (those made for about 18,000 feet above sea level) to delineate where the rain line was for incoming troughs. North of that, rain fell; south, no rain.
It was remarkable how well that worked.
Don’t know it that height criteria holds here in AZ, probably not, but the 500 wind max seems to be a good discriminator for TUS for rain; under or north of that max seems to be a necessary (though not sufficient) criteria in wintertime. (That wind max does not hold in Cal; rain often falls south of the 500 jet max; only east of the Sierras and coastal ranges does it hold.)
Lately, as winter gets colder, the NOAA spaghetti factory has recently lowered the red line heights to 564 dm in their 500 mb spaghetti plots, you can see that in 5 days from last night’s 00Z run, rain is virtually assured in southern Cal using that criterion, and we hope that rain gets here, too.
Check out where red lines are in the plot below. I’ve helped you to find red lines on this plot by annotating them with an arrow:
But after that trough whooshes by like a Nike logo, in ten days (2nd plot), we’re doomed again to be in the midst of a long warm, dry spell:
But what about after that next warm, dry spell? The weather way ahead
In a less professional comment than the usual ones posted here, reaching beyond the 10 day forecast limit, that domain of the models where things that are forecast beyond ten days often go to hell with just the next model run, these spaghetti plots foretell a collapse of that big fat, storm blockin’ ridge after our next warm, dry spell! It collapses into a muddle down, oh, I dunno, way down in subtropics somewhere. Yay! I can feel your happiness as I write this for you!
That ridge collapse means, first of all, that strong storms will blast Cal with needed flooding (well, big rains, anyway), and its likely that those Cal blastin’ storms will reach into all of Arizona providing a much needed hiatus in our drought, that is, will bring appreciable rains right here into Catalina as well. You can see if I have made this up by looking at the whole sequence here, keeping an eye on where those red lines are foretold to be.
So, that’s it, that’s my take on the longer term weather pattern:
“A Change Gonna Come,” as so eloquently sung by the master, Sam Cooke, when that 500 mb criterion was being used in LA, and apropos here because a change is gonna come, not that long from now. (Warning: The historical video scenes with Sam’s heartfelt tune will bring tears I just learned… Everyone should see it. Yep, we’ve been through a lot since he sang that song….)
Will keep you up to date every so often if it looks like my take, cribbed from the spaghetti plots is going to be correct in that drought bustin’ part I’ve described beyond ten days. In the event this “take” goes bad, it will, of course, not mentioned again. May have to fall back on writing about aircraft ice production in supercooled clouds to distract you.
The End