Comprehensive “Reply” to a “Comment” on the “Review of the Colorado River Basin Pilot Project”

First, as a subterfuge to gain more than one or two readers, this priceless photo taken yesterday morning on our porch of our dog, Cody, doing a play bow for a free range cow.  Tell  your  friends…Full title:  

A Review and Enhancement of the “Comment” by B. Geerts and P. Adhikari on “Great Expectations: A Review of the Colorado River Basin Pilot Project—The Nation’s Most Expensive Randomized Orographic Cloud-Seeding Experiment” by A. L. Rangno and D. S. Schultza

aCentre for Atmospheric Science, Department of Earth and Environmental Sciences, and Centre for Crisis Studies and Mitigation, University of Manchester, Manchester, United Kingdom

This post is linked to in a short published “Reply” in  the AMS’ journal, Weather, Climate and Society.  The full article is here:

https://journals.ametsoc.org/view/journals/wcas/17/3/WCAS-D-24-0076.1.xml?rskey=OsFQ7b&result=24

Corresponding author and sole writer of the short and this “comprehensive” Reply:  Arthur L. Rangno, art.rangno@gmail.com

Geerts and Adhikari (2025), hereafter “GA25,” have provided informative graphics of long-term cloud and precipitation characteristics for the San Juan Mountains where the Colorado River Basin Pilot Project (CRBPP) took place.  Having such information as GA25 provide would have been enormously helpful in the conduct of the CRBPP.  By indicating that supercooled liquid water (SLW) is appreciable when 500 hPa temperatures are >-23°C, it is likely that the sponsor of the CRBPP would have maintained the >-23°C 500 hPa criterion for the call of random decisions throughout the experiment instead of the criterion fluctuating from 500 hPa temperatures >-23°C  to cloud top temperatures >-23°C  and back again during the CRBPP as was described in Rangno and Schultz 2025, hereafter, “RS25.”  The statement by GA25 that the CRBPP “only used 500 hPa temperatures” is incorrect.

The comments of GA25 are a subset of a major computer driven analysis of SLW over the entire western United States by Adhikari et al. 2025, an article that could be considered one of the most important in support of cloud seeding activities ever published due to its scope and because of calculations indicating appreciable supercooled liquid water (SLW) over so many western mountain ranges.  Absent a critique of GA25 as here, a subset of Adhikari et al. (2025[1]), the latter’s results are likely to be taken prima facie as showing widespread cloud seeding potential.  In doing so, Adhikari et al.’s (2025) results, if flawed, could trigger widespread, but ineffectual seeding operations.  This “Reply” falls under the rubric described by Changnon and Lambright (1990):  “Honest controversy is essential for progress in science” and here is some, in long form.

GA25 point that their findings are dependent on the cloud model they employed. In this Reply, we will check the accuracy of that model against in situ observations made in support of the CRBPP.  Too, we know from the checkered history of cloud seeding that reports of cloud seeding potential deserve extra scrutiny.  Too often we have been misled by exaggerated claims, even from academic sources,  such as those that led to the CRBPP,  and most recently by those that led to disappointing randomized seeding results in Wyoming (Rasmussen et al. 2018) and Israel (Benjamini et al. 2023).   In essence, “the beat goes on.”

This magnitude of this Reply, too, is inspired by the recent editorial in Weather and Forecasting by Bunkers et al. 2023 that encourages such exchanges and as such, that they should provide interesting new information for the journal reader.  This has been done.

This “enhanced” Reply is organized in the following way: A brief review of the findings reported from the CRBPP that are relevant to GA25; an evaluation of the claim by GA25 that ice particle concentrations are solely a function of cloud top temperature;  the CRBPP precipitation climatology is contrasted with that in GA25, and lastly; a rudimentary evaluation of the existence of a non-precipitating, relatively deep, low-based cloud that is required to explain all of the prior successes that the CRBPP was based. There is also a brief description of CRBPP spring storms because those differ appreciably in their onset from the RS25 diagram (4b) that was more typical of fall and winter storms.

  • Was the seeding potential indicated by model computed radiometer values  when 500 hPa temperatures were >-23°C  realized during the CRBPP?

The great expectations from seeding when the 500 hPa temperature was >-23°C were not realized in the CRBPP (Rangno 1979, Fig. 18).  In the only test of the Grant et al. 1969 criterion under which large seeding increases in snowfall (50-200%) in the Wolf Creek Pass experiment,  Rangno (1979) found that in the CRBPP there was no viable indication of increases in snowfall on such days.  However, if present, the appreciable SLW calculated by GA25 was not generally available to CRBPP ground seeding operations in the first two months of the DJFM period due to frequent deep stable layers (e. g., Marwitz et al. 1976, Rangno 1979, Marwitz 1980).

In contrast to early and mid-winter storms, there was virtually no impediment to vertical dispersion of ground released plumes of silver iodide during the latter part of the CRBPP operations, March through mid-May.  An examination of this period by GA25 and the result of random seeding during this period could make an interesting follow up study as a test of the “appreciable” SLW hypothesis when the 500 hPa temperature is >-23°C.

Too, springtime storms onset differently than in the fall and winter archetype shown in RS25, 4b.  In the spring, storms were generally not preceded by vast, lowering layers of high and mid-level clouds having high and cold cloud tops as were the fall and wintertime storms (e.g., Medenwaldt and Rangno 1973, Fig. 4.2).  Rather, they onset with increasing cloud forms such as higher based Cumulus and Stratocumulus whose bases lowered while tops rose, and ice and virga began to appear in them as an upper trough approached (Medenwaldt and Rangno 1973, 1974, Hjermstad et al. 1975).

  • Airborne measurements in support of the CRBPP differ substantially from those deduced in model calculations by GA25 on when seeding potential exists

GA25’s findings inadvertently raise questions about the usefulness of airborne studies and also the validity of  model calculations in GA25 that indicated when appreciable SLW is supposed to be present.

Why?

The University of Wyoming research team flew ~45 h in support of the CRBPP during its final season (Marwitz et al. 1976, Marwitz 1980, Cooper and Marwitz 1980, Cooper and Saunders 1980, Cooper and Vali 1981).  They asserted from their measurements that the seeding potential was near the end of storms when relatively shallow orographic clouds, under cooling aloft, became more convective and therefore, contained more SLW than in the early stages of storms.  In the early, warm, stable stage of the storms, Cooper and Saunders (1980) wrote: “During early storm stages the precipitation developed primarily by diffusional growth of ice crystals.”  They did not encounter “appreciable” SLW as the model used by GA25 calculated under those conditions.  Rather, they found that in the early stage of storms, the SLW content averaged “<0.1 g m-3.”  The lack of rimed ice particles supports the view of limited if any SLW during this stage.  Quoting from Marwitz et al. (1976, p52): “The stable stage of the San Juan storms is therefore unseedable, because there is negligible liquid water present and because the seeding material cannot the cloud level from the ground-based generators.”  The stable stage referred to by Marwitz et al. was when the initial precipitation bearing cloud shields arrived in the San Juan mountains and when 500 hPa temperatures were almost always >-23°C, and usually with much colder cloud tops. In the latter cold phase of the CRBPP storms, the Wyoming team reported that SLW averaged 0.5 to 1 g m-3 in relatively shallow orographic clouds with moderate top temperatures or  5-10 times greater SLW than in the early stage of storms.

Also,  the early stage of storms was characterized by chaotic surface and low-level winds (Marwitz 1980[1]), a condition that hampered targeting from ground seeding releases while the cold stage was much less so.

For these several reasons, the Wyoming team deemed the early warm portion of storms unsuitable for cloud seeding.

Thus, the Wyoming team’s conclusions on what storm stage is best for cloud seeding are diametrically opposed to those of GA25.  GA25 concluded that the warm, early portion of storms marked by 500 hPa temperatures >-23°C, had the most cloud seeding potential due to appreciable model calculated SLW, twice as much, GA25 stated, as their calculations indicated for the cold stage of storms when hPa 500 temperatures were <-23°C.

——footnote concerning the Wyoming analyses of surface winds——-

[1] Marwitz (1980) and Marwitz et al. (1976) produced maps showing a “convergence” zone during the early portions of storms.   Marwitz was contrasting CRBPP surface reporting stations with elevation differences of about 2000 feet (650 m) to arrive at the ersatz idea of a convergence zone.  No convergence zone is seen in the streamline analyses by the E. G. & G, Inc., forecasting team (e.g., Medenwaldt and Rangno 1973) who realized the effect of elevation differences from the reporting stations could lead to the misperception of a surface-based convergence zone.  Marwitz was alerted to this problem by the writer.

——end of footnote——-

The differences between GA25 and the Wyoming team’s results could be laid to several factors inherent in airborne research, in a defense of GA25’s calculations. Limited airborne sample volumes, limited flight durations on a relatively few storm days, and the inability in IFR situations to sample in the lowest elevations above the ground, all of which could have contributed to why the Wyoming researchers concluded that the cold stage of the storms was the one with seeding potential, not the warm one.  Thus, even with as much contrast as they reported in seeding potential, the Wyoming team’s results must be considered, “suggestive,” not conclusive.  More in situ and radiometer measurements are critically needed to validate the GA25’s model calculations due to their importance regarding future cloud seeding operations.

In a further comment regarding the seeding potential indicated by GA25, Vardiman and Hartzell (1976) reported that rimed particles were usually present at the top of Wolf Creek Pass regardless of the temperature at 500 hPa.  Their report suggested that some SLW is escaping the precipitation process on the west slope of Wolf Creek Pass and may represent some seeding potential that was not realized during the CRBPP.  Their findings, moreover, agree with those of Hindman (1986) concerning SLW at mountain tops in the Colorado Rockies.

  • The factors that affect model calculations of appreciable radiometer SLW in storms with 500 hPa temperatures >-23°C

 Spuriously low ice particle concentrations output by the model used by GA25 (Thompson and Eidhammer 2014), would lead to appreciable SLW not consumed by ice particles.  What is the concentration of ice particles that the model produces over and upwind of the San Juans with cloud tops at -20°C?  How do they compare to the concentrations encountered by the Wyoming team?  This critical information is not displayed or known by GA25; nor is it displayed in Adhikari et al. 2025, the latter the progenitor study of which GA25 is a subset.  A request by this writer for benchmark Thompson and Eidhammer (2014) model calculated ice particle concentrations at -10°C, -20°C, and -30°C for comparison purposes with the Wyoming CRBPP measurements and this in other field programs could not be accommodated by GA25, nor from Adhikari et al. 2025 (B. Geerts, personal communication, November 2025).

As was learned from the many models evaluated for the prediction of orographic precipitation by Liu et al. 2011, accurate model microphysics are critical in the assessment of seeding potential.

One definite problem in the Thompson and Eidhammer model is that the onset of ice in “maritime” clouds is at -13°C, a far lower temperature than has been observed in numerous maritime cloud studies over the preceding 50 years.   Ice onsets routinely  in such clouds at temperatures as high as -4°C (e.g., Mossop et al. 1967, 1968, Ono 1971, Hobbs 1969, 1974, Hobbs and Rangno 1985, 1990, 1998, Rangno and Hobbs 1991, 2005).  Due to this oversight, model calculated SLW will be too high in maritime and near maritime locations in the parent article by Adhikari et al. 2025 along the West Coast of the United States because ice will not onset in model clouds until top temperatures are -13°C.

But what about ice formation in the CRBPP ?

Figure 1, in effect a reality check, shows an example of a shallow orographic cloud’s rapid evolution into a glaciated mass after the formation of all SLW upwind edge.  This photo demonstrates how orographic clouds can rapidly convert to ice clouds and is for the purpose of showing how important it is for a model to do what nature does.  Figure 1, too, is a virtual replication of the orographic cloud described by Cooper and Vali (1981) for an orographic cloud in the San Juan mountains with a top at -20°C, about the same as the cloud top temperature in the photo.  Too, the Cooper and Vali studied cap cloud  evolved into an ice cloud just like this one, except for having a thin SLW top.  Cooper and Vali measured a maximum of 100 per liter concentration of ice particles downwind from the cap cloud’s leading SLW edge.  The model used by GA25 and by inference, Adhikari et al. 2025, should reflect this evisceration of SLW across barriers in clouds with similar top temperatures of about -20°C if model ice particle production is reasonably accurate.

Figure 1.  A cross-section lifecycle of a shallow orographic cloud passing over the La Plata Mountains northwest of Durango, CO, during the CRBPP, that illustrates how liquid water at the upstream edge of the cloud (leftmost) is consumed by the rapid formation of high concentrations of ice particles as the cloud air moves downwind (center and right).  Ice concentrations are estimated by the author to be in the 10s to 100 per liter by the density of the ice cloud.  Photo by author taken at 1200 MST, 31 March 1974, a CRBPP experimental seeded day (Medenwaldt and Rangno 1974; Elliott et al. 1976) with southwesterly flow from the surface through 500 hPa.  Cloud tops were estimated in real time by this writer to lie be between 16,000 and 17,000 feet Above Sea Level which would have made top temperatures of about -20°C. The 500 hPa temperature was -21.4°C at 1045 MST decreasing to -24.0°C by 1410 MST.  The La Plata Mountains are upwind of the CRBPP target.

Similar comparisons to measurements from airborne research besides those made during the CRBPP can be examined at the several other barriers examined by Adhikari et al. (2025) that would help to establish the critical reliability of “model ice concentrations” (e.g., those in the Cascades by Hobbs 1974, 1975, Hobbs and Atkinson 1976).

  • Do ice particle concentrations increase as cloud tops get colder as stated by GA25?

Yes and no.  GA25 make the general statement that “natural ice crystals become increasingly appreciable at lower temperatures.”  This is not the end of the story.  We know from the CRBPP airborne studies that no ice formed in those rare San Juan Mountain clouds with tops >-10°C (Cooper and Saunders 1980, Fig. 11b).  At temperatures between -10°C and -19°C in measurements near cloud tops, Cooper and Saunders did find from a “very limited sample,” indeed and as asserted by GA25, that ice crystal concentrations increased linearly with lower crystal origin temperatures from 2 to about 50 per liter.

Disruptions of a relationship between cloud top temperatures and initial ice particle concentrations arise after the formation of the initial ice crystals, usually near cloud top.  The ensuing deterioration of that relationship is due to fragmentation of crystals via collisions with other ice crystals(Vardiman 1978), the breakup of delicate crystal forms when growing to larger sizes, or due to collisions with cloud droplets during riming (Dye and Hobbs 1968),  crystal collisions with graupel, or “unknown mechanisms.”  Quoting Cooper and Saunders (1980) from ice crystal data collected at levels below cloud top in the CRBPP: “The observed ice crystal concentrations were far above the corresponding ice nucleus measurements, and the discrepancy could not be attributed to known ice multiplication processes.”

Furthermore, the assertion of a relationship between cloud top temperature and ice nucleus concentrations expected to be activated at cloud top has been refuted on many occasions (e.g., Hobbs 1969, Auer et al. 1969, Vardiman and Hartzell 1976[1], Grant et al. 1982, Rangno and Hobbs 1986, Korolev et al. 2003).

Grant et al. 1982 in an inventory of orographic clouds wrote: “In general, the largest values of crystal concentrations are observed within the lowest levels of the clouds.  These observations are not consistent with the concept of ice nucleation occurring to a greater extent at the lowest temperatures (i.e., cloud top) followed by crystal fallout.” The Grant et al. statement was extremely important because it was Grant’s 1968 findings that ice particle concentrations were a function of cloud top temperature that helped lead to the CRBPP and during it, caused the change to cloud top temperatures from that at 500 hPa for two seasons before it was abandoned.

As an early example of the lack of a relationship between cloud top temperatures and ice concentrations was reported by Borovikov (1968) who wrote: “Should the phase of a cloud depend on temperature only the frequencies of liquid phase of clouds of different forms might be the same at any temperature. However, our data does not prove this idea.” (Italic “data” inserted by this writer in place of “Figure 5” for clarity.)

  • Simple cloud observations also refute the idea of increasing ice particle concentrations with lowering cloud top temperatures.  Altostratus and Nimbostratus have been observed to have SLW (Altocumulus-like) tops of -25°C to < -30°C (Cunningham 1957, Hobbs and Rangno 1985, Rauber and Tokay 1991, Korolev et al. 2003).   This once unexpected situation has been termed, “the upside-down storm” because the very coldest portion of the cloud system is SLW and the warmer portions are all or mostly ice crystals. A vignette of the “upside down” storm can be seen in Altocumulus clouds trailing virga.

Observations of SLW-topped stratiform clouds with very low top temperatures are a direct refutation of the idea that “natural ice crystals become increasingly appreciable at lower temperatures” as GA25 assert. No water-topped layer clouds at the low temperatures cited above could exist if the GA25 assertion was true, and by inference, if the model they used was reliable in predicting ice particle concentrations.  Furthermore, the ice particle concentrations falling out of such clouds are not in the tens to thousands per liter as they might be as derived from computer model calculations of ice concentrations from clouds with temperatures as low as those above, but are modest (e.g., Hobbs and Rangno 1985).  If these upside-down situations cannot be replicated in the model used by Adhikari et al. 2025 and GA24, what does it mean for their model and cloud seeding potential?  More or less? Is seeding a liquid layer at cloud top viable?

Finally, porous, all ice clouds such as transparent versions of Altostratus (i.e., translucidus) and Nimbostratus (the latter occasionally produced inconsequential snowfall in Durango) are clouds low in ice particle concentrations even with extremely low cloud top temperatures located at Cirrus levels.

In sum, there is a general lack of correlation of ice particle concentrations and cloud top temperatures except in the very early stages of ice formation in some clouds before secondary ice processes kick in.

——footnote——

[1] Most of the cloud top temperatures used by Vardiman and Hartzell (1976) in forming their statement were from the La Plata County airport rawinsondes, and the reliability of those over Wolf Creek Pass is questionable.

—-end of footnote——

  • On CRBPP storm synoptics

GA25 state that “warm” periods (500 hPa temperatures >-23°C) represent those under “upper-level ridging and pre-frontal conditions.”  This is mainly true in the late winter and spring. The characteristics of fall and early winter storms depart from this description (e.g., Rangno 1972[1]).  Every hour of precipitation during all the phases of the five storms described by Rangno, pre-trough to post-trough passage, occurred with 500 hPa temperatures >-23°C.  This was not an unusual sequence; storms in the early portion of the CRBPP snow accumulating season, mid-October through December) because they are generally warmer throughout than those in late winter and spring.  In the spring,  a trough at hPa 500 in the mean occupies the interior of the western US (Crutcher and Meserv 1970[2]).

  • When does the heaviest snow fall in the San Juans?

Figure 4 in GA25 indicates that most snow falls when the 500 hPa temperatures are  <-23°C during their study period of DJFM and that the heaviest rate of precipitation also falls during this condition.  This contrasts with several studies on when the heaviest precipitation occurs.  Here it is presumed that the heaviest daily precipitation events also contain the heaviest rates of precipitation.  Grant et al. (1974) stated: “A peak in the daily snowfall appears in the -21°C to -24°C class interval while the running mean indicates a peak around -20°C to -21°C.”  The Grant et al. data were based on the unseeded daily amounts in the first two winters of the Wolf Creek Pass Experiment (Figure 40, p69).  Hjermstad (1970, p53) expanding upon  Grant’s findings analyzed eight Nov-Apr seasons of 24 h, non-seeded days data, reaching virtually the same conclusions; snow water equivalent amounts were nearly identical in the 500 hPa categories of  -16°C to -20°C, as they were in the -21°C to -25°C.  There was no decrease as in amounts as 500 hPa temperatures increased as suggested by the graphics of GS25.   Moreover, amounts decreased at 500 hPa temperatures <-25°C.

Rangno (1979), and Hobbs and Rangno (1979) in long term studies of several Rockies NOAA cooperative stations for November through April, also found that the heaviest average daily precipitation fell at 500 hPa temperatures >-23°C.

The above studies used interpolated rawinsonde data from nearby NWS stations.  GA25 do not disclose how they obtained 500 hPa temperatures for hourly SNOTEL data over the San Juan Mountains. Thus, differing methodologies may have influenced these different conclusions such as not using the actual NWS rawinsonde data.

These studies beg the question, too, that if there was a wider examination of the snow accumulating season in the San Juan Mountains, such as that planned for the CRBPP (mid-October through mid-May), would a different conclusion have been found by GA25 regarding when the heaviest snowfalls occur?

——footnotes——–

[1] The first official report finding that cloud top temperatures and those at 500 hPa were not correlated.  An appendix quoting this finding is provided at the end of this “Reply.”

[2] For this reason, March is the coldest month aloft in general in the West and wettest snow water equivalent month at Wolf Creek Pass, CO, over its period of record, 1958-2001.

—–end of footnotes——-

  • GA25 observed that the CRBPP targeted less frequent warm storms rather than the more frequent ones that occur under low 500 hPa temperatures.

This was what was intended for the CRBPP because the less frequent storms with >-23°C 500 hPa temperatures were reported to be those when seeded, apparently produced extremely large (50-200%) increases in snow via cloud seeding in the Wolf Creek Pass experiment.  Those with <-23°C 500 hPa temperatures had no apparent seeding potential (i.e., Grant et al. 1969, 1974).

  • Was the supercooled, non-precipitating cloud responsible for all the Wolf Creek Pass and Climax cloud seeding successes real?

Determining the climatologically representative hours of non-precipitating, relatively thick, low-based cloud SLW over a potential target represents a baseline of cloud seeding potential.  The most viable element of the work that the CRBPP was based on was the statement by Chappell (1970): “seed clouds, not precipitation.”  Chappell wrote that because all the successes in the Colorado State University cloud seeding experiments that led to the CRBPP were due to making non-precipitating clouds apparently precipitate virtually like natural storms (e.g., Chappell et al. 1971).  In retrospect, it was a red flag.

The idea of seeding such a non-precipitating supercooled cloud with no guidance on when it might occur had a major effect in the CRBPP first season’s operations.  With no guidance, it was thought that non-precipitating clouds might accompany “close calls” when a trough was expected to pass by with only a small chance of precipitation.  No one knew. With a hardwired time to draw decisions in the first year by 9 AM,  and the experimental day ending at 11 AM on the next, and the criterion being precipitation occurring “anywhere” in the target, decisions were drawn “fast and loose.” Moreover, due to the delayed start of the first season’s operations until December 1970, forecasters were urged by the sponsor of the CRBPP to not miss an opportunity for a random draw.  The result was many more zero precipitation days in the first season’s experimental days compared to later seasons when more experience accrued, and a policy of having a more substantial chance of precipitation for the draw of an experimental day was implemented by new E. G. & G., Inc., management.

Preceding the CRBPP, there had been extensive studies of the precipitation climatology of the Wolf Creek Pass and Climax regions (e.g., Grant et al. 1969).  However, there had not been a cloud climatology study, one that would have revealed that a non-precipitating, thick, SLW-loaded, low-based orographic cloud was largely fictitious and would have exposed the spurious nature of the reported increases in snowfall due to seeding in the Colorado State University experiments on which the CRBPP depended.

In intensive, visual observations for the full seasons of the CRBPP beginning with the 1972/73 operating season by this writer attempted to document all instances of low, relatively thick, non-precipitating clouds.  The documentation of such a cloud was sought during the third season because the outcome of the CRBPP depended solely on such a cloud and the CRBPP was now failing after but two seasons in producing evidence that cloud seeding was increasing snowfall on seeded days. And because such a cloud did not appear to exist.

Low cloudiness that was at least 2,000 feet (about 650 m) in estimated depth that did not form ice and was not visually precipitating was kept track of during all daylight hours of all days of the CRBPP for three full seasons.  Examples of the cloud classifications are shown in Medenwaldt and Rangno (1973, 1974) and in Hjermstad et al. (1975).   These observations with cloud thickness estimates also appear on those days chosen as experimental days.  The result of those several thousand observations was that such cloudiness constituted but 8-12 % (about 80-100 h in each season), and generally occurred in short durations of an hour or two and in limited coverage.

If these relatively shallow non-precipitating clouds were in the same proportion at night, and were not spotty in coverage, and they could be made to precipitate at 0.01 inches per hour it would represent, in a perfect seeding scenario where no opportunities are missed, a water equivalent potential of ~2 inches each season with no randomization and 1 inch in a 50-50 randomized experiment.

In contrast, the 50-50 randomized CRBPP was expected to produce 7.7 inches of extra water equivalent precipitation per season seeding non-precipitating clouds based on Grant et al. 1969, as documented in RS25.  Nevertheless, while much less than expected, there appears to be some realizable potential for cloud seeding to increase snowfall in the San Juans.

Those thousands of visual observations, primitive as they were, were supported by the University of Wyoming’s findings years later that ice onset in CRBPP clouds with top temperatures as high as -10°C to -12°C leaving little room for non-precipitating supercooled clouds over the San Juan mountains.  These inferences are not valid for lower elevation barriers than the San Juans.

REFERENCES

Adhikari, P., B. Geerts, S. Tessendorf, L. Xue, and T. Schneider, 2025: Climatology of cold-season supercooled liquid water and glaciogenic cloud seeding potential in the western United States, according to a 4 km resolution climate reconstruction. Journal of Appl. Meteor. and Climatology, 64, 1215-1231.   https://doi.org/10.1175/JAMC-D-24-0246.1

Auer, A. H., D. L. Veal, and J. D. Marwitz, 1969: Observations of ice crystals and ice nuclei observations in stable cap clouds.  J. Atmos. Sci., 26, 1342-1343. https://doi.org/10.1175/1520-0469(1969)026%3C1342:OOICAI%3E2.0.CO;2

Borovikov, A. M., 1968:  Preprints, Cloud Phys. Conf., Toronto, Amer. Meteor. Soc., Boston, 290-294.

Bunkers, M., W. Ashley, S. Bieda, K. Calhoun, B. Kirtman, K. Kosiba, K. Mahoney, L. McMurdie, C. Potvin, Z. Pu, and E. Ritchie, 2023:  Editorial, Wea. Forecasting, 38, 633-636.  https://doi.org/10.1175/WAF-D-23-0051.1

Chappell, C. F., 1970: Modification of cold orographic clouds.  Atmos. Sci. Paper No. 173, Dept. of Atmos. Sci., Colorado State University, Fort Collins, 196pp. (Available from the Western Waters Digital Library, Special Collections, University of Washington).

________., L. O. Grant, and P. W. Mielke, Jr., 1971: Cloud seeding effects on precipitation intensity and duration of wintertime orographic clouds.  J. Appl. Meteor., 10, 1006-1010. https://doi.org/10.1175/1520-0450(1971)010%3C1006:CSEOPI%3E2.0.CO;2

Cooper, W. A., and J. D. Marwitz, 1980: Winter storms over the San Juan mountains.  Part III.  Seeding potential. J. Appl. Meteor., 19, 942-949.  https://doi.org/10.1175/1520-0450(1980)019%3C0942:WSOTSJ%3E2.0.CO;2

__________, and C. P. R. Saunders, 1980: winter storms over the San Juan mountains.  Part II. Microphysical processes.  J. Appl. Meteor., 19, 927-941. https://doi.org/10.1175/1520-0450(1980)019%3C0927:WSOTSJ%3E2.0.CO;2

__________, and G. Vali, 1981: The origin of ice in mountain cap clouds.  J. Atmos. Sci., 38, 1244-1259.      https://doi.org/10.1175/1520-0469(1981)038%3C1244:TOOIIM%3E2.0.CO;2

Crutcher, H. I., and J. Meserv, 1970: Selected-level heights, temperatures and dew point temperatures for the Northern Hemisphere. Naval Wea. Service, Report NAVAIR 50-1C-52 (revised)

Cunningham, R. M., 1957: A discussion of generating cell observations with respect to the existence of freezing or sublimation nuclei.  In Artificial Stimulation of Rain, H. Weickmann, Ed.  PerGA25mon Press, NY., 267-270.

Elliott, R. D., Shaffer, R. W., Court, A., and J. F. Hannaford, 1976:  Colorado River Basin Pilot Project Comprehensive Evaluation Report.  Final Report to the Bureau of Reclamation,  Aerometric Research, Inc., Goleta, CA.  641pp. (Available from the Western Waters Digital Library, Special Collections, University of Washington).

Geerts, B., and P. Adhikari, 2025: Comment on “Great Expectations: A Review of the Colorado River Basin Pilot Project—The Nation’s Most Expensive Randomized Orographic Cloud-Seeding Experiment.” Wea. Climate and Soc., in press.

Grant, L. O., 1968: The role of ice nuclei in the formation of precipitation.   Proc. Intern. Conf. Cloud Phys., Toronto, Amer. Meteor. Soc., 305-310.

________, Chappell, C. F., Crow, L. W., Mielke, P. W., Jr., Rasmussen, J. L., Shobe, W. E., Stockwell, H., and R. A. Wykstra, 1969:  An operational adaptation program of weather modification for the Colorado River basin.  Interim report to the Bureau of Reclamation, Department of Atmospheric Sciences, Colorado State University, Fort Collins, 98pp.  (Available from the Western Waters Digital Library, Special Collections, University of Washington).

_________, Chappell, C. F., Crow, L. W., Fritsch, J. M., and Mielke, P. W. Jr., 1974:  Weather modification: a pilot project.  Final Report to the Bureau of Reclamation, Contract 14-06-D-6467, Colorado State University, 98pp plus appendices. (Available from the Western Waters Digital Library, Special Collections, University of Washington).

_________, DeMott, P. J., and R. M. Rauber, 1982: An inventory of ice crystal concentrations in a series of stable orographic storms.  Preprints, Conf. Cloud Phys., Chicago, Amer. Meteor. Soc., Boston, MA. 584-587.

Hindman, E. E., 1986: Characteristics of supercooled liquid water in clouds at mountaintop sites in the Colorado Rockies.  J. Appl. Meteor. 25, 1270-1279. https://doi.org/10.1175/1520-0450(1986)025%3C0180:AAWBOA%3E2.0.CO;2

Hjermstad, L. M., 1970:  The influence of meteorological parameters on the distribution of precipitation across central Colorado mountains.  Atmospheric Science Paper 163, Atmos. Sci. Dept., Colorado State University, 86pp.(Available from the Western Waters Digital Library, Special Collections, University of Washington).

________, A. L. Rangno, and R. A. Medenwaldt, 1975: Colorado River Basin Pilot Project Comprehensive Atmospheric Data Report, 1972-1973 Season.  Report to the Bureau of Reclamation, E. G. and G., Inc., Durango, CO.  961pp.  (Available from the Western Waters Digital Library, Special Collections, University of Washington).

Hobbs, P. V., 1969: Ice multiplication in clouds. J. Atmos. Sci., 26, 315-318.https://doi.org/10.1175/1520-0469(1969)026%3C0315:IMIC%3E2.0.CO;2

__________, 1974: High concentrations of ice particles in a layer cloud. Nature, 251, 694-696. https://doi.org/10.1038/251694b0

__________, 1975:  The nature of winter clouds and precipitation in the Cascade mountains and their modification by artificial seeding.  Part I.  Natural conditions.  J. Appl. Meteor., 14, 783-804. https://doi.org/10.1175/1520-0450(1975)014%3C0783:TNOWCA%3E2.0.CO;2

__________, and D. G. Atkinson, 1976: The concentrations of ice particles in orographic clouds and cyclonic storms over the Cascade mountains. J. Atmos. Sci., 33, 1362-1374. https://doi.org/10.1175/1520-0469(1976)033%3C1362:TCOIPI%3E2.0.CO;2

__________, and A. L. Rangno, 1979: Comments on the Climax randomized cloud seeding experiments.   J. Appl. Meteor., 18, 1233-1237. https://doi.org/10.1175/1520-0450(1979)018%3C1233:COTCAW%3E2.0.CO;2

_________, and ________, 1985: Ice particle concentrations in clouds. J. Atmos. Sci., 36, 2523-2549. https://doi.org/10.1175/1520-0469(1985)042%3C2523:IPCIC%3E2.0.CO;2

__________, and _______, 1990: Rapid development of ice particle concentrations in small polar maritime cumuliform clouds. J. Atmos. Sci., 47, 2710-2722.  https://doi.org/10.1175/1520-0469(1990)047%3C2710:RDOHIP%3E2.0.CO;2

__________, and _______, 1998:  Microstructures of low and middle-level clouds over the Beaufort Sea.  Quart. J. Roy. Meteor. Soc., 124, 2035-2071. https://doi.org/10.1002/qj.49712455012

_________, L. F. Radke, J. R. Fleming, and D. G. Atkinson, 1975: Airborne ice nucleus and cloud microstructure measurements in naturally and artificially seeded situations over the San Juan mountains in Colorado.  Research Report X, Cloud Physics Group, Atmos. Sci. Dept., University of Washington, Seattle, 98195-1640. Available at: https://carg.atmos.washington.edu/sys/research/archive/colorado_seeding.pdf

Korolev, A., G. A. Isaac, and J. Hallett, 2003:  Ice particle habits in stratiform clouds.  Quart. J. Roy. Meteor. Soc., 129,  19-38.  https://doi.org/10.1256/qj.01.203

Liu, C., K. Ikeda., G. Thompson, R. Rasmussen, J. Dudhia, 2011: High-resolution simulations of wintertime precipitation in the Colorado headwaters region: sensitivity to physics parameterizations. M. Wea. Rev., 139, 3533-3553.  https://doi.org/10.1175/MWR-D-11-00009.1

Marwitz, J., 1980: Winter storms over the San Juan mountains.  Part I.  Dynamical processes.  J. Appl. Meteor., 19, 913-926. https://doi.org/10.1175/1520-0450(1980)019%3C0913:WSOTSJ%3E2.0.CO;2

_________., Cooper, W. A., and C. P. R. Saunders, 1976:  Structure and seedability of San Juan storms.  Final Report to the Bureau of Reclamation, University of Wyoming, Laramie, WY, 324 pp. (Available from the Western Waters Digital Library, Special Collections, University of Washington).

Medenwaldt, R. A., and A. L. Rangno, 1973: Colorado River Basin Pilot Project Comprehensive Atmospheric Data Report, 1972-1973 Season.  Report to the Bureau of Reclamation, E. G. and G., Inc., Durango, CO.  965pp. (Available from the Western Waters Digital Library, Special Collections, University of Washington).

__________, and A. L. Rangno, 1974: Colorado River Basin Pilot Project Comprehensive Atmospheric Data Report, 1972-1973 Season.  Report to the Bureau of Reclamation, E. G. and G., Inc., Durango, CO.  1074pp. (Available from the Western Waters Digital Library, Special Collections, University of Washington).

Mossop, S. C., Ono, A., and Heffernan, J. K., 1967:  Studies of ice crystals in natural clouds. J.    Res. Atmos., 1, 45-64.

_______, Rushkin, R. E., and J. K. Heffernan, 1968:  Glaciation of a cumulus at approximately -4° C.  J. Atmos. Sci., 25, 889-899. https://doi.org/10.1175/1520-0469(1968)025%3C0889:GOACAA%3E2.0.CO;2

Ono, A., 1971:  Some aspects of the natural glaciation process in relatively warm maritime clouds.  Memorial Volume of the late Prof. Syono.  A special issue of the J. Meteor. Soc. Japan, 49, 845-858.

Rangno, A. L., 1972: Case study on some characteristics of the specially monitored storm episodes within the Colorado River Basin Pilot Project.  Special Project Report to the Bureau of Reclamation, 105pp. (Available from the Western Waters Digital Library, Special Collections, University of Washington).

__________, 1979:  A reanalysis of the Wolf Creek Pass cloud seeding experiment.   J. Appl. Meteor., 18, 579–605. https://doi.org/10.1175/1520-0450(1979)018%3C0579:AROTWC%3E2.0.CO;2

__________, and P. V. Hobbs, 1986: Deficits in ice particle concentrations in stratiform clouds with tops <-30°C.  Preprints, 23rd Conference on Radar Meteorology and the Conference on Cloud Physics, Snowmass, CO, Amer. Meteor. Soc., Boston, 20-23.

__________, and __________, 1991: Ice particle concentrations in small, maritime polar cumuliform clouds. Quart J. Roy. Meteorol. Soc., 118, 105-126. https://doi.org/10.1002/qj.49712051705

_________, and P. V. Hobbs: Further analyses of the Climax cloud-seeding experiments.  J. Appl. Meteor., 32, 1837-1847, 1993. https://doi.org/10.1175/1520-0450(1993)032%3C1837:FAOTCC%3E2.0.CO;2

__________, and __________, 2005: Microstructures and precipitation development in cumulus and small cumulonimbus clouds over the warm pool of the tropical Pacific Ocean.  Quart. J. Roy. Meteorol. Soc., 131, 639-673.  https://doi.org/10.1256/qj.04.13

__________, and D. M. Schultz, 2025: Great Expectations: A Review of the Colorado River Basin Pilot Project—The Nation’s Most Expensive Randomized Orographic Cloud-Seeding Experiment. Wea. Climate Soc.https://doi.org/10.1175/WCAS-D-24-0076.1

Rauber, R. M., and A. Tokay, 1991: An explanation for the existence of SLW at the top of cold clouds. J. Atmos. Sci., 48, 1005-1023. https://doi.org/10.1175/1520-0469(1991)048%3C1005:AEFTEO%3E2.0.CO;2

Thompson, G., T. Eidhammer, 2014: A study of aerosol impacts on clouds and precipitation development on a large winter cyclone. J. Atmos. Sci., 71, 3626-3658.  https://doi.org/10.1175/JAS-D-13-0305.1

Vardiman, L., 1978: The generation of secondary ice particles in clouds by crystal-crystal collisions. J. Atmos. Sci., 35, 2168-2180. https://doi.org/10.1175/1520-0469(1978)035%3C2168:TGOSIP%3E2.0.CO;2

___________, and C. L. Hartzell, 1976: Investigation of precipitating ice crystals from natural and seeded winter orographic clouds.  Final Report to the Bureau of Reclamation, Western Scientific Services, Inc., 129 pp. (Available from the Western Waters Digital Library, Special Collections, University of Washington).

APPENDIX

From the Summary and Conclusions section of Rangno (1972):

“A.  Cloud system top variation

The meteorological evidence accumulated in these five samples is.in essential agreement with the data compiled during the 1970 -71 operating season with respect to cloud system tops, namely, that they are highly variable within relatively short times {even within the same storm) and that the 500 mb temperature exhibits little skill in predicting cloud top temperatures. For example, as the sounding data for these storm periods demonstrates, some of the coldest cloud tops are observed with some of the warmest 500 mb temperatures and vice versa when the clouds are shallow.  In fact, it is difficult to escape the conclusion from these soundings that the 500 mb temperature is the least likely temperature of the cloud tops at any particular moment, and that the 500 mb surface merely forms the fulcrum point about which the tops continually oscillate suggesting a bimodal distribution.”

Catalina 2024-25 Water Year Ends with Above Normal Rainfall in September, But TWO Std Deviations Below Average!

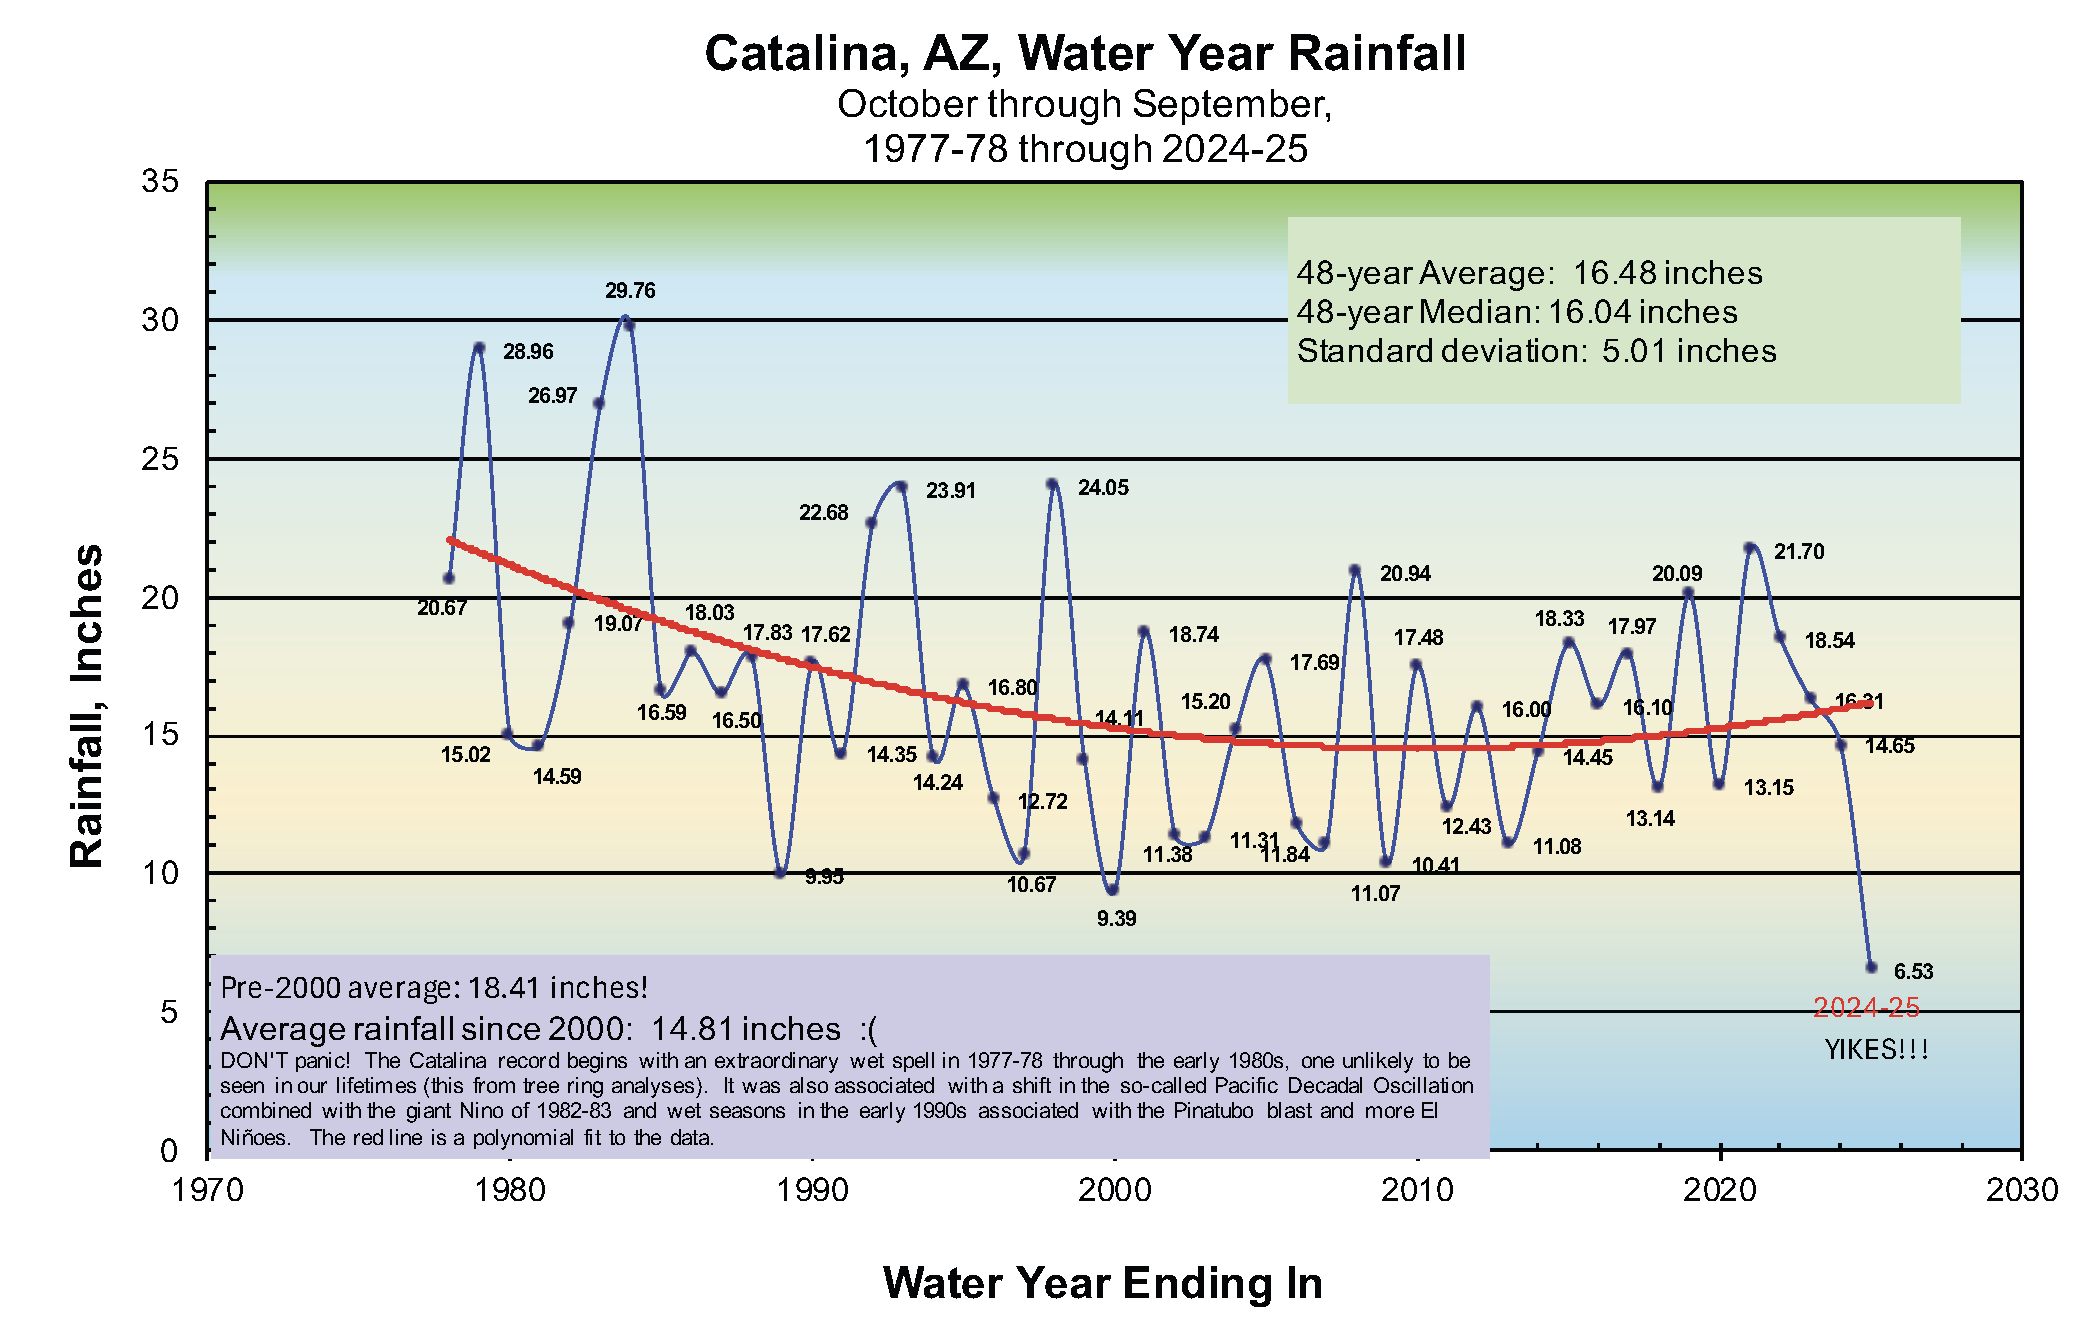
We experienced something “special” and horrible this past water year:  It was TWO standard deviations below average!  Calling climate change news conference now…

How’d we get here?

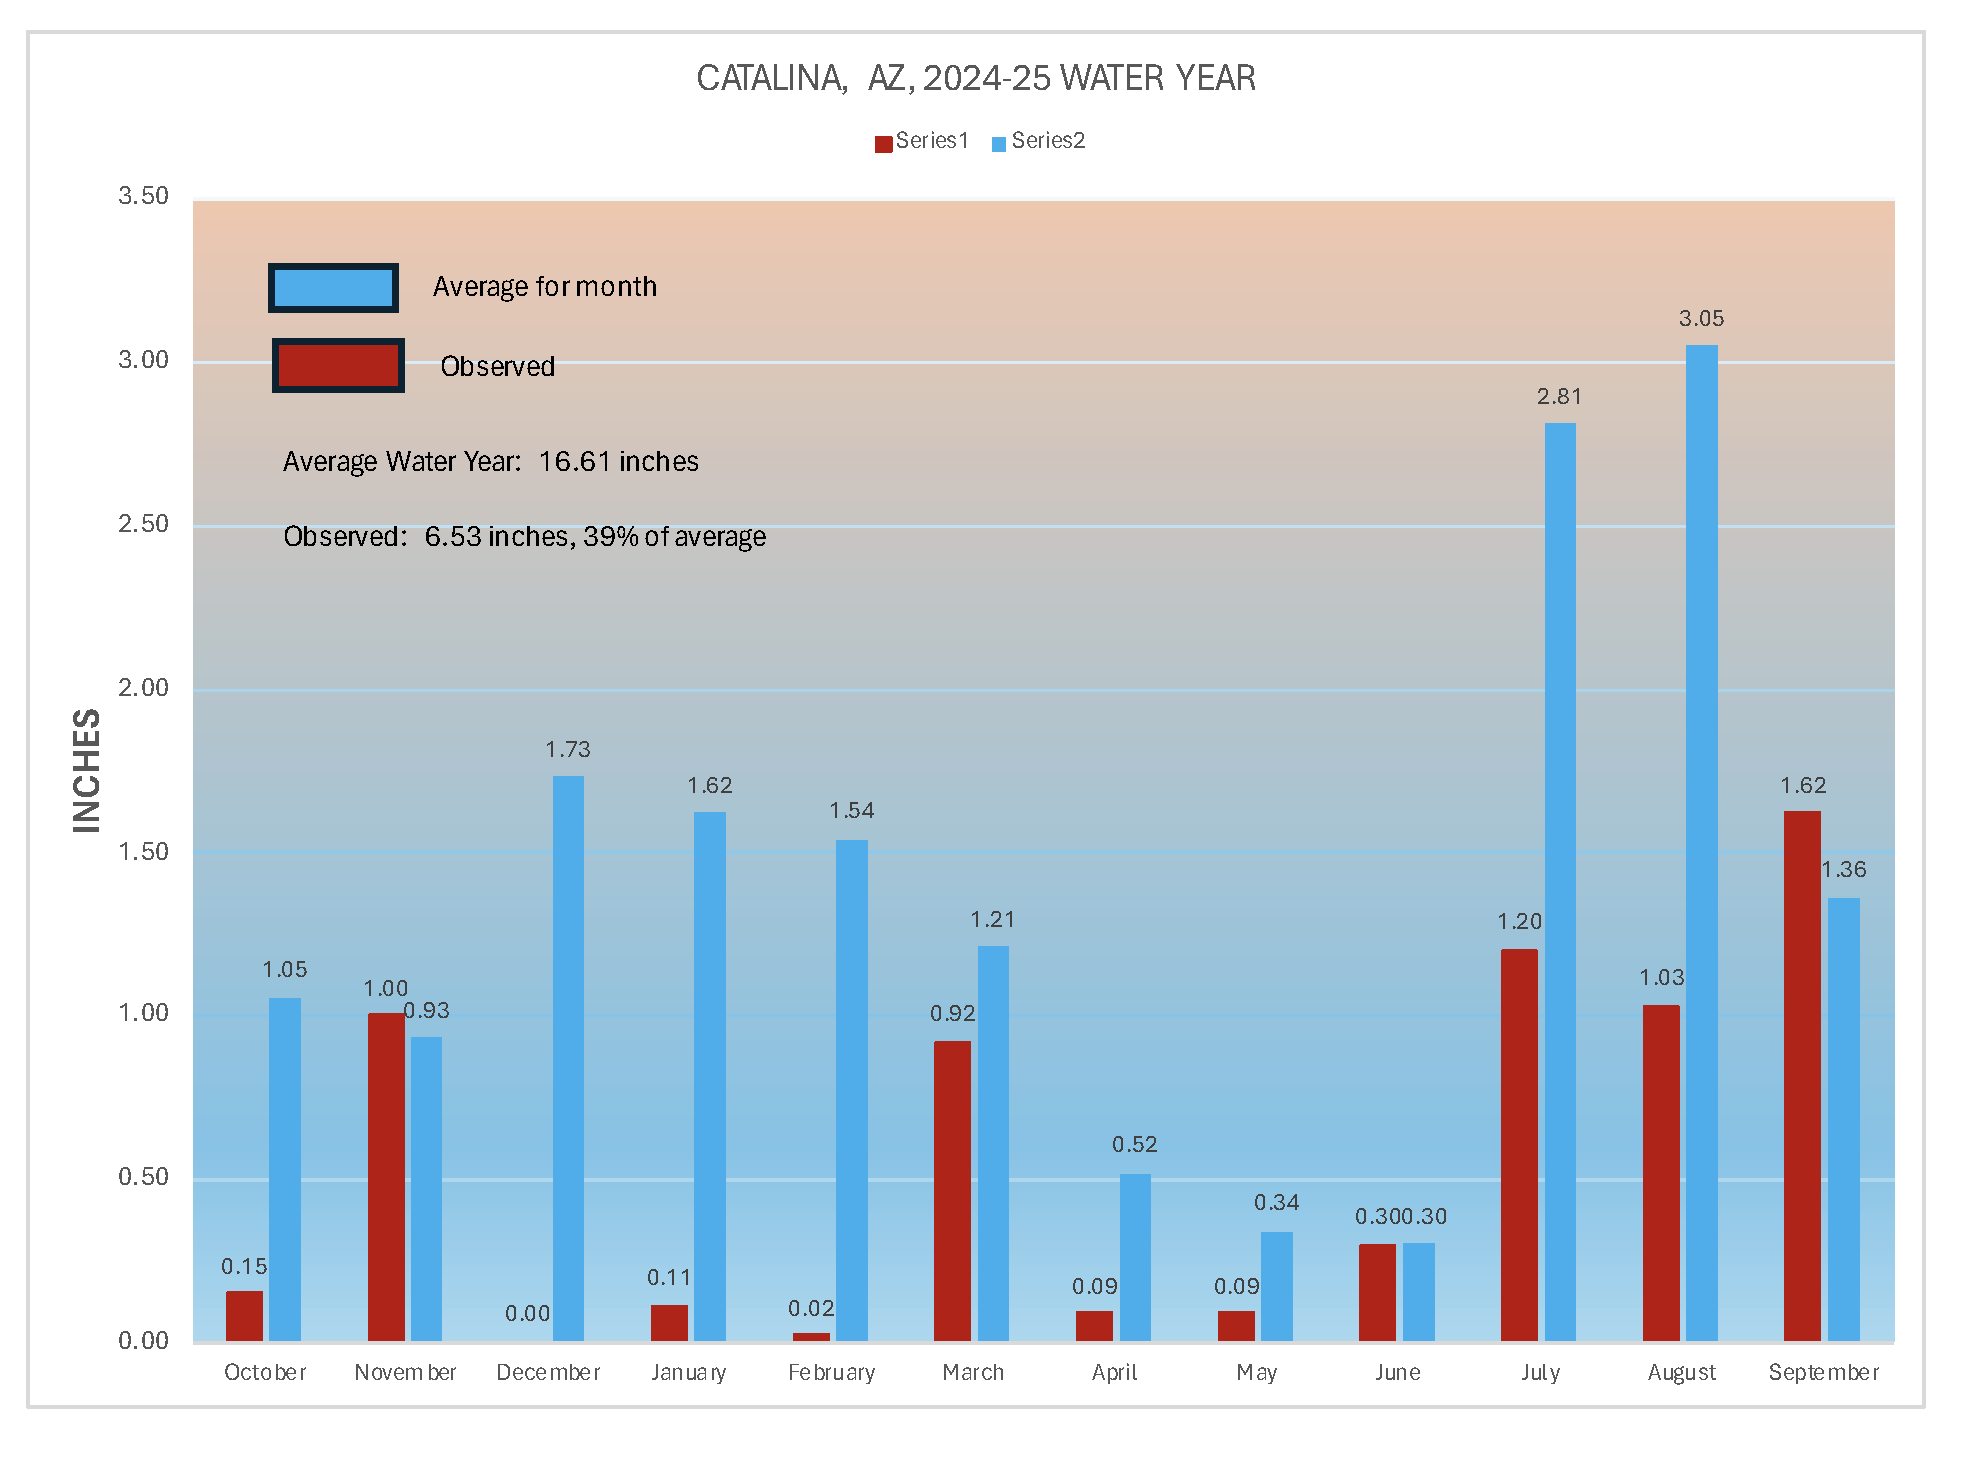
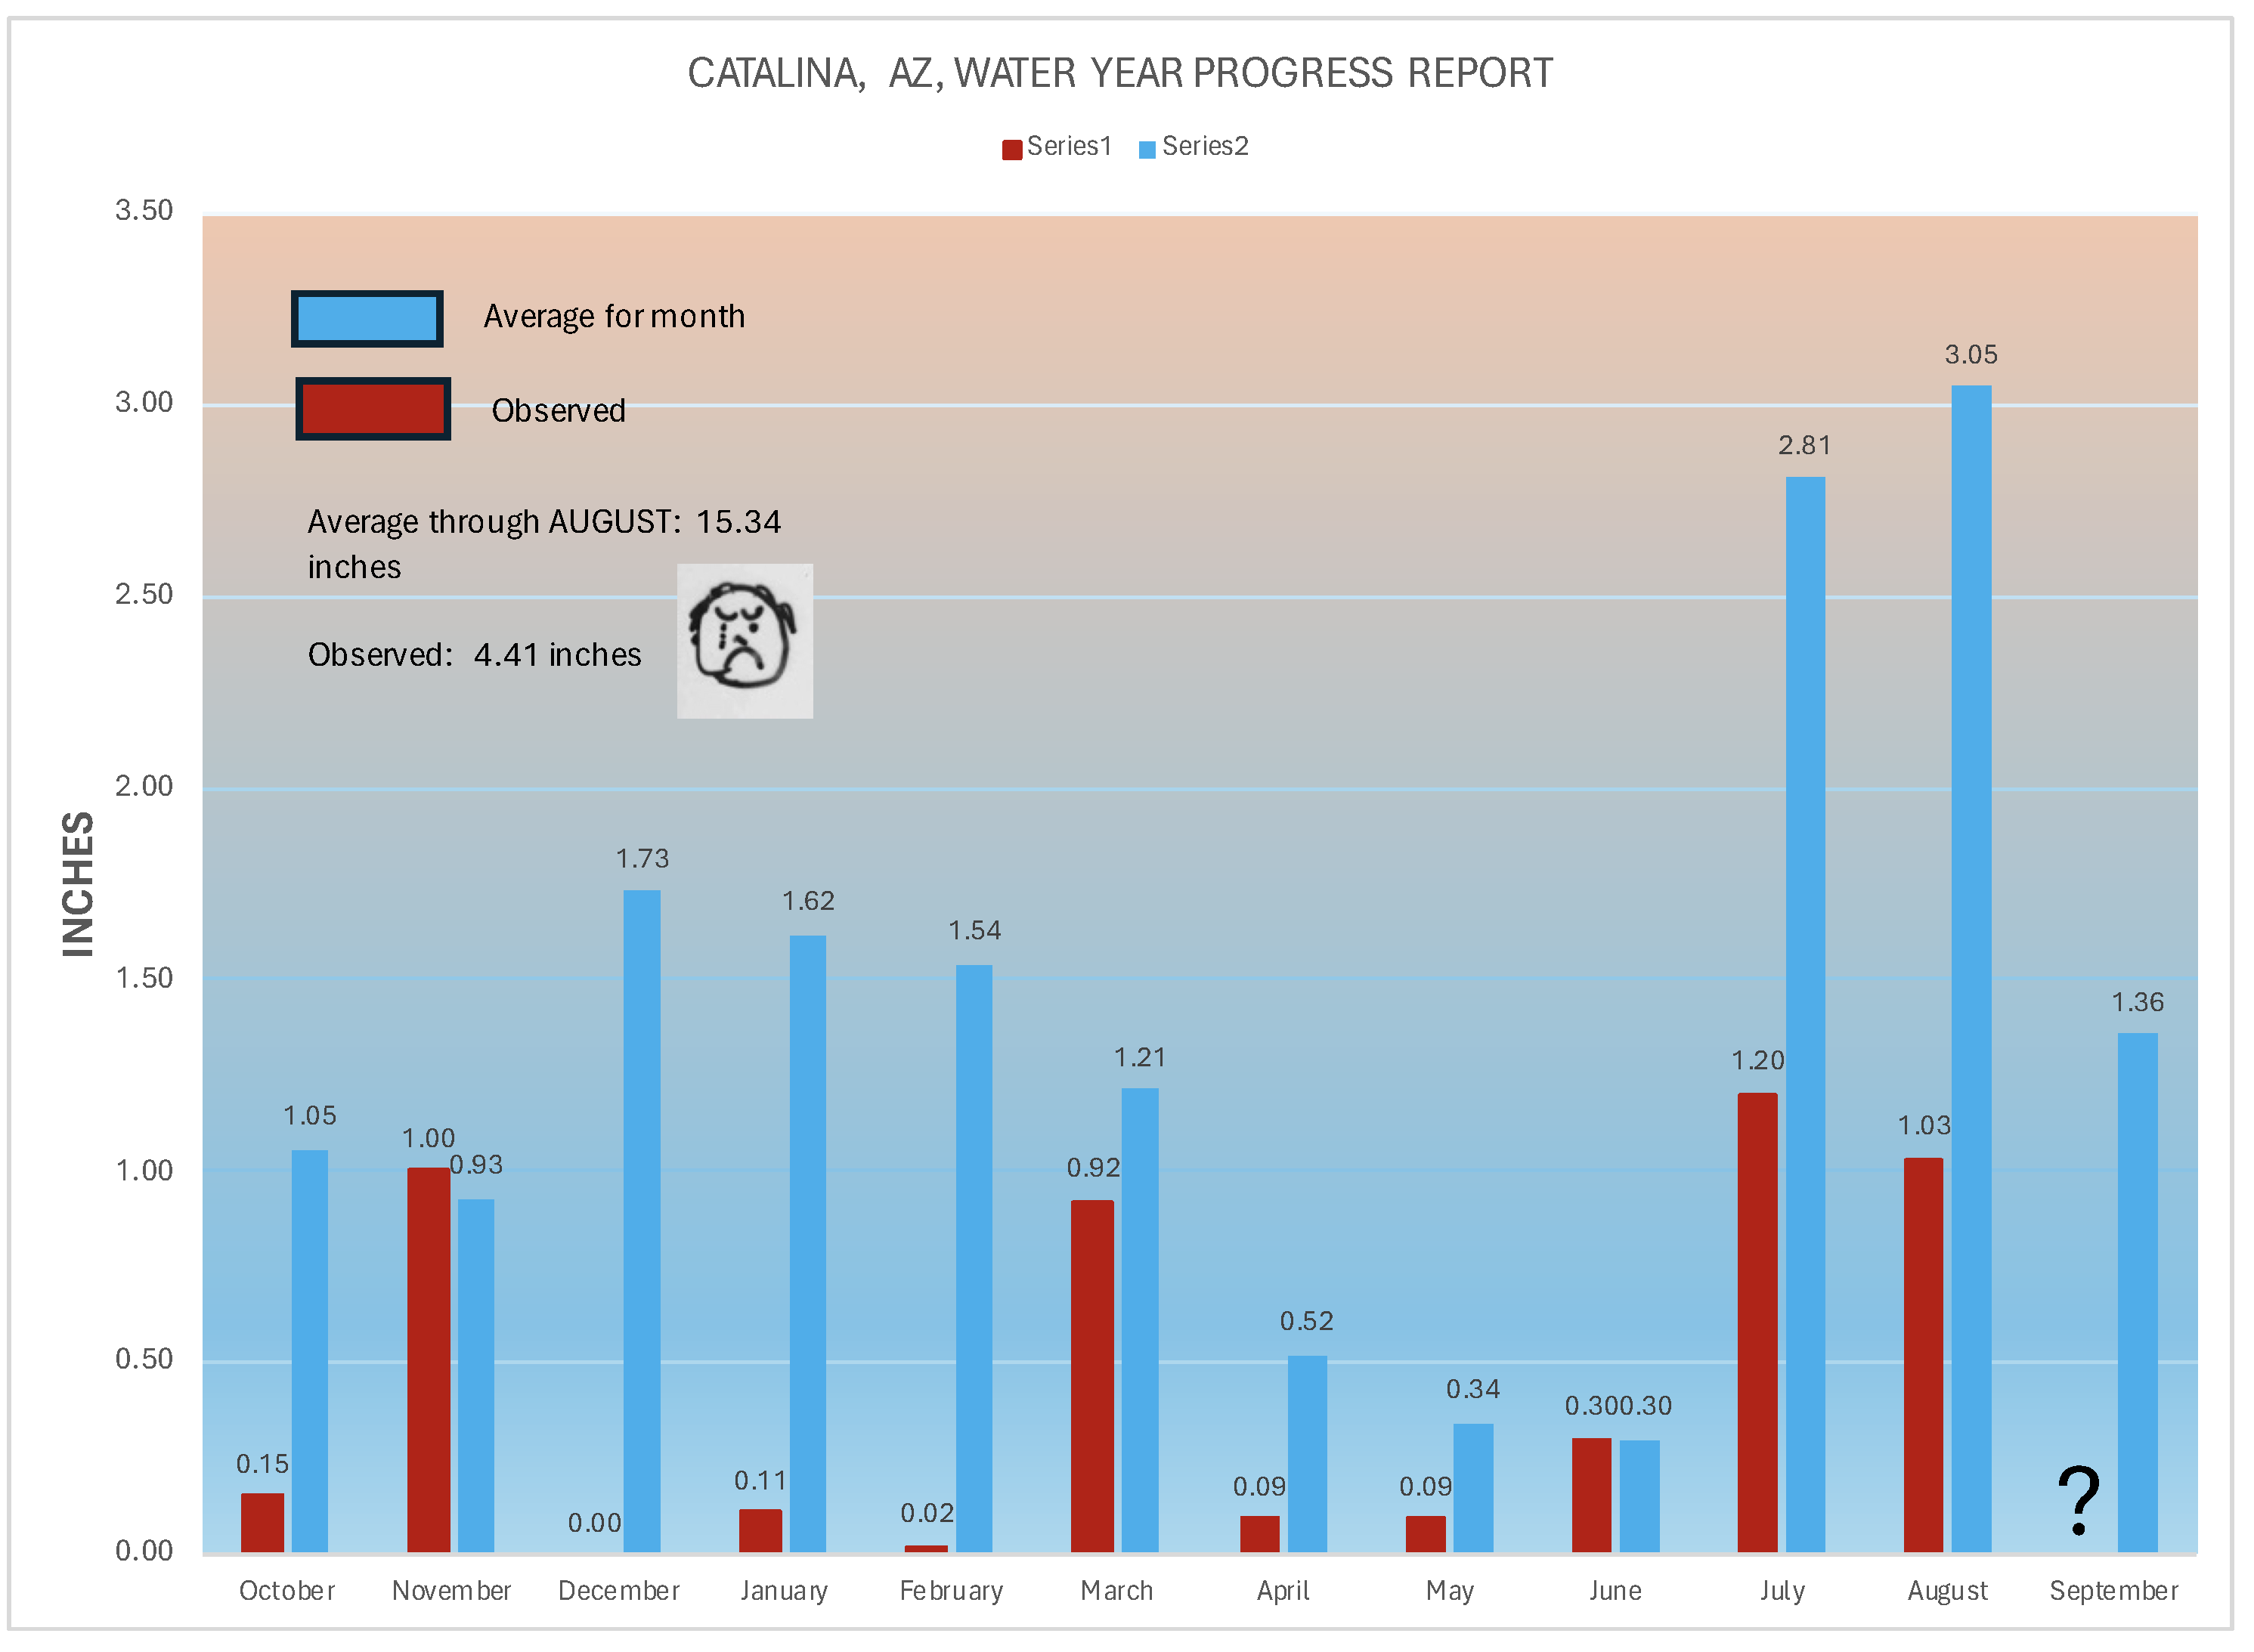
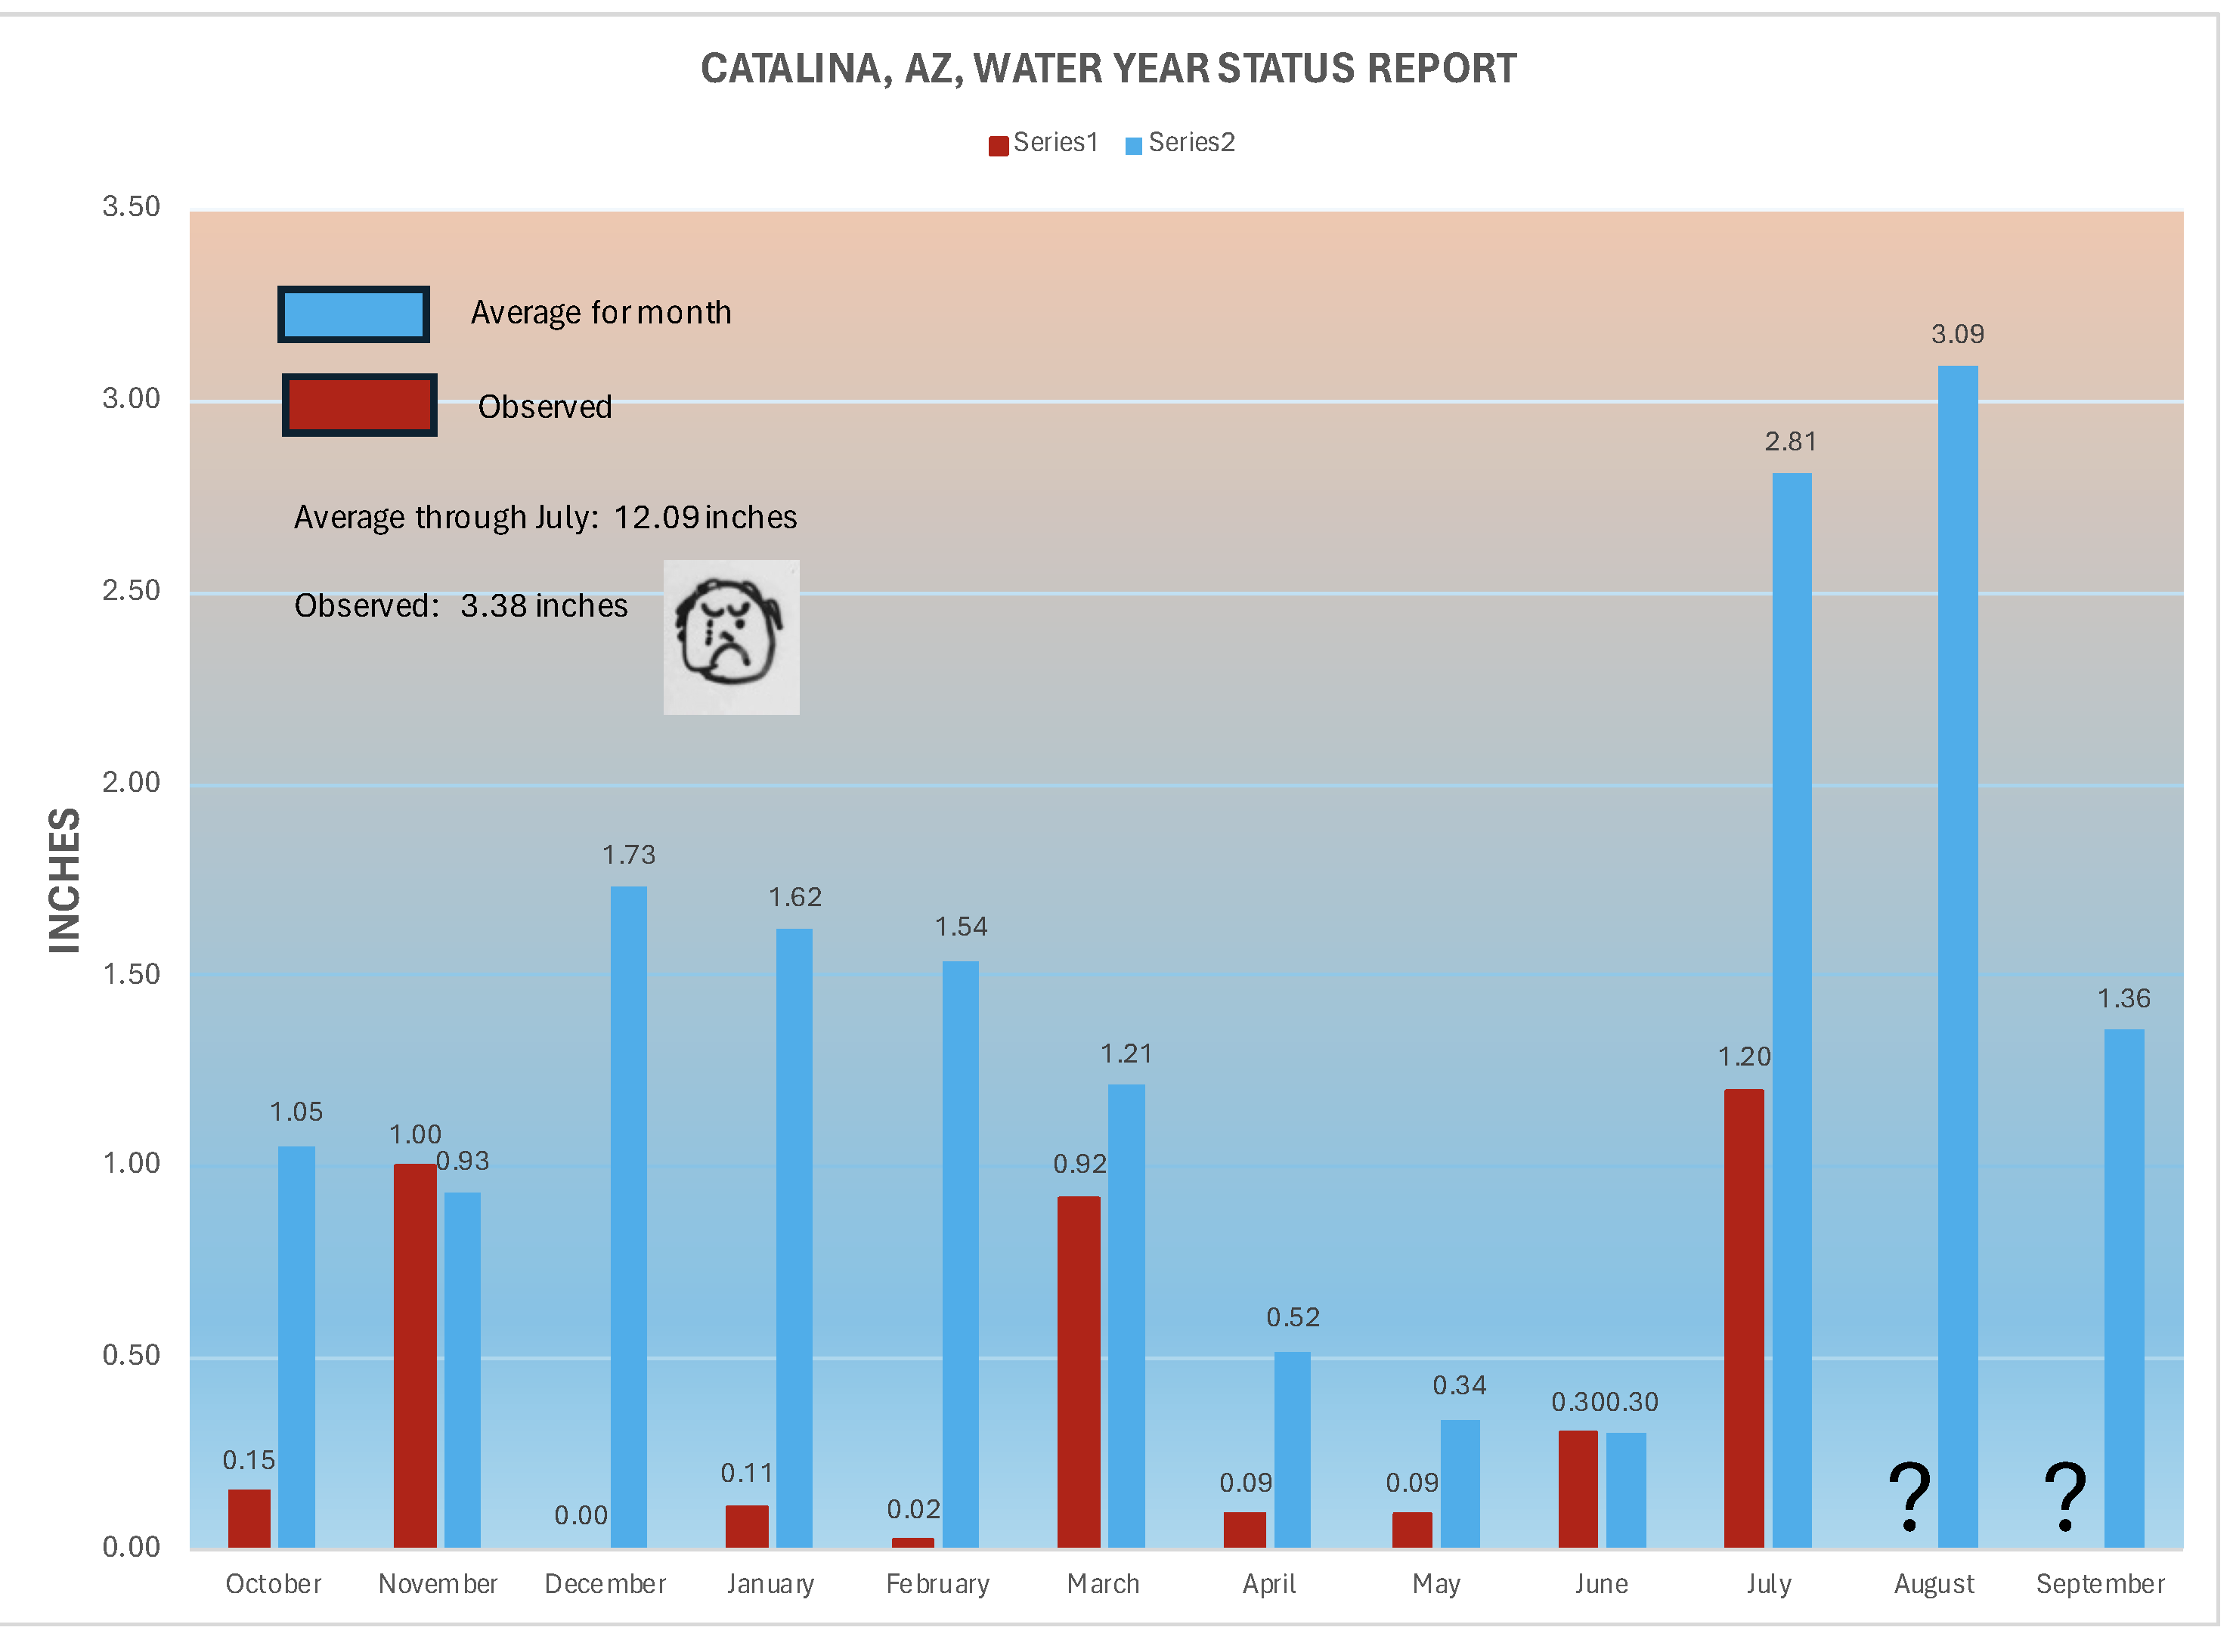
September was the only month in the past 12 with a noticeable rainfall total above average and the desert showed it with no spring greening, and barely one at the end of the summer rain season.   The previous low water year total was 9.39 inches in the 1999-2000 water year, to give you some idea how “off the charts” we were this water year.  But much of Arizona had more generous rains in September than Catalina,  but probably too much all at once at Globe.

Is this the new normal?  I don’t think so.   However, it is notable that our average water year total since 2000 is only 14.81,  down almost four inches from the WY average up to that point.  However, there are  reasons for that; big Niñoes and a big spurt from Mt. Pinatubo in the 15 years after the Catalina record started.  If the Catalina record had started in the droughty years of the 1950-early 1970s, you would not see a decline.

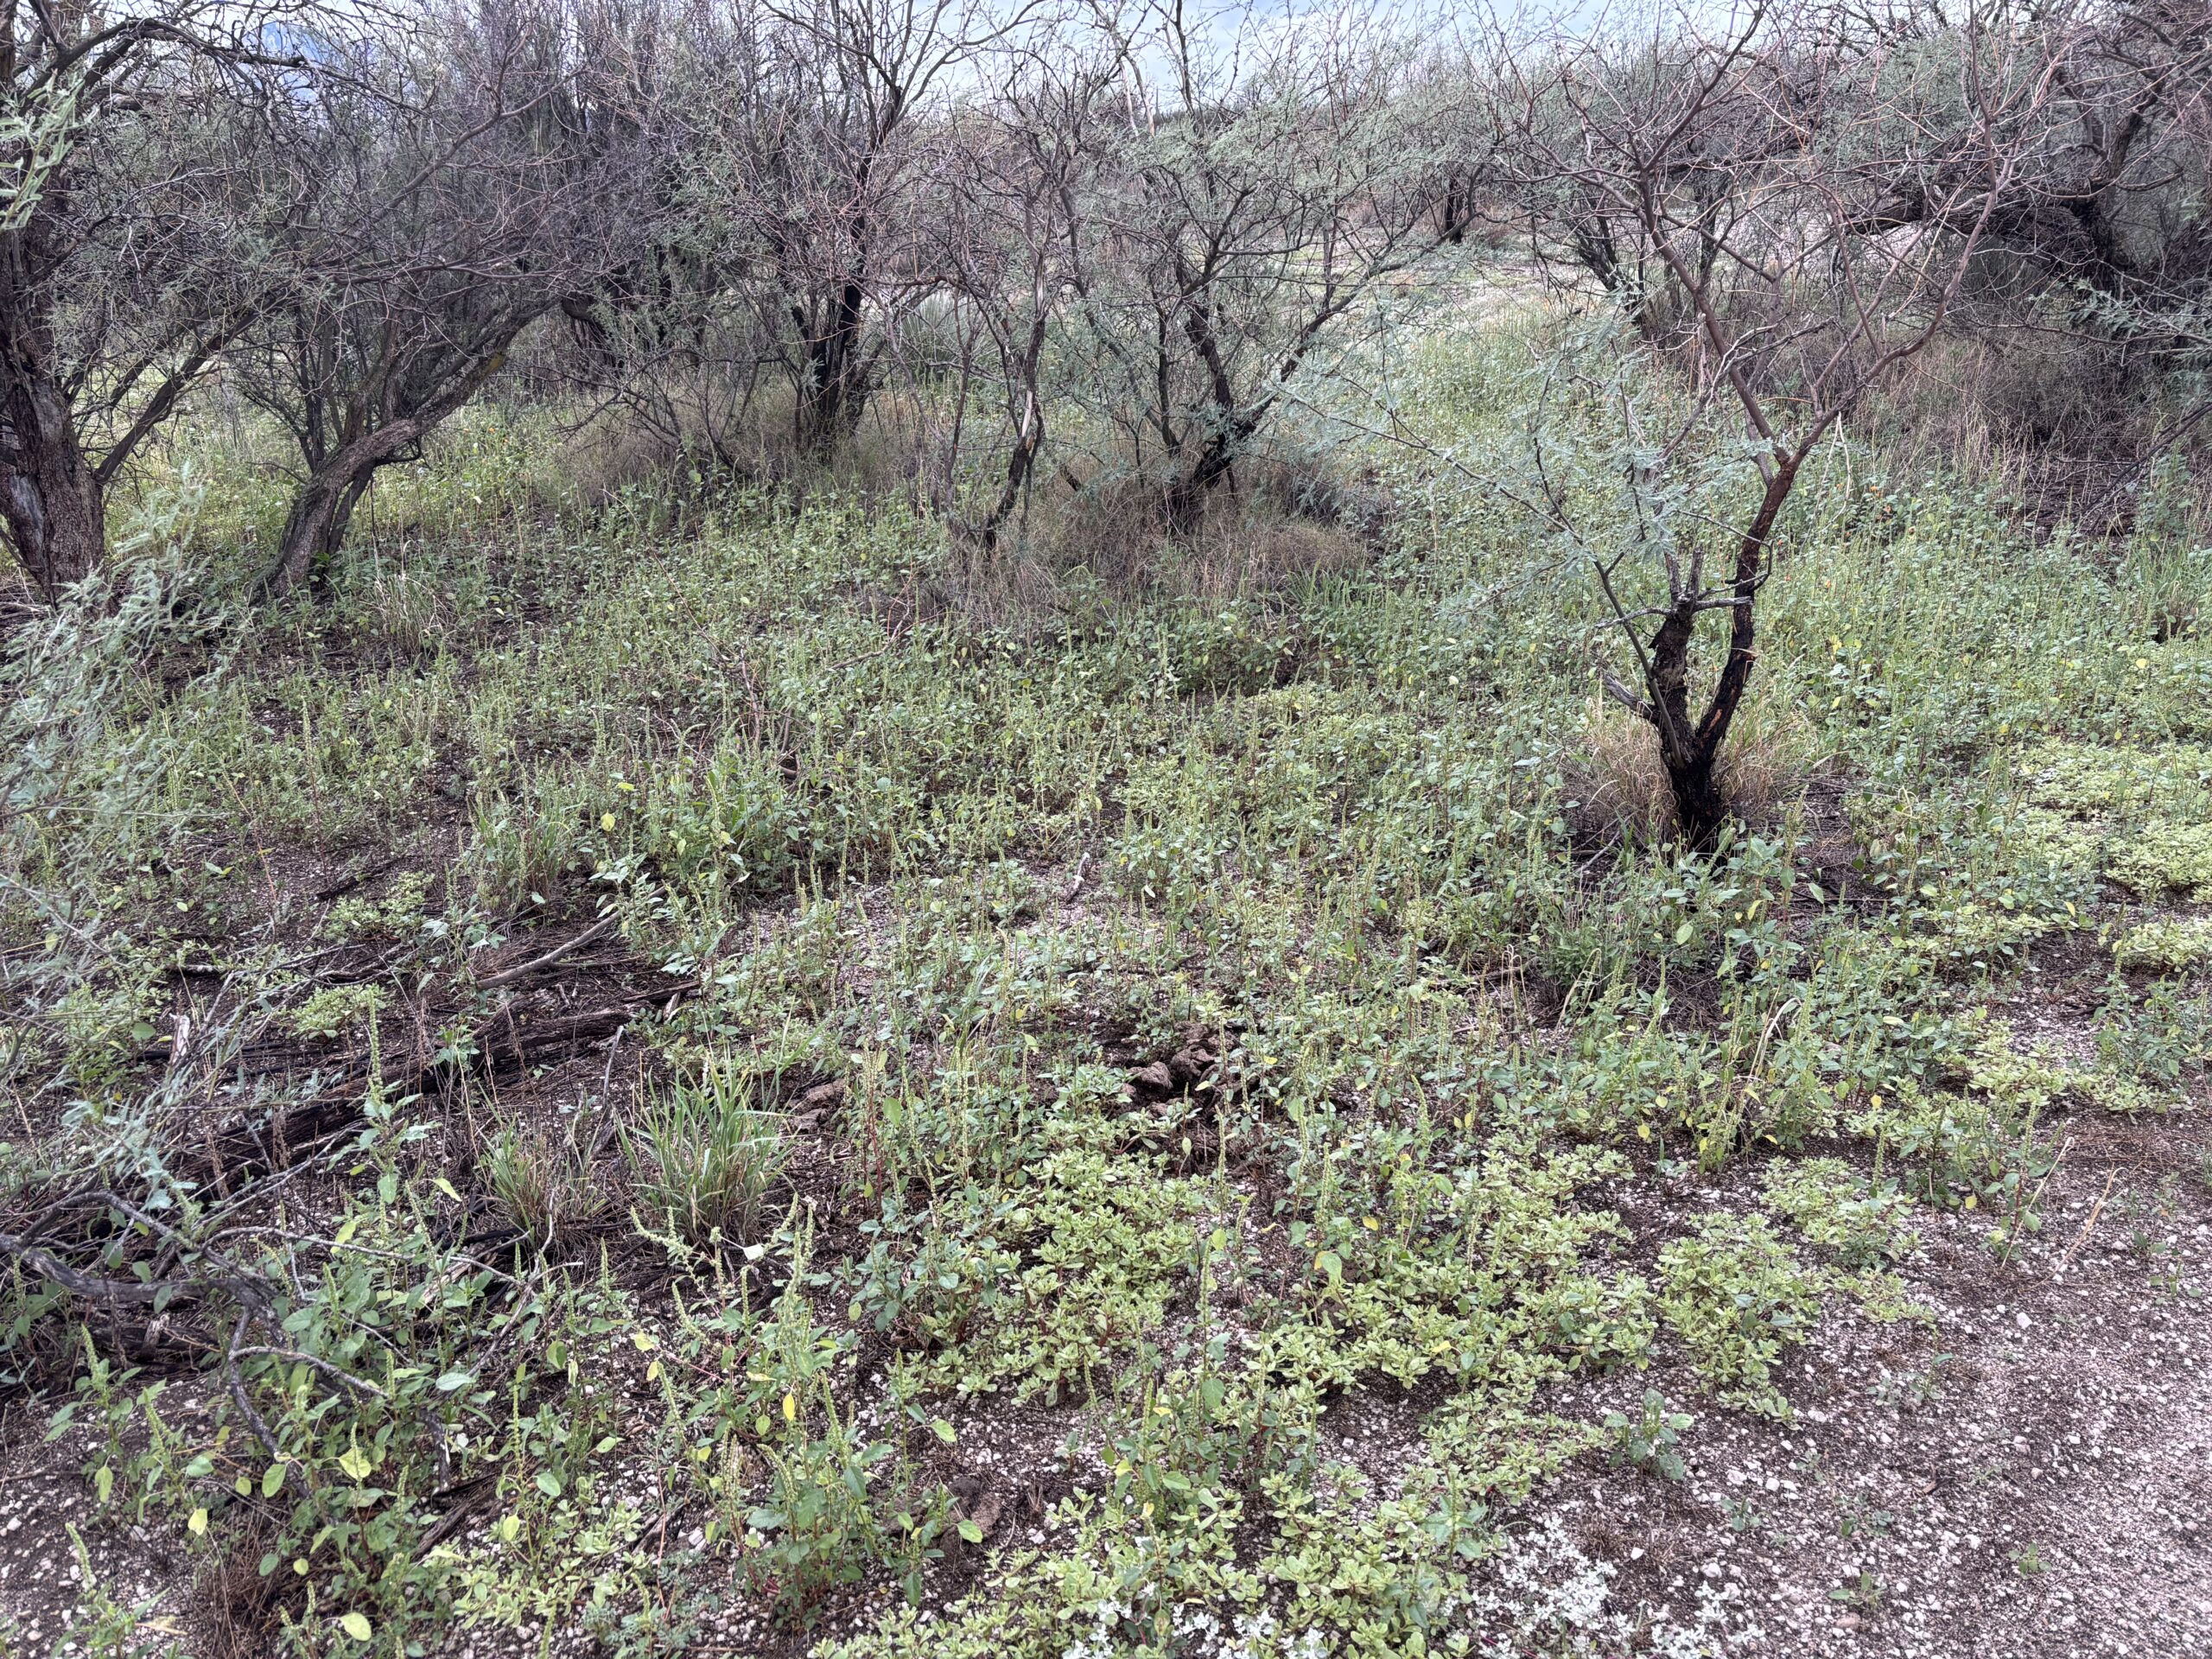
The last 30 days brought just over 2.5 inches to this site, beginning with a 0.95 inches drenching on August 26th, and the desert. despite how late the rains came, responded in spades.   The free range cattle on the State Trust lands, within a couple of weeks finally had new growth to munch on.  It was fantastic to see that!

The photo below was taken on September 17th, before the green started to fade under our declining sun and longer nights.  I was coming out of the Sutherland Wash with doggie, Cody.

The Climate Prediction Center of NOAA has a La Niña in the works.  As you may know, a La Niña is not so good for wintertime precipitation in Arizona.  The odds are that our below rainfall totals will continue in the coming months, with the usual outlier, and I hope that outlier is “ginormous,” as they can be.

===========

Looking Back at the Colorado River Basin Pilot Project Cloud Seeding Experiment

I know the millions of you out there have been wondering WHAT have I been doing to be so unproductive at this website for so long. Well, I was being productive in the PEER-REVIEWED literature!  Last July, the article appeared in the American Meteorological Society journal titled, “Weather, Climate, and Society.”  Prof. Dave Schultz, U. of Manchester, England,  my co-author is also the author of the book, “Eloquent Science” and a highly regarded atmospheric scientist.

The article:

https://journals.ametsoc.org/view/journals/wcas/17/3/WCAS-D-24-0076.1.xml

After it FINALLY (story on that some other time) “got  in” to a different journal than the one we started with, I got a request to write a shorter, more accessible version by someone I greatly admire,  Dr. Judith Curry (former chair, Atmospheric Sciences at Georgia Tech). That plain language, more candid version appeared on her website, Climate etc. not long afterwards.   I recommend Curry’s 2023 book for an even handed view of the climate problem, “Climate Uncertainty and Risk.”

The plain language version:

https://judithcurry.com/2025/08/08/cloud-seeding-history-looking-back-at-the-colorado-river-basin-pilot-project/

It then appeared on another widely viewed website, What’s Up With That, always worth reading, right away.  That was a big surprise.

https://wattsupwiththat.com/2025/08/09/cloud-seeding-history-looking-back-at-the-colorado-river-basin-pilot-project/

Now it’s spread to several other websites!  It is amazing to me that such an old story, but one that’s not such great a science one,  could draw so much attention today.  ALR

Catalina, AZ, 2024-25 Water Year Progress Report through August: “Read It and Weep”

During the sport’s columnist, Jim Murray’s time at the Los Angeles Times, they had a weekend listing of all the upsets titled, “Read’em and Weep.” I’ve pinched that title for this water year’s dreadful total; truly an “upset.”  No one saw a WY as deficient as this one coming.  Neighbors are putting out tubs of water for wildlife.  However, the near inch of rain a week ago has spawned a desert greening, with even summer poppies being spotted.  The free range cattle now have their noses on the ground scarfing up as much of this skin of greening as they can.  Pig weeds are already sprouting seeds at only 2-3 inches high!  I guess they know they have to do that when it’s this late and further moisture around here is a crap shoot.  Thankfully, too, the greening has muted the possibility of strong erosion that goes with all the bare ground we’ve had which has completely disappeared in many areas of the desert.

a

Catalina, AZ, 2024-25 Water Year Status Report through July

August has been a huge disappoint after July had but 43% of average rainfall.  In fact, this is the FIRST August in which the first 14 days have not had measurable rain in Catalina!  Yikes.  The desert looks awful, especially in those areas subject to brush removal and runoff enhancement projects hereabouts by the fire department last year.  Poor critters like our free range cattle are eating dead prickly pear cactus since there was no spring greening, and now virtually no summer greening either.  Here’s the bad news for our 2o24-25 water year through July.  Our best hope for some “juice” is the last ten days of August, according to recent model projections, and maybe, a dying hurricane remnant barging into the state in September.  Fingers crossed.

World Rainfall Extremes List as of 1958 for Perspective

In view of the recent Texas flood tragedy, and some outlandish climate change claims, I thought I would post this list copied off the back of “The Daily Weather Map” for my 1958 Reseda High School physics term project about weather.  That project ended with this table of world record rainfalls over various durations.  It seems there were plenty or rainfall “extremes” for almost a hundred years preceding 1958.  Some are pretty amazing.  Note those that had occurred in the USA for some perspective.

Catalina, AZ, June through September Number of Days with Measurable Rain, 1977-2024

OK, here we go!  Thunderstorms are almost upon us here in Catalinaland after our dismal, droughty October through May start to the Water Year with only 2.38 inches!  Average is 9 inches.  Boo.  

Some call our summer rain season a “monsoon.”  I’m pretty sure the native Americans that lived here for millions of years did NOT call the summer rain season, the “monsoon.”  (Hint:  “Monsoon” is an Arabic word.) But, in a moment of capitulation, let us hear from Monsoon, the band,  with Sheila Chandra singing, “Wings of the Dawn (of the Coming Monsoon)” as we celebrate the coming rains, ones that look pretty generous over a several day period beginning in early July:

https://youtu.be/3AAKvZgao8w

A Review and Enhancement of the Cloud Seeding Chapters in the 2007 book, “Human Impacts on Weather and Climate”

Another in a continuing possibly semi-useless series by this author….  This example probably indicates why I am not asked to review manuscripts in my expertise; cloud seeding and ice formation in clouds.  I try to follow in the footsteps of meteorologist and MIT faculty member, Fred Sanders, of whom it was said, “His reviews were sometime longer than the manuscript he was reviewing.”  I bet he didn’t get many manuscripts to review, either!

Oh, well, “we” trudge on.

——————-

Comments and “enhancements” on this work by my friends, William R. “Bill” Cotton and Roger Pielke, Sr., are in red. Necessarily, I am only presenting those portions of Cotton and Pielke’s book (those on cloud seeding) that require an “enhancement” or corrections for the reader and I have attempted to do this delicately.  Fortunately, because both are major scientists, they do not respond to criticism with emotion and are quite happy to see errors in their work corrected.  🙂

For the actual, extensive text leading up to these comments, you’ll have to buy the book.  Dashes are inserted where material, usually extensive,  is skipped to avoid too much copyright infringement.

Summary

The first three chapters are an excellent overall introduction to the topic  of weather modification.  The “Reference” section alone makes it worth the purchase of this book since it covers so much of the climate domain up to 2006.  The weather modification references needed beefing up and are done so here.

Oh, some background on what the climate was doing when this book on climate came out…  

Cotton and Pielke, Sr.’s book, hereafter,  “CP07,” came out during the middle of a hiatus in global warming, discussed a few years later in Science magazine by its reporter, Richard Kerr (2009) in, “What Happened to Global Warming?”  

About the time CP07  was published it also marked a time when the phrase, “global warming” (which was no longer occurring for unknown reasons) began to recede in use and was supplanted by the phrase, “climate  change,” something that is always happening on this great planet.  It made sense to change phrases since “climate change” would always be true whereas “global warming,” as we were learning in the 2000-2010 era, might not be.  (An aside:  I am a believer that CO2 will warm the earth in the decades ahead, but not catastrophically; I am strongly influenced in this belief by “influencers,” Roger Pielke, Jr., climate and policy expert, formerly of the University of Colorado but pushed out,  and Cliff Mass, weather and climate expert, still “intact male” at the University of Washington thanks solely to tenure.

Let us begin the review of CP07 with their acknowledgments which required an insertion by this writer:

Acknowledgments for CPO7

 The study of human impacts on weather and climate continues to be a high- interest topic area, not only among scientists but also the public. Our second edition has continued to build on our funded research studies from the National Science Foundation, the National Aeronautics and Space Administration, the Environmental Protection Agency, the Department of Defense, the National Oceanic and Atmospheric Administration, and the United States Geological Survey. Our numerous research collaborators at the Natural Resource Ecology Laboratory and Civil Engineering at Colorado State University have continued to provide valuable in sight on this subject. Over our multidecadal career, the fundamental insights into weather and climate provided by our education at the Pennsylvania State University have become increasingly recognized. We also want to recognize the perspective on these subjects, and science in general, that Robert and Joanne Simpson have provided us in our careers. Their mentorship and philosophy of research, of course, is but one of their many seminal accomplishments.

Roger Pielke would like to thank everyone who contributed to compiling the information in Tables 6.2 and 11.2 especially Roni A vissar, Richard Betts, Gordon Bonan, Lahouari Bounoua, Rafael Bras, Chris Castro, Will Cheng, Martin Claussen, Bob Dickinson, Paul Dirmeyer, Han Dolman, Elfatih Eltahir, Jon Foley, PavelKabat, George Kallos, Axel Kleidon, Curtis Marshall, Pat Michaels, Nicole Molders, Udaysankar Nair, Andy Pitman, Adriana Beltran-Przekurat, Rick Raddatz, Chris Rozoff, J. Marshall Shepherd, Lou Steyaert, and Yongkang Xue. In addition, Roger would like to thank Dr. Adriana Beltran for her assistance with figures in this edition.

As is always the case, Dallas Staley’s editorial leadership and Brenda Thompson’s assistance in completing the book has been invaluable and is very much appreciated.

However, we are unable to thank Mr. Arthur L. Rangno for his review of this book before it was published because we forgot to ask him.  Mr. Rangno is an acknowledged expert with several peer-reviewed publications on two of the cloud seeding experiments reviewed in this book; those carried out by Colorado State University (the home institution of CP07) at Climax and Wolf Creek Pass, Colorado, and those carried out in Israel conducted by the Hebrew University of Jerusalem.  Namely,  Art didn’t do sh. to improve our book beforehand since we also mostly ignored his scintillating 1997 email concerning the first edition of our book, CP95.  Nevertheless,  we are happy to have him review our 2nd edition (CP07) belatedly, i.e., provide a few review “cow pies” here and there on some of our otherwise excellent work.”  (Fake quote.)

If you would like to see how truly “scintillating” my email was to the lead author, go here

Since Professor Doctor William R. “Bill” Cotton does not thank any reviewers in CP07 while Prof. Doctor Roger Pielke, Sr., thanks many contributors, I am of the belief that the cloud seeding chapters, 1-3 in CP07,  were not reviewed by anyone until now.  Dr. Cotton is on record as favoring commercial  vendors of orographic cloud seeding.

So, off we go!

Chapter 1:  The rise of the science of weather modification by cloud seeding

Throughout history and probably prehistory man has sought to modify weather by a variety of means. Many primitive tribes have employed witch doctors or medicinemen, and human sacrifices to bring clouds and rainfall during periods of drought and to drive away rain clouds during flooding episodes. Numerous examples exist where modern man has shot cannons, fired rockets, rung bells, etc. in attempts to modify the weather (Changnon and Ivens, 1981).

—————

Seeding of supercooled cumulus clouds produced more controversial results. Dry ice and silver iodide seeding experiments were carried outat a variety of locations with the most comprehensive experiments being over New Mexico. Based on four seeding operations near Albuquerque, New Mexico, Langmuir claimed that seeding produced rainfall over a quarter of the area of the state of New Mexico. He concluded that “The odds in favor of this conclusion as compared to the rain was due to natural causes are millions to one.” Langmuir was evenmore enthusiastic about the consequences of silver iodide seeding over New Mexico. The explosive growth of a cumulonimbus cloud and the heavy rainfall near Albuquerque and Santa Fe were attributed to the direct results of ground-based silver iodide seeding. In fact Langmuir concluded that nearly all the rainfall that occurred over New Mexico on the dry ice seeding day and the silver iodide seeding day were the result of seeding.

The claim by Langmuir was found to be false in an analysis by the Scientific Services Division of the Weather Bureau, represented by Ferguson Hall.  Others chimed in with Hall also publishing in Science magazine:   Gardener Emmons, NYU, Bernard Haurwitz, NYU, Hurd Willett, MIT, and George Wadsworth, MIT.

———————

Convinced that cloud seeding was a miraculous cure to all of nature’s evils, Langmuir and his colleagues carried out a trial seeding experiment of a hurricane with the hope of altering the course of the storm or reducing its intensity. On October 10, 1947, a hurricane was seeded off the east coast of the United States. About 102 kg of dry ice was dropped in clouds in the storm. Due to logistical reasons, the eye wall region and the dominate spiral band were not seeded. Observers interpreted visual observations of snow showers as evidence that seeding had some effect on cloud structure. Following seeding, the hurricane changed direction from a northeasterly to a westerly course, crossing the coast into Georgia. The change in course may have been a   was the result of the storm’sinteraction with the larger-scale flow field. Nonetheless, General Electric Corporation became the target of lawsuits for damage claims associated with the hurricane.

In summary, Project Cirrus launched the United States and much of the world into the age of cloud seeding. The impact of this project on the science of cloud seeding, cloud physics research, and the entire field of atmospheric science was similar to the effects of the launching of Sputnik on the United States aerospace industry.

This discussion lacks mention of perhaps the most influential paper of all those that motivated cloud seeding throughout the world; that of Kraus and Squires (1947) reporting spectacular results from an Australia seeding experiment.  The KS47 paper, appearing in the high-end journal, Science, purported that two drops of dry ice totaling 250 lbs. into a Cumulus congestus cloud at 23,000 feet spawned a massive, isolated storm that towered to possibly “40,000 feet,” lasted for hours and dropped heavy rains over “20 square miles.”  This was the only cloud that appeared to respond so impressively to dry ice seeding on that flight day.   The Kraus and Squires report was seen as evidence that drought might be alleviated with few hundred pounds of dry ice, and as a result,  widespread cloud seeding took off as entrepreneurs hastily formed cloud seeding companies such as North American Weather Consultants, Atmospherics, Inc., Irving P. Krick Associates, among many others.  The series of photographs of the apparent response of that Cumulus cloud to seeding continued to be published as proof what cloud seeding could do for almost 40 years after KS47 (e.g., Orville 1986). 

Caveat Emptor:

HOWEVER, in independent dry ice seeding tests on Cumulus clouds by the U. S. Weather Bureau (Coons et al. 1949, Coons and Gunn 1951) no explosion of a cloud occurred as KS47 had described after seeding.  Instead, they reported, the seeded Cumulus clouds generally sank back down after dropping up to 100 lbs. of dry ice into them.  Also, they reported that natural precipitation had formed in similar Cumulus clouds in the vicinity.  It wasn’t clear to Coons et al. that dry ice seeding had made a difference.

——————-

Chapter 2:  The glory years of weather modification

  • Introduction

The exploratory cloud seeding experiments performed by Langmuir, Schaefer, Kraus and Squires, and Project Cirrus personnel fueled a new era in weather modification research as well as basic research in the microphysics of precipitation processes, cloud dynamics, and small-scale weather systems, in general. At the same time commercial cloud seeding companies sprung up worldwide practicing the art of cloud seeding to enhance and suppress rainfall, dissipate fog, and decrease hail damage. Armed with only rudimentary knowledge of the physics of clouds and the meteorology of small- scale weather systems, these weather modification practitioners sought to alleviate all the symptoms of undesirable weather by prescribing cloud seeding medication. The prevailingview was “cloud seeding is good!”

  • The static mode of cloud seeding

We have seen that the pioneering experiments of Schaefer and Langmuir suggested that the introduction of dry ice or silver iodide into supercooled clouds could initiate a precipitation process. The underlying concept behind the static mode of cloud seeding is that natural clouds are deficient in ice nuclei.

2For an excellent,  more technical review of static seeding, see Silverman (1986).

———————

The rime-splinter secondary ice crystal production process may not explain all the observations of high ice crystal concentrations relative to ice nuclei estimates but it is consistent with many of them. Still other processes, such as drop fragmentation during freezing (Korolev et al. 2004, Rangno and Hobbs 2005) and fragmentation of delicate ice particles (e.g.,Vardiman 1978) are not well quantified understood at this time may be operating operate in some cases of observed high ice crystal concentrations relative to ice nuclei concentrations.

The implication of these physical studies is that the “window of opportunity” for precipitation enhancement by cloud seeding is much smaller than was originally thought. Clouds that are warm-based and maritime have a high natural potential for producing precipitation. On the other hand, clouds that are cold-based and continental have reduced natural potential for precipitation formation and, hence, the opportunity for precipitation is much greater, although the total water available would be less than in a warm-based cloud.

This is consistent with the results of field experiments testing the static seeding hypothesis. The Israeli I and II experiments were quite successful in producing positive yields of precipitation in seeded clouds (Gagin and Neumann, 1981). The clouds that were seeded over Israel had relatively cold bases(5-8°C) and were generally continental such that there was little evidence of a vigorous warm rain process or the presence of large quantities of heavily rimed graupel particles.

This paragraph was copied verbatim from the first edition of this book,  CP95.  This paragraph should not have been copied and pasted into CP07 because it was not even valid at the time of CP95.  For example, strong evidence of ice multiplication and warm rain processes that undercut the “ripe for seeding” Cumulus descriptions that made the statistical successes of the Israeli experiments so credible (e.g., Silverman 1986) had appeared in 1988 (Rangno).

CP07 (and CP 95) were not aware of, or chose also not to cite,  Gabriel and Rosenfeld (1990) which published the “crossover” result of seeding for Israeli II for the first time. Crossovers consist of combining the results of random seeding in two targets.  The crossover evaluation had been mandated by the Israeli Rain Committee prior to Israeli II (Silverman 2001).    The important result for Israeli II was -2% effect on rainfall, not statistically significant.    Thus, Israeli II had not replicated Israeli I, as also concluded by Rangno and Hobbs (1995), and Silverman (2001).  For comparison, the Israeli I crossover result had indicated a statistically significant 15% increase in rain (e.g., Wurtele 1971).

The null crossover result in Israeli II was due to apparent increases in rain due to seeding in the north target that were canceled out by indications of a whopping 15% decrease in rainfall on seeded days in the south target.  Numerous questions about the “ripe for seeding” clouds of Israel would have been raised had the results for the south target of Israeli II been reported in a “timely manner” and not hidden from view until 1990.

CP07 acknowledge some of the evidence against the Israeli seeding successes later in this chapter, but not all.  This is an improvement over CP95 that had not cited any counter evidence regarding those experiments.   However,  in CP07 the reader will get two interpretations of the same experiments in one book.

———

A number of observational and theoretical studies have also suggested that there is a cold temperature “window of opportunity” as well. Studies of both orographic and convective clouds have suggested that clouds colder than-25°C have sufficiently large concentrations of natural ice crystals that seeding can either have no effect or even reduce precipitation (Grant and Elliot, 1974; Gagin and Neumann, 1981; Gagin et al., 1985; Grant, 1986). It is possible that seeding such cold clouds could reduce precipitation by creating so many ice crystals that they compete for the limited supply of water vapor and result in numerous, slowly settling ice crystals which evaporate before reaching the ground. Such clouds are said to be overseeded.  

There are also indications that there is a warm temperature limit to seeding  effectiveness (Grant and Elliot, 1974; Gagin and Neumann, 1981; Cooper and Lawson, 1984). This is believed to be due to the low efficiency of ice crystal production by silver iodide at temperatures approaching -4 °C and to the slow rates of ice crystal vapor deposition growth at warm temperatures. Thus there appears to be a “temperature window” of about -10°C to -25°C where clouds respond favorably to seeding (i.e., exhibit seedability).

CP07 were not aware of, or chose not cite, the extensive literature that contradicted the claims of Grant and Elliott (1974) concerning a cloud top temperature range in which cloud seeding is supposedly viable. This led CP07 to “cut and paste from CP95 that there is a viable cloud seeding window for clouds (with tops) having a temperature range from -10°C to -25°C.  We note that CP07 do not use the term “cloud top” in this discussion, but that’s what the papers they reference are referring to, not just a temperature range within a cloud deck.

That a viable cloud top temperature seeding window of -10°C to -25°C exists as CP07 purport was dealt a severe blow in the Rockies by several papers in which high (10s to 100 per liter) concentrations of ice particles were reported in wintertime clouds with tops  >-25°C including even a contribution from Grant (leader of the Climax, CO, experiments) in Hobbs (1969).

Some of the overlooked papers are: Auer et al. (1969), Cooper and Vali (1981), Marwitz et al. 1976, Cooper and Marwitz 1980, and ground ice crystal concentration reports by Vardiman 1978, and by Vardiman and Hartzell (1976) in support of the Colorado River Basin Pilot Project, and by Grant et al.’s 1982 airborne study that reported no correlation with cloud top temperatures and ice particle concentrations in stable orographic clouds.   

So, the “window of opportunity” for cloud seeding was, at the time of CP95 and in CP07, known to be much more limited compared to what they were in their books.  I brought some of this counter evidence against this purported seeding window to the attention of the first author of CP07 in an email in 1997 to no avail.

There was also a serious drawback to the Grant and Elliott (1974)  study that CP95 and CP07 depended upon; they did not measure cloud top temperatures in the projects they evaluated.  Instead,  Grant and Elliott used constant pressure surfaces as proxies of cloud tops. The use of a constant pressure temperature was shown to be invalid as an index of cloud top temperatures on several occasions (Rangno 1972, 1986, Bartlett et al. 1975, Elliott et al. 1976, Hobbs and Rangno 1979, Mielke 1979, Hill 1980). These studies also went under the CP95 and CP07 “radar.”

There is a similar drawback to the Gagin and Neumann (1981) study; they measured radar tops, not cloud tops; the latter are higher, and their claim of having measured the top of “every cell” in Israeli II, was not true. It was impossible to see the tops of cells in the north end of the north target of Israeli II, nor even very close by when appreciable rain was falling on the Israel Meteorological Service’s 3-cm wavelength radar that Gagin and Neumann used for this purpose (personal communication, 1987, Mr. K. Rosner, the Israeli experiments’ chief meteorologist).  

—————–

Physical studies and inferences drawn from statistical seeding experiments suggest there exists a more limited window of opportunity for precipitation enhancement by the static mode of cloud seeding than originally thought. The window of opportunity for cloud seeding appears to be limited to:

  • clouds that are relatively cold-based and continental;
  • clouds having top temperatures in the range -10°C to -25°C;

The above sentence about cloud top temperatures is profoundly incorrect because neither in CP95 and in CP07 were the authors aware of, or chose not to cite, the many publications concerning wintertime ice in clouds that contradict the assertion that this temperature range presents a viable cloud seeding window.

  • a timescale limited by the availability of significant supercooled water before depletion by entrainment and natural precipitation

We must also recognize that implementing a seeding experiment or operational program that operates only in the above listed windows of opportunity is extremely difficult and costly. It means that in a field setting we must forecast the top temperatures of clouds to assure that they fall within the -10 – 5°C  to perhaps to -15°C  – 25°C  temperature window.

The temperature range above is adjusted to reflect the modern knowledge of ice in clouds in the Rockies and the improved AgI formulations that work more efficiently at higher temperatures.  However, at the higher cloud top temperatures in this range (-10°C to -15°C) in the high barriers of the Rockies the wintertime clouds tend to be too thin for appreciable modification potential.

In summary, the static mode of cloud seeding has been shown to cause the expected alterations in cloud microstructure including increased concentrations ofice crystals, reductions of supercooled liquid water content, and more rapid production of precipitation elements in both cumuli (Cooper and Lawson, 1984) and orographic clouds (Reynolds and Dennis, 1986; Reynolds, 1988; Super and Boe, 1988;Super and Heimbach, 1988; Super et al., 1988).

The documentation of increases in precipitation on the ground due to static seeding of cumuli, however, has been far more elusive with the Israeli  experiment (Gagin and Neumann, 1981) providing the strongest evidence that static seeding of cold-based, continental cumuli can cause significant increases of precipitation on the  ground.

The above statement shouldn’t have been copied and pasted from CP95 into CP07 considering the published contrary evidence available that was available prior to both editions.

The evidence that orographic clouds can cause significant increases in snowpackis  far more compelling, particularly in the more continental and cold-based orographic clouds  (Mielke et al., 1981; Super and Heimbach, 1988).

By citing Mielke et al. 1981, CP07 indicate a lack of awareness of the published literature regarding the experiments conducted at Climax, CO.  Mielke et al. 1981 stratified their results by 500 mb temperatures, which have no meaning for cloud properties as Mielke (1979) himself reported. For those of us who follow the cloud seeding literature, this was a bizarre occurrence in peer-reviewed literature; the official journal reviewers and journal editor who were responsible for this science oxymoron, take note.

A dark cloud (no pun intended) was cast on all of the Colorado State University cloud seeding reports when Rangno and Hobbs (1987) used independent data reduced by NOAA personnel to evaluate the Climax experiments precipitation and upper-level temperature.  CSU personnel had reduced the data in Climax II to speed reporting of its results.  But this was contrary to the prior statements made by the experimenters about these having been independently made measurements (Mielke 1995).  

Rangno and Hobbs (1987) found that the CSU errors created the replication of Climax I by Climax II .  Moreover,  Climax II’s early tainted success through it’s first two years (reported to the Bureau of Reclamation’s cloud seeding division in Grant et. al. 1969,  helped spur the decision by the BOR to fund the massive seven million dollar Colorado River Basin Pilot Project as well as provide CSU and their consultants with about $500,000 to design that experiment in June 1968.   The Climax II errors had a profound effect; Climax I had been virtually error-free.

Furthermore, Rhea (1983) uncited by CP 95 or by CP07,  showed that the optimistic result by Mielke et al. (1981) for Climax II was due to a mistiming of precipitation gauge readings between the target and the control gauges, and not due to cloud seeding.  Thus Climax II did not replicate Climax I as was widely believed.  (Rhea 1983 was published AFTER he made revisions to his paper as had been suggested by Grant et al. in a “Comment” and “Reply” journal exchange behind the scenes.  However, Grant et al. (1983) did not revise their original “Comment” after Rhea made his revisions, an act that misled readers when reading the published exchange in the journal.  Rhea, in a private communication to me in 1986 considered the Grant et al. “Reply” a “smokescreen.”

But even these conclusions have been brought into question. The Climax I and II wintertime orographic cloud seeding experiments (Grant and Mielke; 1967; Chappell et al., 1971; Mielke et al., 1971, 1981) are generally acknowledged by the scientific community (National Academy of Sciences, 1975 1973; Tukey et al., 1978) for providing the strongest evidence that seeding those clouds can significantly increase precipitation.

Nonetheless, Rangno and Hobbs (1987, 1993) question both the randomization techniques and the quality of data collected during those experiments.  They and concluded that the Climax II experiment failed to confirm that precipitation can be increased by cloud seeding in the Colorado Rockies when the NOAA-published precipitation and upper level data for the Climax II experiment was used to evaluate it. Even so, Rangno and Hobbs(1987) did show that precipitation may have been increased by about 10%in the combined Climax I and II experiments

CP07 did not read Rangno and Hobbs (1993),  The 10% increase in snow  CP07 assume occurred was due to Grant and Mielke (1967) building in a huge seeding effect in Climax I in the high 500 mb temperature storm category via the choice of controls mid-way through Climax I.  This initial act caused the entire Climax experiments to suggest an ersatz 10% increase in snow due to seeding in the high 500 mb temperature category.Moreover, the 10% was not statistically significant via 1000 re-randomizations of the combined experiments CP07 refer (I. Gorodnoskya, personal communication, University of Washington Academic Computing Center, 1987, unpublished result).

Once the controls were hard-wired, no further indications of a seeding effect occurred as can be seen in the diagrams below from Rangno and Hobbs (1993).  One can assume that Grant and Mielke were sincere in their belief that a large cloud seeding induced increase in snowfall was being produced at Climax when they chose their controls at the halfway point, but had they realized that it had ended after their choices, the story of Climax I would have turned out far differently.

should be compared, however, to the original analyses by Grant et al.(1969) and Mielke et al.(1970, 1971)which indicated greater than 100% increase in precipitation on seeded days in the high 500 mb temperature category for Climax I and 24% for Climax II. Subsequently, Mielke (1995) explained a number of the criticisms made by Rangno and Hobbs regarding the statistical design of the experiments, including revealing that CSU personnel, and not independent NOAA ones,  as had been claimed on several occasions, were responsible for the errors in the precipitation and upper- level data that created a false replication of Climax I, in particular the randomization procedures, the quality and selection of target and control data, and the use of 500 mb temperature as a partitioning criteria. It is clear that the design, implementation, and analysis of this experiment was a learning process not only for meteorologists but statisticians as well.

PS to the reader: It was not a learning process for the CSU experimenters as claimed above.

Professor Grant was informed in my presence by three different people (I was not one of them) on three occasions in the early 1970s while I was the Assistant Project forecaster for the CRBPP that the stratifications by 500 mb temperatures by he and his group did NOT index cloud top ones as he was claiming.   These refutations of his claims were based on the statements of the prior Park Range Project contractor in Rhea et al. (1969),  and on the rawinsonde data from the on-going Colorado River Basin Pilot Project (e.g., Rangno 1972, Elliott et al. 1976).  500 mb and cloud top temperatures are, in general, poorly correlated.

So, Grant stopped claiming they were strongly related after he received this information in the early 1970s and learned from it?

 No.

 Grant continued to claim (as in Grant and Elliott 1974, Grant and Cotton 1979, Grant 1986) that the 500 mb temperature was representative of cloud top temperature (see Table 8 in Grant and Elliott 1974).   Strangely believe it, Mielke et al. with Grant as a co-author (1981) again stratified results of seeding in Climax I and II by 500 mb temperatures which Mielke himself knew had no physical meaning re cloud tops or cloud microstructure!

Moreover, the CSU experimenters repeatedly and falsely claimed that a graduate student, Furman (1967), had established a relationship between 500 mb and cloud top temperatures (e.g., as in Grant and Elliott 1974). Furman (1967) says nothing about such a relationship in his master’s thesis that consisted of but three days of vertically pointed 3-cm wavelength radar at Climax (Hobbs and Rangno 1979).  Another CSU graduate student, Hjermstad (1970), to refer to Furman’s study as, “scant” in coverage.  

To the outside community, the experimenters were presenting quite a different picture of what Furman had done.  What do we make of this?

For a naive, idealistic newbie into the weather modification/cloud seeding scene like me in the early 1970s in Durango, CO, this was amazing and troubling stuff to experience! CP07 (CSU folk) try to minimize what happened, I think,  by claiming it was a “learning process” when what actually happened was so counter to what we think of as “science”; i. e., that scientists change their minds when new facts come in that contradict their hypotheses.

The results of the many reanalyses of the Climax I and II experiments have clearly “watered down” the overall magnitude of the possible increases in precipitation in wintertime orographic clouds. Furthermore, they have  revealed that many of the concepts that were the basis of the experiments are far too simplified compared to what we know today. Furthermore, many of thecloud systems seeded were not simple “blanket-type orographic clouds” but were part of major wintertime cyclonic storms that pass through the region.As such, there was a greater opportunity for ice multiplication processes and riming processes to be operative in those storms, making them less susceptible to cloud seeding.

The above is a good summary.

 Two other randomized orographic cloud seeding experiments, the Lake Almanor Experiment (Mooney and Lunn, 1969) and the Bridger Range Experiment (BRE) as reported by Super and Heimbach (1983) and Super (1986) suggested positive results. However,these particular experiments used high-elevation silver iodide generators, which increases the chance that the silver iodide plumes get into the supercooled clouds.  Moreover, both experiments provided physical measurements that support the statistical results (Super, 1974; Super and Heimbach, 1983, 1988). Using trace chemistry analysis of snowfall for the Lake Almanor project, Warburton et al.(1995a) found particularly good agreement with earlier statistical suggestions of seeding-induced snowfall enhancement with cold westerly flow. They concluded that failure to produce positive statistical results with southerly flow cases was likely related to seeding mis-targeting of the seeded material.

The reader should be aware that the results of the second randomized Lake Almanor experiment were not fully reported. The effect of seeding in the so-called “cold westerly” cases where a large seeding effect was suggested in the first Lake Almanor experiment, was omitted in the analyses of the second experiment (Bartlett et al. 1975).

Omittted results are always a sign of concern as happened in the Israeli II experiment.  Also of concern, no one has reanalyzed the first Lake Almanor experiment with its overly large percentage increases in snow, also of “concern.”  They don’t seem realistic to me, an expert in ersatz seeding reports and in cloud microstructure.  Someone gimmee that list of random decisions for Lake Amanor I and I’ll check it out!

These two randomized experiments strongly suggest that higher-elevation seeding in mountainous terrain can produce meaningful seasonal snowfall increase.

Independent scrutiny is needed for both of those experiments to strengthen this conclusion.

We noted above, that the strongest evidence of significant precipitation increases by static seeding of cumulus clouds came appeared to come from the Israeli I and II experiments…until Gabriel and Rosenfeld (1990) reported the full results of Israel II.  

Rosenfeld and Farbstein(1992) suggested that the differences in seeding effects between the north and south target areas during Israeli II that were reported by Gabriel and Rosenfeld (1990) is was the result of the incursion of desert dust into the cloud systems. They argue that the desert dust contains more active natural ice nuclei and that they can also serve as coalescence embryos enhancing collision and coalescence among droplets. Together, the dust can make the clouds more efficient rain-producers and less amenable to cloud seeding.

Note:  This “divergent effects” hypothesis began to gain early traction in the scientific community (e.g., J. Simpson, 1989).

Even these experiments have come under attack by Rangno and Hobbs doubted the Rosenfeld and Farbstein (1992) claims, and he launched a reanalysis of both Israeli experiments in 1992 that was published in 1995 (Rangno and Hobbs). That publication drew numerous critical comments from seeding partisans in 1997   From their reanalysis of both the Israeli I and II experiments, they Rangno and Hobbs argued demonstrated that the appearance of seeding-caused increases in rainfall in the Israeli I experiment was due to “lucky draws” or a Type I statistical error as had first  been “red flagged” in Wurtele (1971) for Israeli I due to the highest statistical significance on seeded days in that experiment having been located in a Buffer Zone that was meant to be unseeded between the two targets.  That it was largely unseeded was stated by the Israeli I chief meteorologist in Wurtele’s paper, Mr. Karl Rosner.  Wurtele’s paper should have been cited in CP95 and CP07.

Gabriel and Rosenfeld (1990) and  Furthermore, they Rangno and Hobbs argued showed that during Israeli II, naturally heavy rainfall fell over a wide region that included both targets on north target seeded days, with Rangno and Hobbs expanding the analysis of Gabriel and Rosenfeld (1990) to  include Lebanon and Jordan.  The widespread heavier rainfall on north target seeded days gave the appearance that seeding caused increases in rainfall over the north target area, but since the seeded days in the north were the control days for the south target  and more ordinary storms happened in the south target on its seeded days, created the impression that seeding had decreased rainfall there.   Namely, the presence of “dust/haze” as claimed by Rosenfeld and Farbstein (1992) had nothing to do with the outcome of the Israeli II experiment as evaluated by Rangno and Hobbs (1995).  The lower natural rainfall in the region  encompassing the south target area gave the appearance that seeding decreased rainfall over that target area:  

Not cited by CP07 in this segment is Silverman (2001) in his major review of numerous static glaciogenic seeding experiments, that included the Israeli experiments.  He concluded, as did Rangno and Hobbs (1995), that the two Israeli experiments no longer were credible in proving that rain had been increased by cloud seeding.

We argued above that the “apparent” success of the Israeli seeding experiments was due to the fact that they are more susceptible to precipitation enhancementby cloud seeding. This is because numerous studies (Gagin, 1971, 1975, 1986; Gagin and Neumann, 1974) have had shown that the clouds over Israel are continental having cloud droplet concentrations of about 1,000 cm-3 and that ice particle concentrations are generally small until cloud top temperatures are colder· than-14°C. Furthermore, there is was little evidence found in those early studies for ice particle multiplication processes operating in those clouds.

See Rangno and Hobbs (1988) for a critique of those early studies by Professor Gagin listed above and why they were unrepresentative of most Israeli clouds.  Also see Rangno (1988) for evidence that those early studies were, indeed, highly erroneous as was verified on numerous occasions in later Israeli cloud studies using aircraft (e.g., Levin et al. 1996) and satellite data.  

Rangno (1988) and Rangno and Hobbs (1995) also reported on observations of clouds over Israel that strongly suggested containing they contain large supercooled droplets and quite high ice crystal concentrations at relatively warm temperatures. In addition, Levin et al.(1996) corroborated the Rangno (1988) and Rangno and Hobbs (1988, 1995) inferences when they found high ice particle concentrations, 10s to hundreds per liter, in convective clouds with tops no colder than -13°C.  presented evidence of active ice multiplication processes in Israeliclouds. This further erodes the perception that the clouds over Israel were as susceptible to seeding as originally thought.

Naturally, the Rangno and Hobbs (1995) paper generated quite a large reaction in the weather modification community. The March issue of the Journal of Applied Meteorology contained a series of comments and replies related to their paper (Ben- Zvi, 1997; Dennis and Orville, 1997; Rangno and Hobbs, 1997a,b,c,d, e, the most important of those “Replies”; Rosenfeld, 1997; Woodley, 1997). These comments and responses clarify many of the issues raised by Rangno and Hobbs (1995). Nonetheless, the image of, what was originally thought of as the best example of the potential for precipitation enhancement of cumulus clouds by static seeding has become considerably tarnished.

What have we learned from this chapter?  Caveat emptor concerning reports by those who conducted a “successful” cloud seeding experiments later telling us how ripe with seeding potential those clouds were.

Amen.  Thanks, guys, for this concluding remark largely due to the present writer’s work and skepticism.  This conclusion should have been placed earlier so the reader is not getting two versions of the of the Israeli experiments in having increased rain.

Chapter 3:  The fall of the funding science of weather modificationby cloud seeding

For nearly two decades vigorous research in weather modification was carried out in the United States and elsewhere. As shown in Fig. 3.1, federalfunding in the United States for weather modification research peaked in the middle 1970s at nearly $19 million per year. Even at its peak, funding for weather modification research was only 6% of the total federal spending in atmospheric research (Changnon and Lambright, 1987) and this amount includedconsiderable support for basic research on the physics of clouds and oftropical cyclones. Nonetheless, research funding in cloud physics, cloud dynamics, and mesoscale meteorology was largely justified based on its application to development of the technology of weather modification.Research on the basic microphysics of clouds particularly benefited fromthe political and social support for weather modification.   •

By 1980, the funding levels in weather modification research began to fall appreciably and by 1985 they had fallen to the level of $12 million. After 1985, funding in weather modification research became so small and fragmented that no federal agency kept track of it. Currently the Bureau of Reclamation has onlyabout

$0.25 million per year that can be identified as weather modification. They have operated a program in Thailand that was supported by the Agency for International Development. Basic research in the National Science Foundation that can be linked to weather modification is on the order of $1 million. Likewise, the Department of Commerce has no budgeted weather modification program but has supported a cooperative state/federal program at about the $3.5 million level. This on again- off again “pork barrel” program is supported by congressional write-insrather than a line item in the National Oceanic and Atmospheric Administration (NOAA) budget. In FY-2003, the Bureau of Reclamation administered this program,but no such funds were earmarked for either the Bureau of Reclamation or NOAA inFY-2004 or FY-2005. In this program, states having strong political lobbying support for weather modification are earmarked for support in this program.Overall the total federal program for weather modification in the United Statesis on the order of 10% of its peak level in the middle 1970s. What caused this virtual crash in weather modification research?

Changnon and Lambright (1987) listed the following reasons for this reduction in funding:

  • poor experimental designs;

Changnon and Lambright, as did CP95 and CP07, did not discuss the Bureau of Reclamation’s Colorado River Basin Pilot Project, the nation’s largest, best-planned, and costliest ever randomized orographic cloud seeding experiment based on the work of CSU cloud seeders. The surviving author, Lambright, did not remember why in his reply to a recent email query by this writer.

  • widespread use of uncertain modification techniques;
  • inadequate management of projects;
  • unsubstantiated Faulty claims of success, published in the peer-reviewed literature, ones that should have been caught in the peer-review of manuscripts.  

The “fall” described by CP95 and again in CP07 didn’t have to happen because with solid reviews; there would have been no rise!  If you would like to read about how to stop faulty cloud seeding claims from appearing in the peer-reviewed literature, go here:

https://cloud-maven.com/cloud-seeding-and-the-journal-barriers-to-faulty-claims-closing-the-gaps/

  • inadequate project funding; and
  • wasteful expenditures

Changnon and Lambright concluded that the primary cause of the rapid decline in weather modification funding was the lack of a coordinated federal research program in weather modification. However, there are other factors that also must

  • weather modification was oversold to the scientific community, public and legislatures due to peer-reviewed literature that appeared to show that cloud seeding had worked;
  • demands for water resource enhancement declined due to an abnormal wet period;


Clearly there is a great need to establish a more credible, stably funded scientific program in weather modification research, one that emphasizes the need to establish the physical basis of cloud seeding rather than just a”black box” assessment of whether or not seeding increased precipitation. We need to establish the complete hypothesized physical chain of responses to seeding by observational experiments and numerical simulations. We also needto assess the total physical, biological, and social impacts of cloud seeding, or what we call taking a holistic approach to examining the impacts of cloud seeding similar to those conducted during the latter stages of the Colorado River Basin Pilot Project (e.g., Marwitz et al. 1976).  E.K. Bigg, for example (Bigg, 1988, 1990b; Bigg and Turton,1988) suggested that silver iodide seeding can trigger biogenic production ofsecondary ice nuclei. His research suggests that fields sprayed with silveriodide release secondary ice nuclei particles at 10-day intervals and thatsuch releases could account for inferred increases in precipitation 1-3 weeksfollowing seeding in several seeding projects( e.g., Bigg and Turton, 1988).If Bigg’s hypothesis is verified, an implication of biogenic production ofsecondary ice nuclei is that many seeding experiments have thus been contaminated such that the statistical results of seeding are degraded. This effect would be worst in randomized cross-over designs and in experiments inwhich one target area is used and seed days and non-seed days are selectedover the same area on a randomized basis. Thus, not only is the weathermodification community faced with very difficult physical problems and largenatural variability of the meteorology, but they also are faced with thepossibility of responses to seeding through biological processes. (Bigg’s work is not credible to this reviewer.)

We shall see later that scientists dealing with human impacts on global change are also faced with very difficult physical problems, large natural variability of climate, and the possibility of complicated feedbacks through the biosphere. There is also a great deal of overselling of what models candeliver in terms of “prediction” of human impacts over timescales of decades or centuries.

End of “review and enhancement” of CP07’s weather modification chapters.

———–We interrupt this review for a brief personal presentation———

My self-funded trip to Israel (Rangno 1988) was to expose what I thought were faulty, ripe for cloud seeding cloud reports that were the foundation for the belief that seeding had increased rain.   My findings were first confirmed by Levin (1992), reported again in the journals by Levin et al. (1996) and verified in ensuing years several times in satellite imagery and in other airborne measurements.  Spiking fubball here, of course.  How often do researchers go to another’s lab on their own expense and tell him, “I don’t believe your results? Show them to me.”  Cost me a lot of money, but it was worth it.  At the time I went, the Israeli cloud reports had gone unquestioned (e.g., Silverman 1986).

Just before I hopped on a plane to Israel, my lab chief, Professor Peter V. Hobbs described me as “arrogant” for thinking I knew “more about the clouds of Israel than those who studied them in their backyard.”  But when he submitted my paper to the Quart. J. Roy. Meteor. Soc., 12 January 1987, with a copy to Professor A. Gagin, Professor Hobbs wrote to  Gagin that what I was describing  in my paper was the same as he thought about the clouds of Israel (that they were not as Professor Gagin was describing them).  

Professor Hobbs was not being truthful.  I often wonder many times Professor Hobbs might have said that to others, that what I  was reporting was what he had thought all along, robbing me of my insight, my historical trip and year long effort all paid for from my savings.  When I confronted him about this, he sent me a memo that said not to expect a job in his group in the future.  

But, he did hire me back to the job I loved via the magic of reconciliation (mostly) over past wrongs!

———————– 

The references cited in this “Review and Enhancement” that do not appear in CP07:

Auer, A. H., D. L. Veal, and J. D. Marwitz, 1969: Observations of ice crystalsand ice nuclei observations in stable cap clouds. J. Atmos. Sci., 26, 1342-1343.

Bartlett, J. P., Mooney, M. L., and Scott, W. L., 1975:  Lake Almanor Cloud Seeding Program.  Special Regional Weather Modification Conference, San Francisco, CA, 106-111.

Coons, R. D., and R. Gunn, 1951:  Relation of artificial cloud-modification to the production of precipitation.  Compendium of Meteorology,  Amer. Meteor. Soc., Boston, MA. 235-241. 

Coons, R. D., E. L. Jones, and R. Gunn, 1949: Artificial production of precipitation. Third Partial Report: Orographic Stratiform Clouds–California, 1949. Fourth Partial Report: Cumuliform Clouds–Gulf States, 1949. U. S. Weather Bureau Res. Paper No. 33, Government Printing Office, Washington, 46 pp.

Gabriel, K. R., and D. Rosenfeld: The second Israeli rainfall stimulation experiment: analysis of rainfall on both target areas. J. Appl. Meteor., 29, 1055–1067, 1990.

Cooper, W. A., and J. D. Marwitz, 1980: Winter storms over the San Juan mountains. Part III. Seeding potential. J. Appl. Meteor., 19, 942-949.

Cooper, W. A., and G. Vali, 1981: The origin of ice in mountain cap clouds.J. Atmos. Sci., 38, 1244-1259.

Furman, R. W., 1967:  Radar characteristics of wintertime storms in the Colorado Rockies.  M. S. thesis, Colorado State University, 40pp

Grant, L. O., DeMott, P. J., and R. M. Rauber, 1982: An inventory of icecrystal concentrations in a series of stable orographic storms. Preprints, Conf. Cloud Phys., Chicago, Amer. Meteor. Soc. Boston, MA. 584- 587.

Grant, L. O., J. G. Medina, and P. W. Mielke, Jr.,  1983: Reply to Rhea 1983.   J. Appl. Meteor. and Climate, 22, 1482-1484.

Grant, L. O., Chappell, C. F., Crow, L. W., Mielke, P. W., Jr., Rasmussen, J. L., Shobe, W. E., Stockwell, H., and R. A. Wykstra, 1969:  An operational adaptation program of weather modification for the Colorado River basin.  Interim report to the Bureau of Reclamation, Department of Atmospheric Sciences, Colorado State University, Fort Collins, 98pp.

Hill, G. E., 1980: Reexamination of cloud-top temperatures used as criteria of cloud seeding effects in experiments on winter orographic clouds. J. Climate Appl. Meteor., 19, 1167-1175.

Hobbs, P. V., 1969: Ice multiplication in clouds. J. Atmos. Sci., 26, 315-318.

Hobbs, P. V., and Rangno, A. L., 1979: Comments on the Climax randomized cloud seeding experiments.  J. Appl. Meteor., 18, 1233-1237.

Hobbs, P. V., Lyons, J. H., Locatelli, J. D., Biswas, K. R., Radke, L. F., Weiss, R. W., Sr., and A. L. Rangno, 1981: Radar detection of cloud-seeding effects. Science, 213, 1250-1252.

Korolev, A. V., M. P. Bailey, J. Hallett, and G. A. Isaac, and, 2004:Laboratory and in situ observation of deposition growth of frozen drops. J. Appl. Meteor., 43, 612-622.

Kraus, E. B., and P. Squires, 1947: Experiments on the stimulation of clouds to produce rain. Nature, 159, 489-490.

Levin, Z., 1992: The role of large aerosols in the precipitation of the eastern Mediterranean. Paper presented at theWorkshop on Cloud Microphysics and Applications to Global Change, Toronto. (Available from Dept. Atmos. Sci., University of Tel Aviv). No doi available

Levin, Z., E. Ganor, and V. Gladstein, 1996: The effects of desert particles coated with sulfate on rain formation in the eastern Mediterranean.  J. Appl. Meteor., 35, 1511-1523.

Marwitz, J. D., Cooper, W. A., and C. P. R. Saunders, 1976: Structure and seedability of San Juan storms. Final Report to the Bureau of Reclamation,University of Wyoming, Laramie, WY, 324 pp.*

Rangno, A. L., 1972: Case study on some characteristics of the specially monitored storm episodes within the Colorado River Basin Pilot Project. Special Project Report to the Bureau of Reclamation, 105pp.

Rangno, A. L., 1988: Rain from clouds with tops warmer than -10 C in Israel. Quart J. Roy. Meteorol. Soc., 114, 495-513.

Rangno, A. L., and P. V. Hobbs, 1988: Criteria for the development of significant concentrations of ice particles in cumulus clouds. Atmos. Res., 22, 1-13.

Rangno, A. L., and P. V. Hobbs, 1997e: Comprehensive Reply to Rosenfeld, Cloud and Aerosol Research Group, Department of Atmospheric Sciences, University of Washington, 25pp .https://carg.atmos.washington.edu/sys/research/archive/1997_comments_seeding.pdf

Rangno, A. L., and P. V. Hobbs, 2005: Microstructures and precipitation development in cumulus and small cumulonimbus clouds over the warm pool of the tropical Pacific Ocean. Quart. J. Roy. Meteorol. Soc., 131, 639-673.

Rhea, J. O., 1983: “Comments on ‘A statistical reanalysis of the replicated Climax I and II wintertime orographic cloud seeding experiments. J. Climate Appl. Meteor., 22, 1475-1481.

Simpson, J., 1989:  Amer. Meteor. Soc. Banquet talk transcript on the occasion of her inauguration as president of that organization, October 4th.

Vardiman, L., 1978: The generation of secondary ice particles in cloudcrystal-crystal collisions. J.  Atmos. Sci., 35, 2168–2180.

Vardiman, L., and C. L. Hartzell, 1976: Investigation of precipitating ice crystals from natural and seeded winter orographic clouds. Final Report to the Bureau of Reclamation, Western Scientific Services, Inc., 129 pp.

Wurtele, Z. S., 1971: Analysis of the Israeli cloud seeding experiment by means of concomitant meteorological variables. J. Appl. Meteor., 10, 1185-1192.

Concluding remark:

The entire CP07 reference list, consisting of several hundred references, is  a great resource for research and demonstrated how knowledgable these two authors are.  However, the list above also indicates how difficult a review of a topic is when the amount of literature that appears in journals today can bury you with important citations being missed.