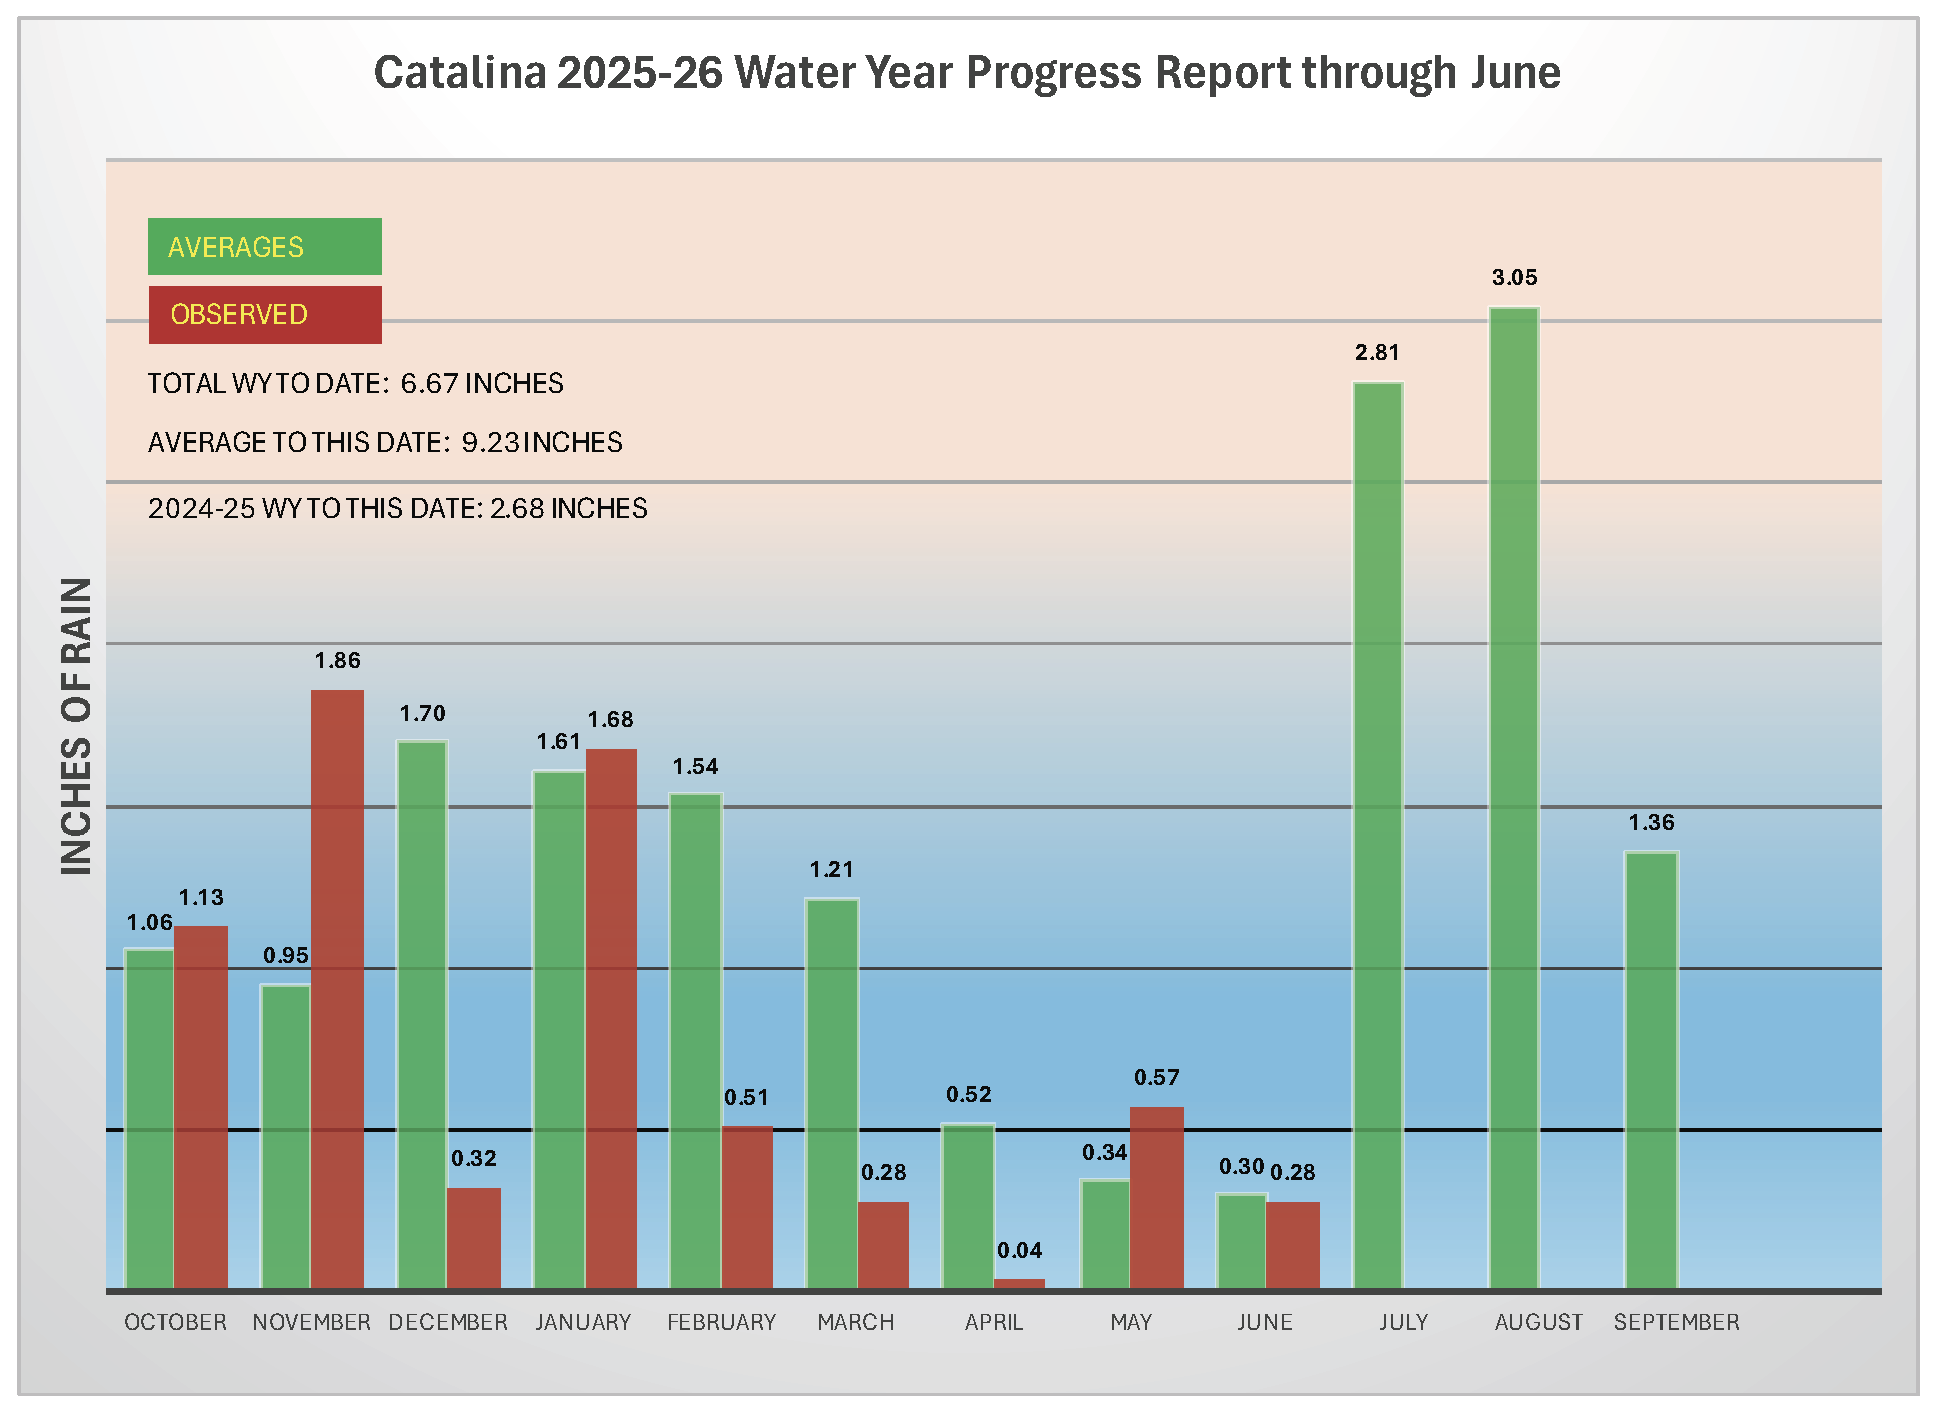
Not so great, but not as bad as some recent years, like the stupendously awful, 2024-25 water year. Check it out:
About real clouds, weather, cloud seeding and science autobio life stories by WMO consolation prize-winning meteorologist, Art Rangno
Not so great, but not as bad as some recent years, like the stupendously awful, 2024-25 water year. Check it out:
Way back in 1968 I did a paper that was required for my speech class. I did mine on the reporting on the riots at the Democratic Convention by as seen by three different news organizations; the Chicago Tribune, the New York Times, and the Los Angeles Free Press. My speech professor back in those days at San Jose State College, Dr. Phil Wander, thought it was good enough to be published. Well, now it has been. But the REAL reason I am putting it here on cloud-maven is because the online instructions for inserting this pdf into a Microsoft word docx do not work.; so frustrating!! But if it’s here at cloud-maven, I can insert a link into my MS Word. It’s part of an autobio: “All About ME! The Untold Story of Art Rangno and Why” as told by Art Rangno.
1969 COMPARATIVE NEWS PAPER ON THE 1968 DEMOCRATIC CONVENTION RIOTS
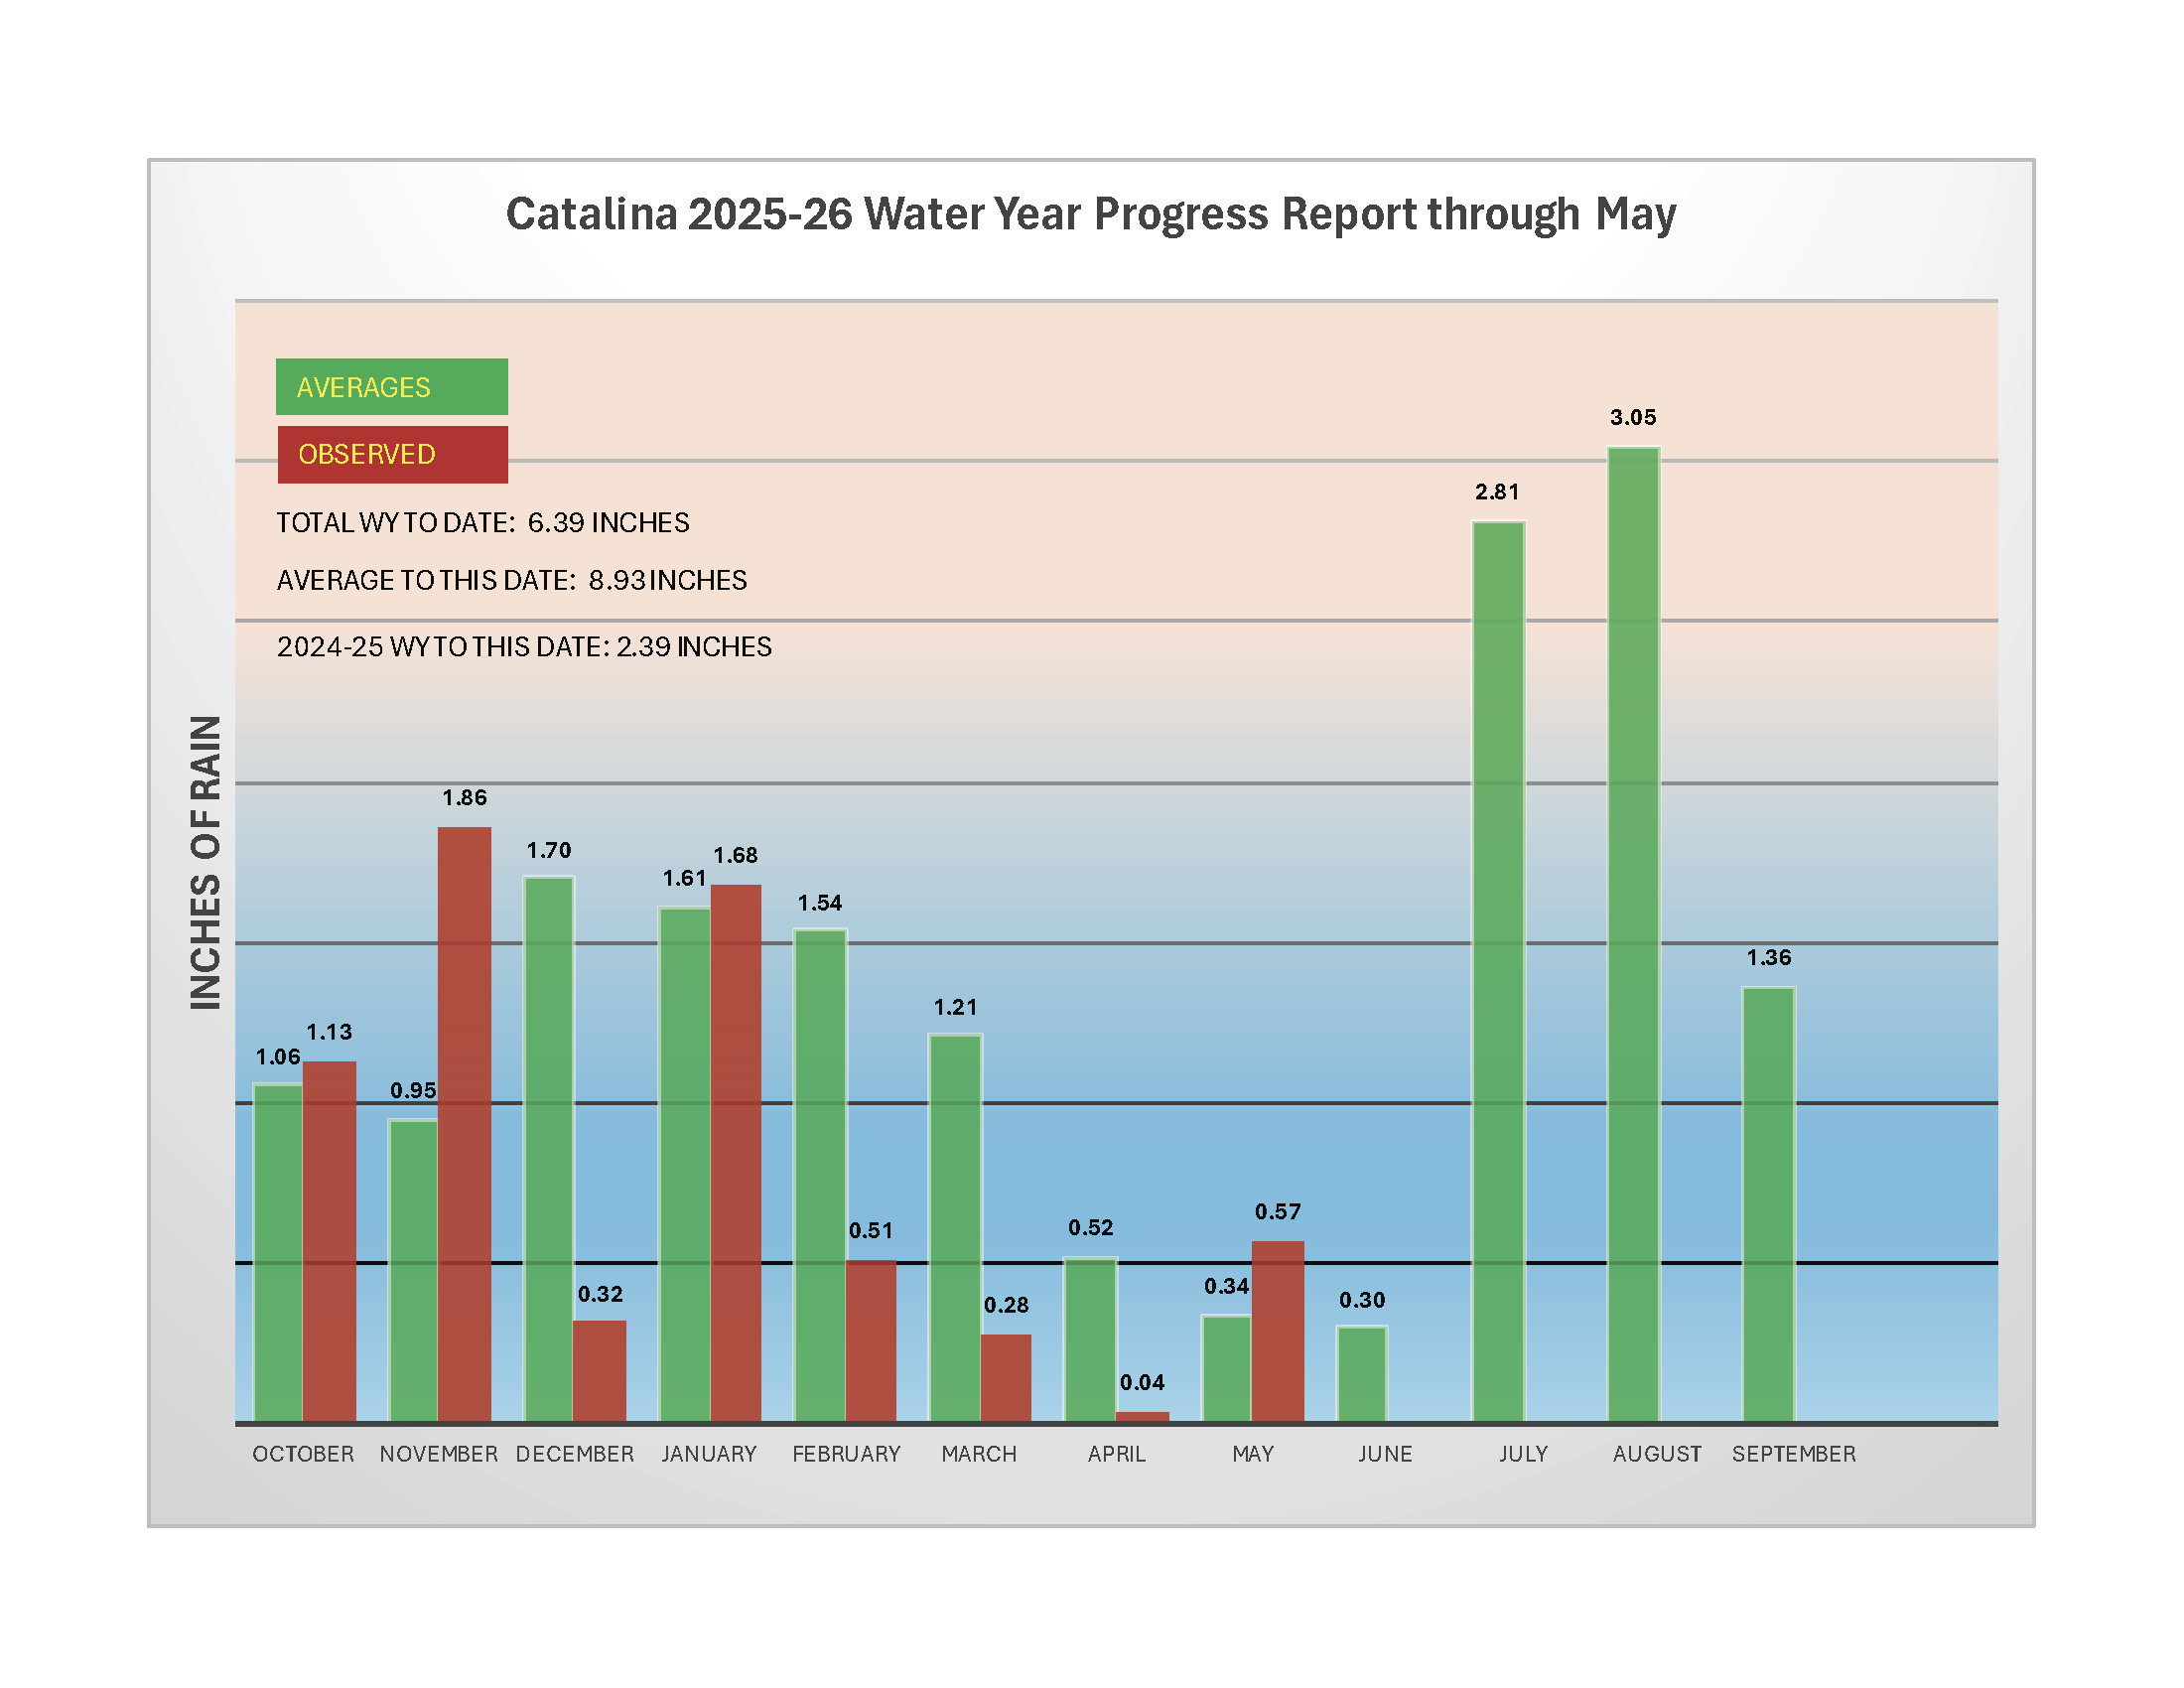
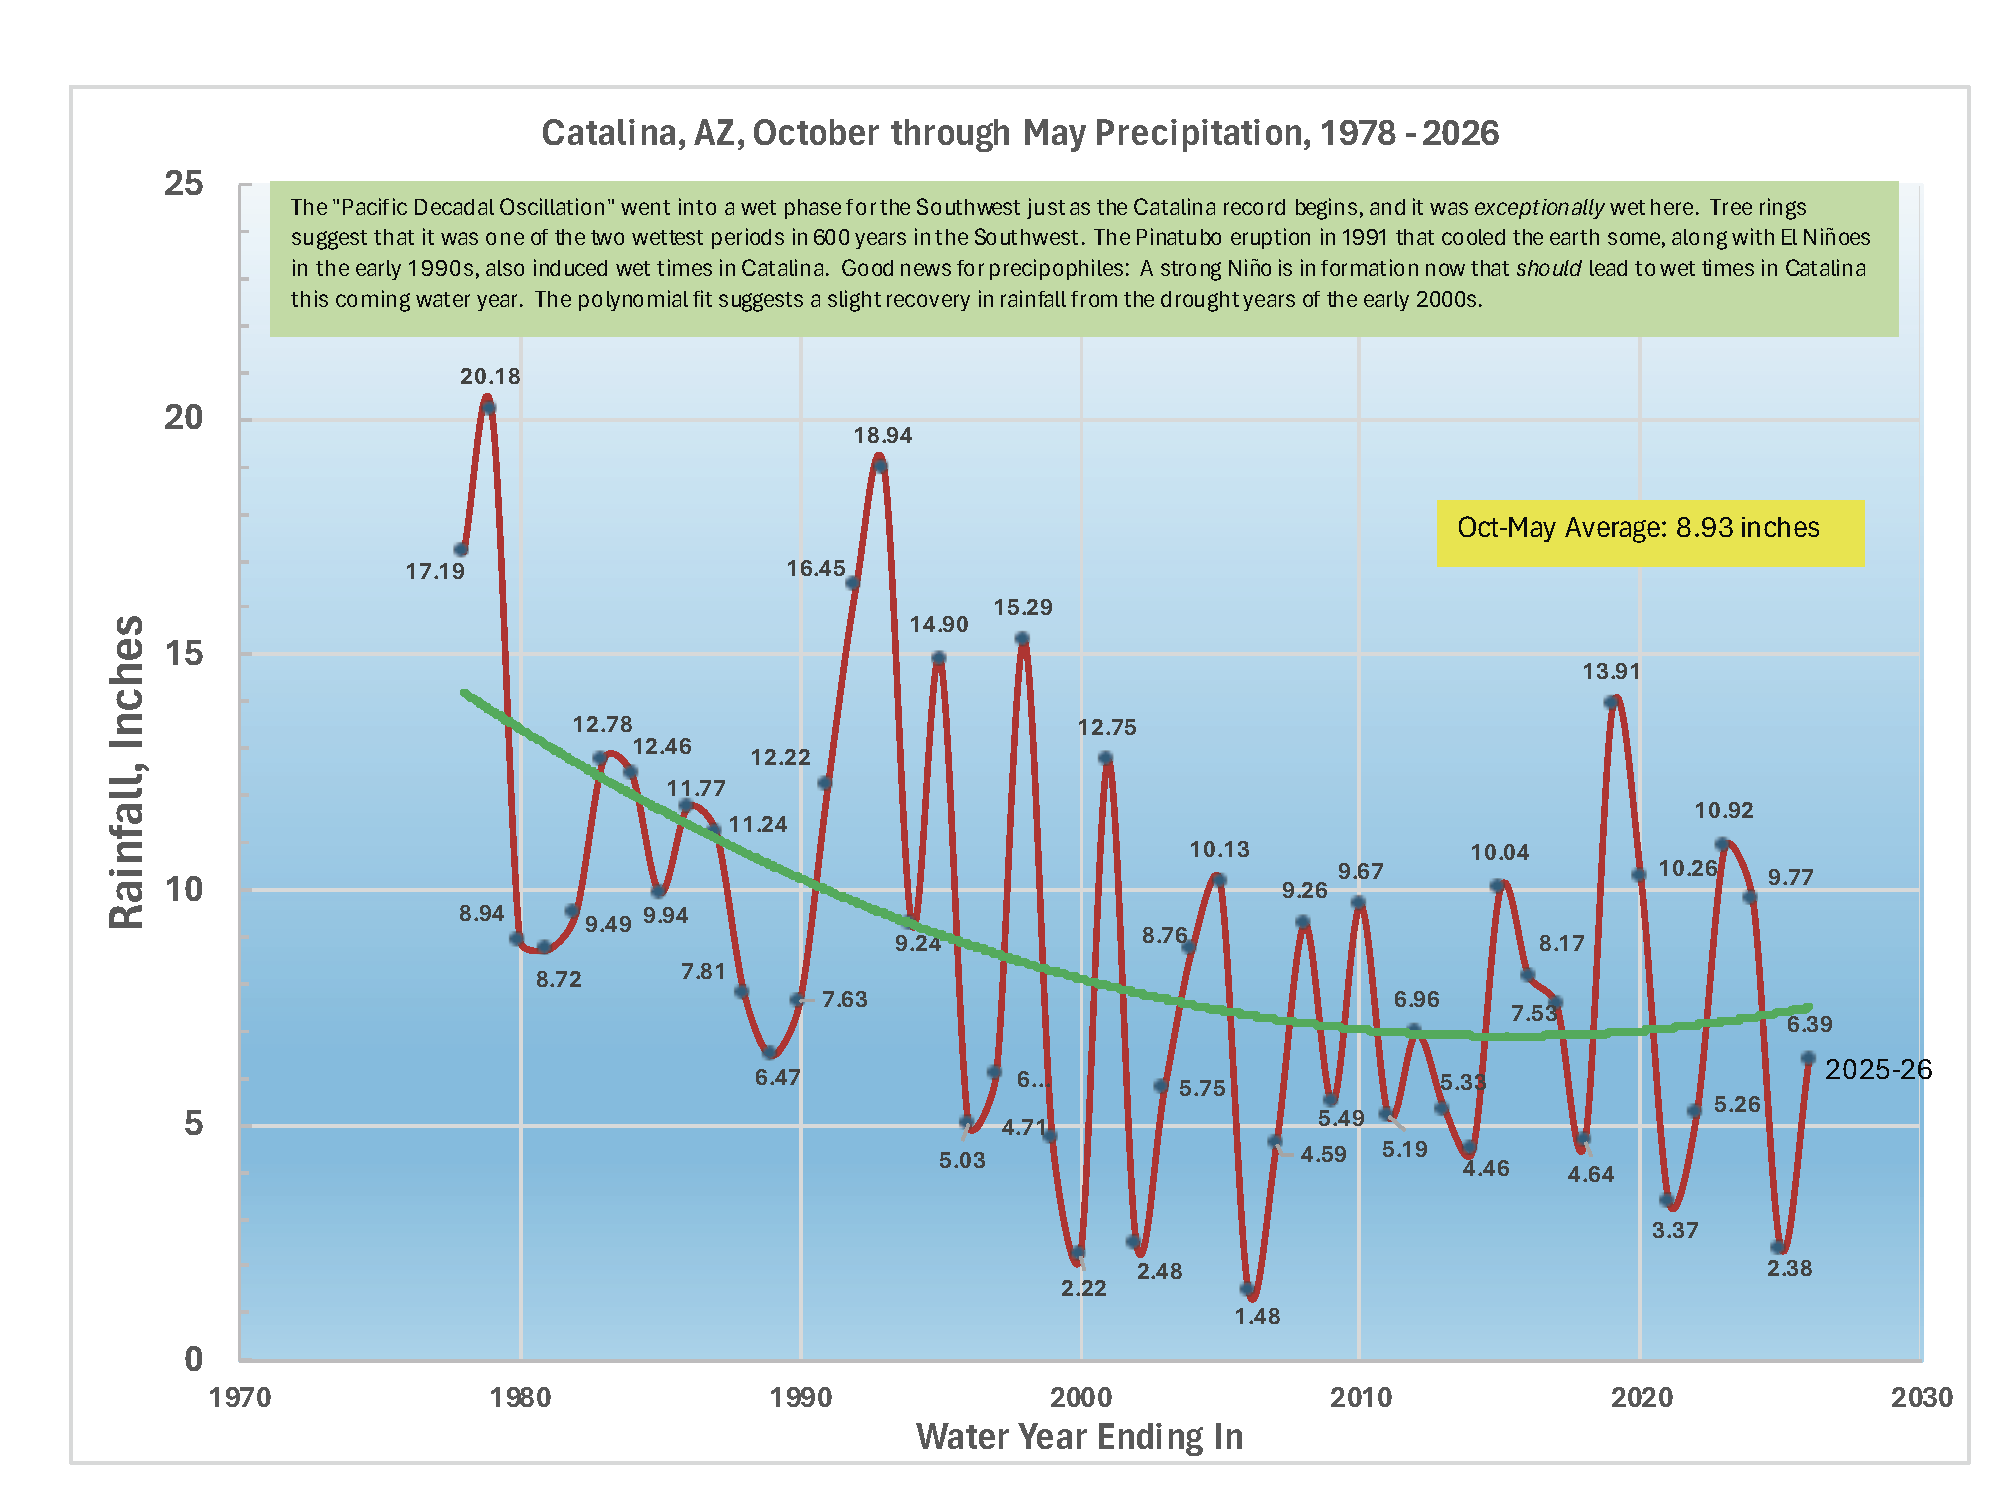
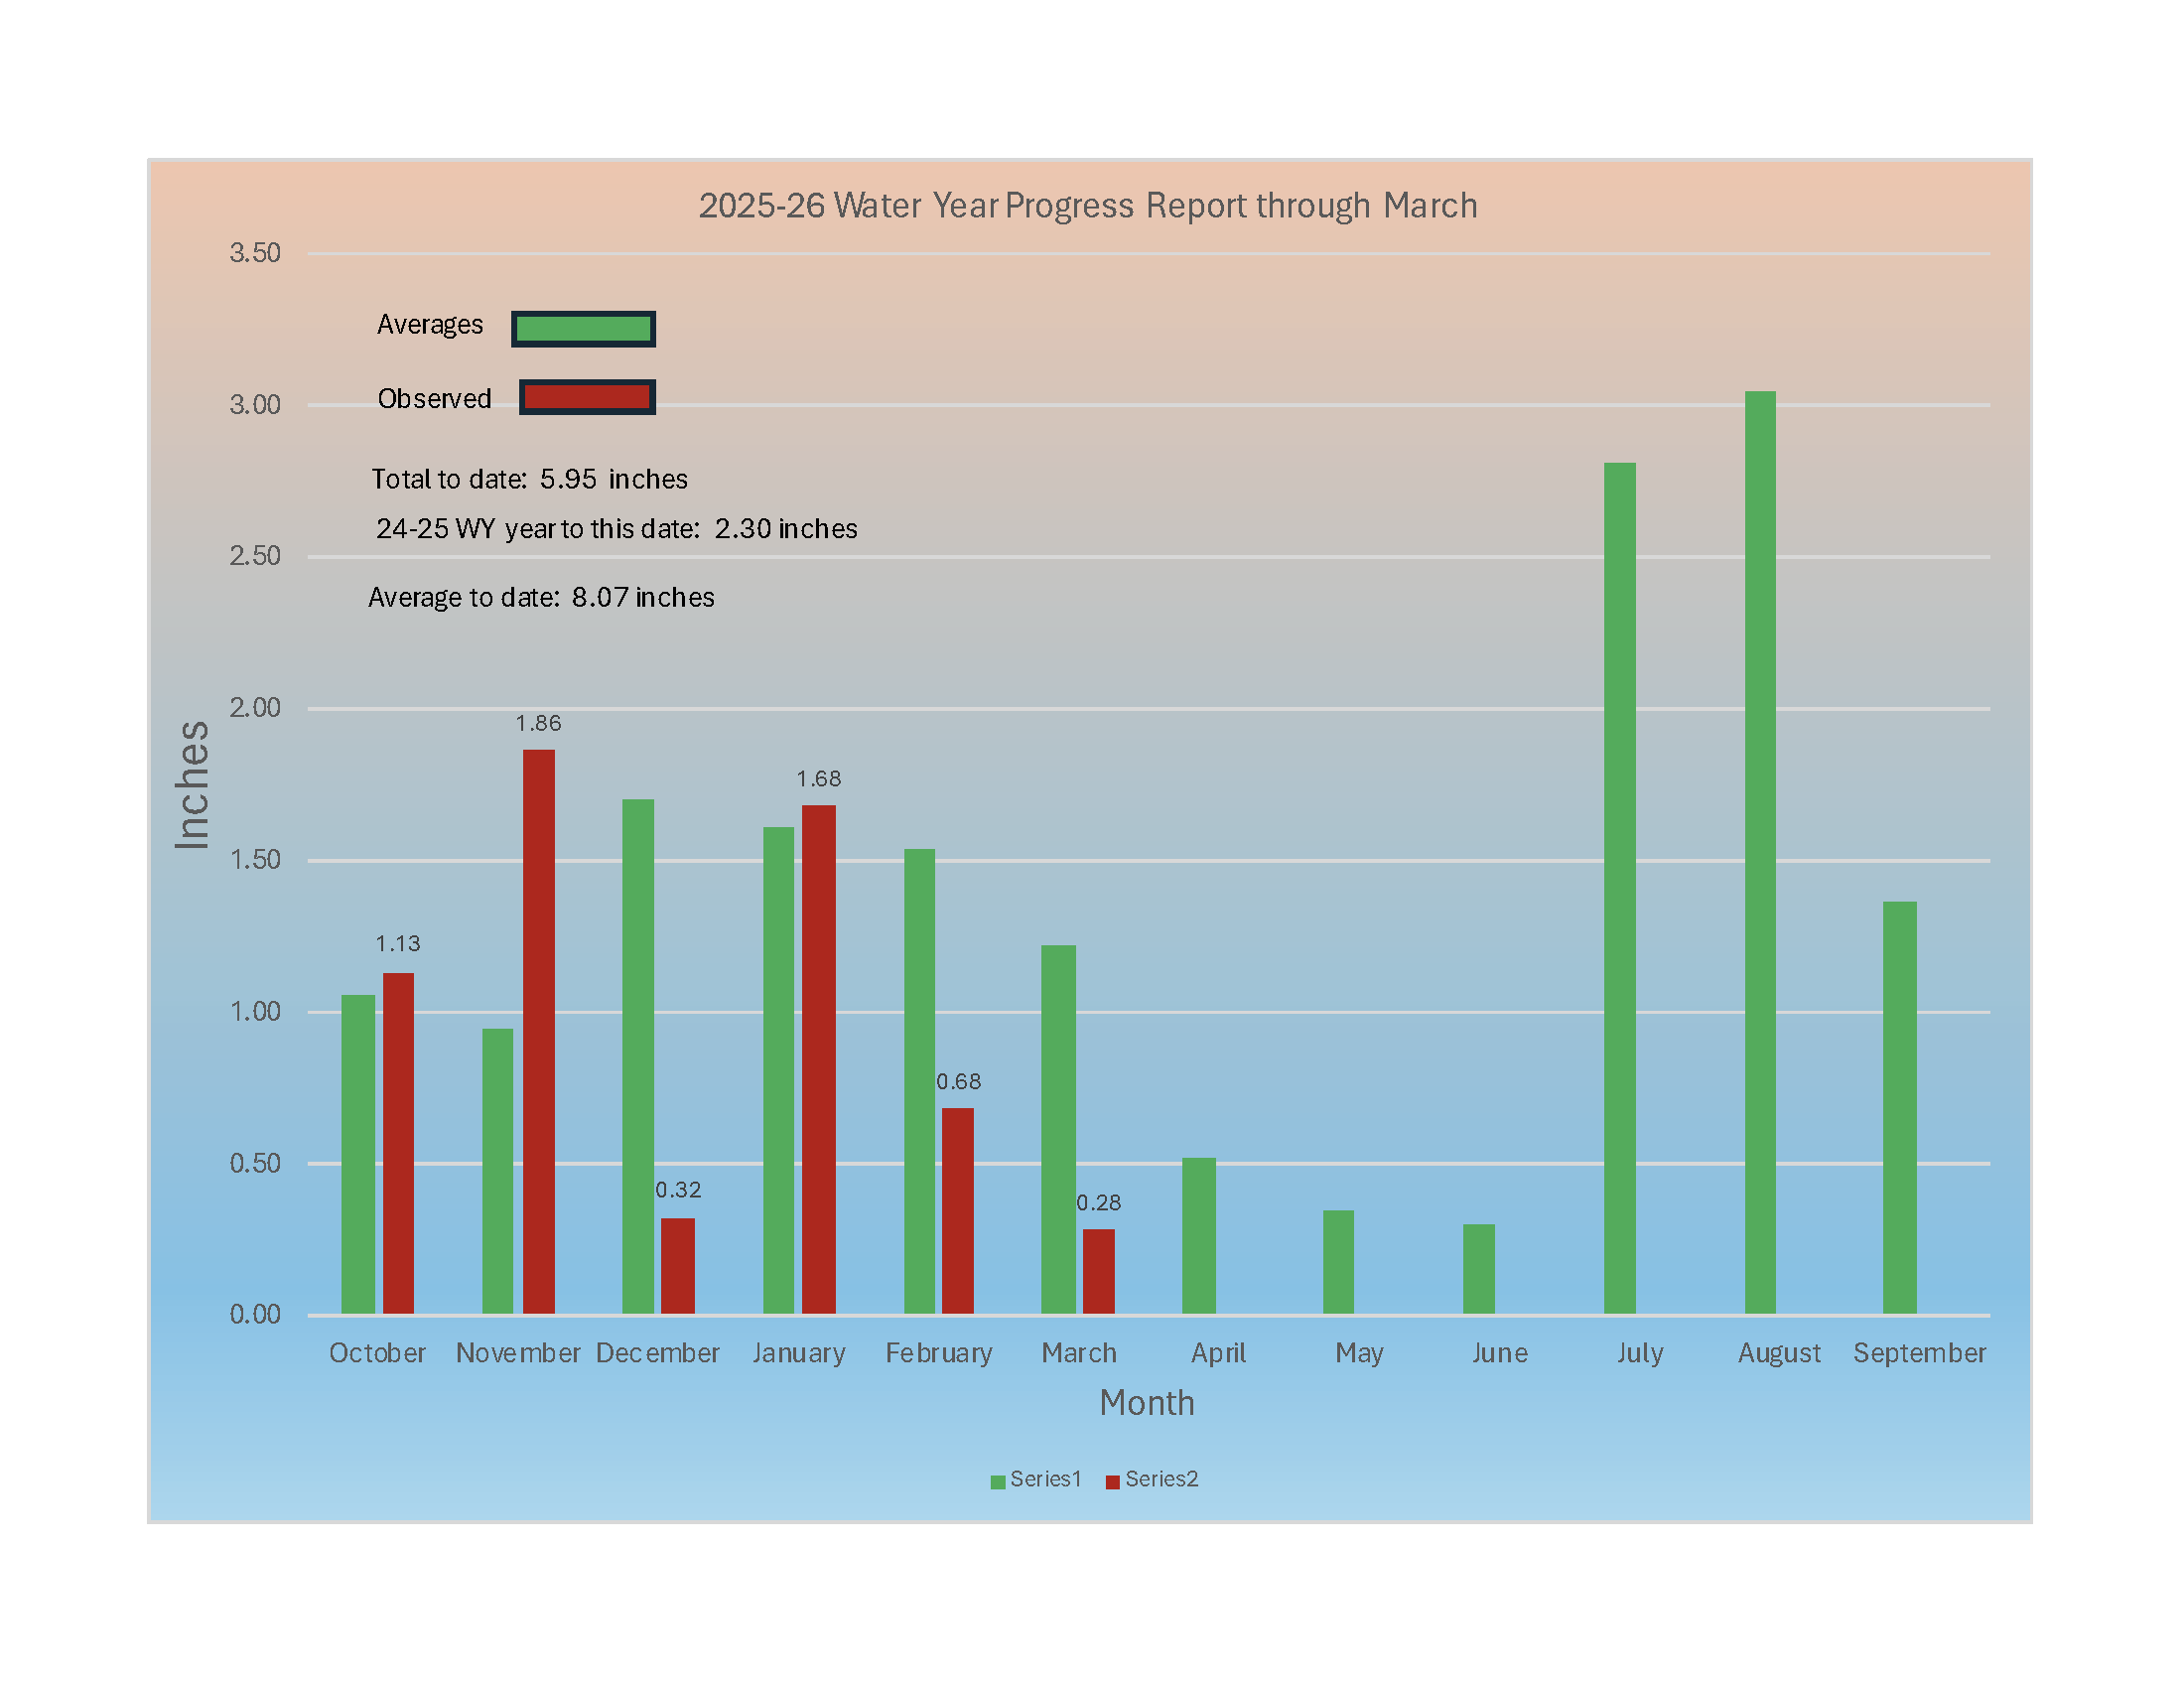
Precipitation rebounded this October through May period from the awful 2o24-25 October through May period but was still only 72% of normal with 6.39 inches. 8.93 inches is the normal value. May delivered the first above normal rainfall in several months with a generous half an inch rainfall early in the month.
Here’s the historical record for Catalina:
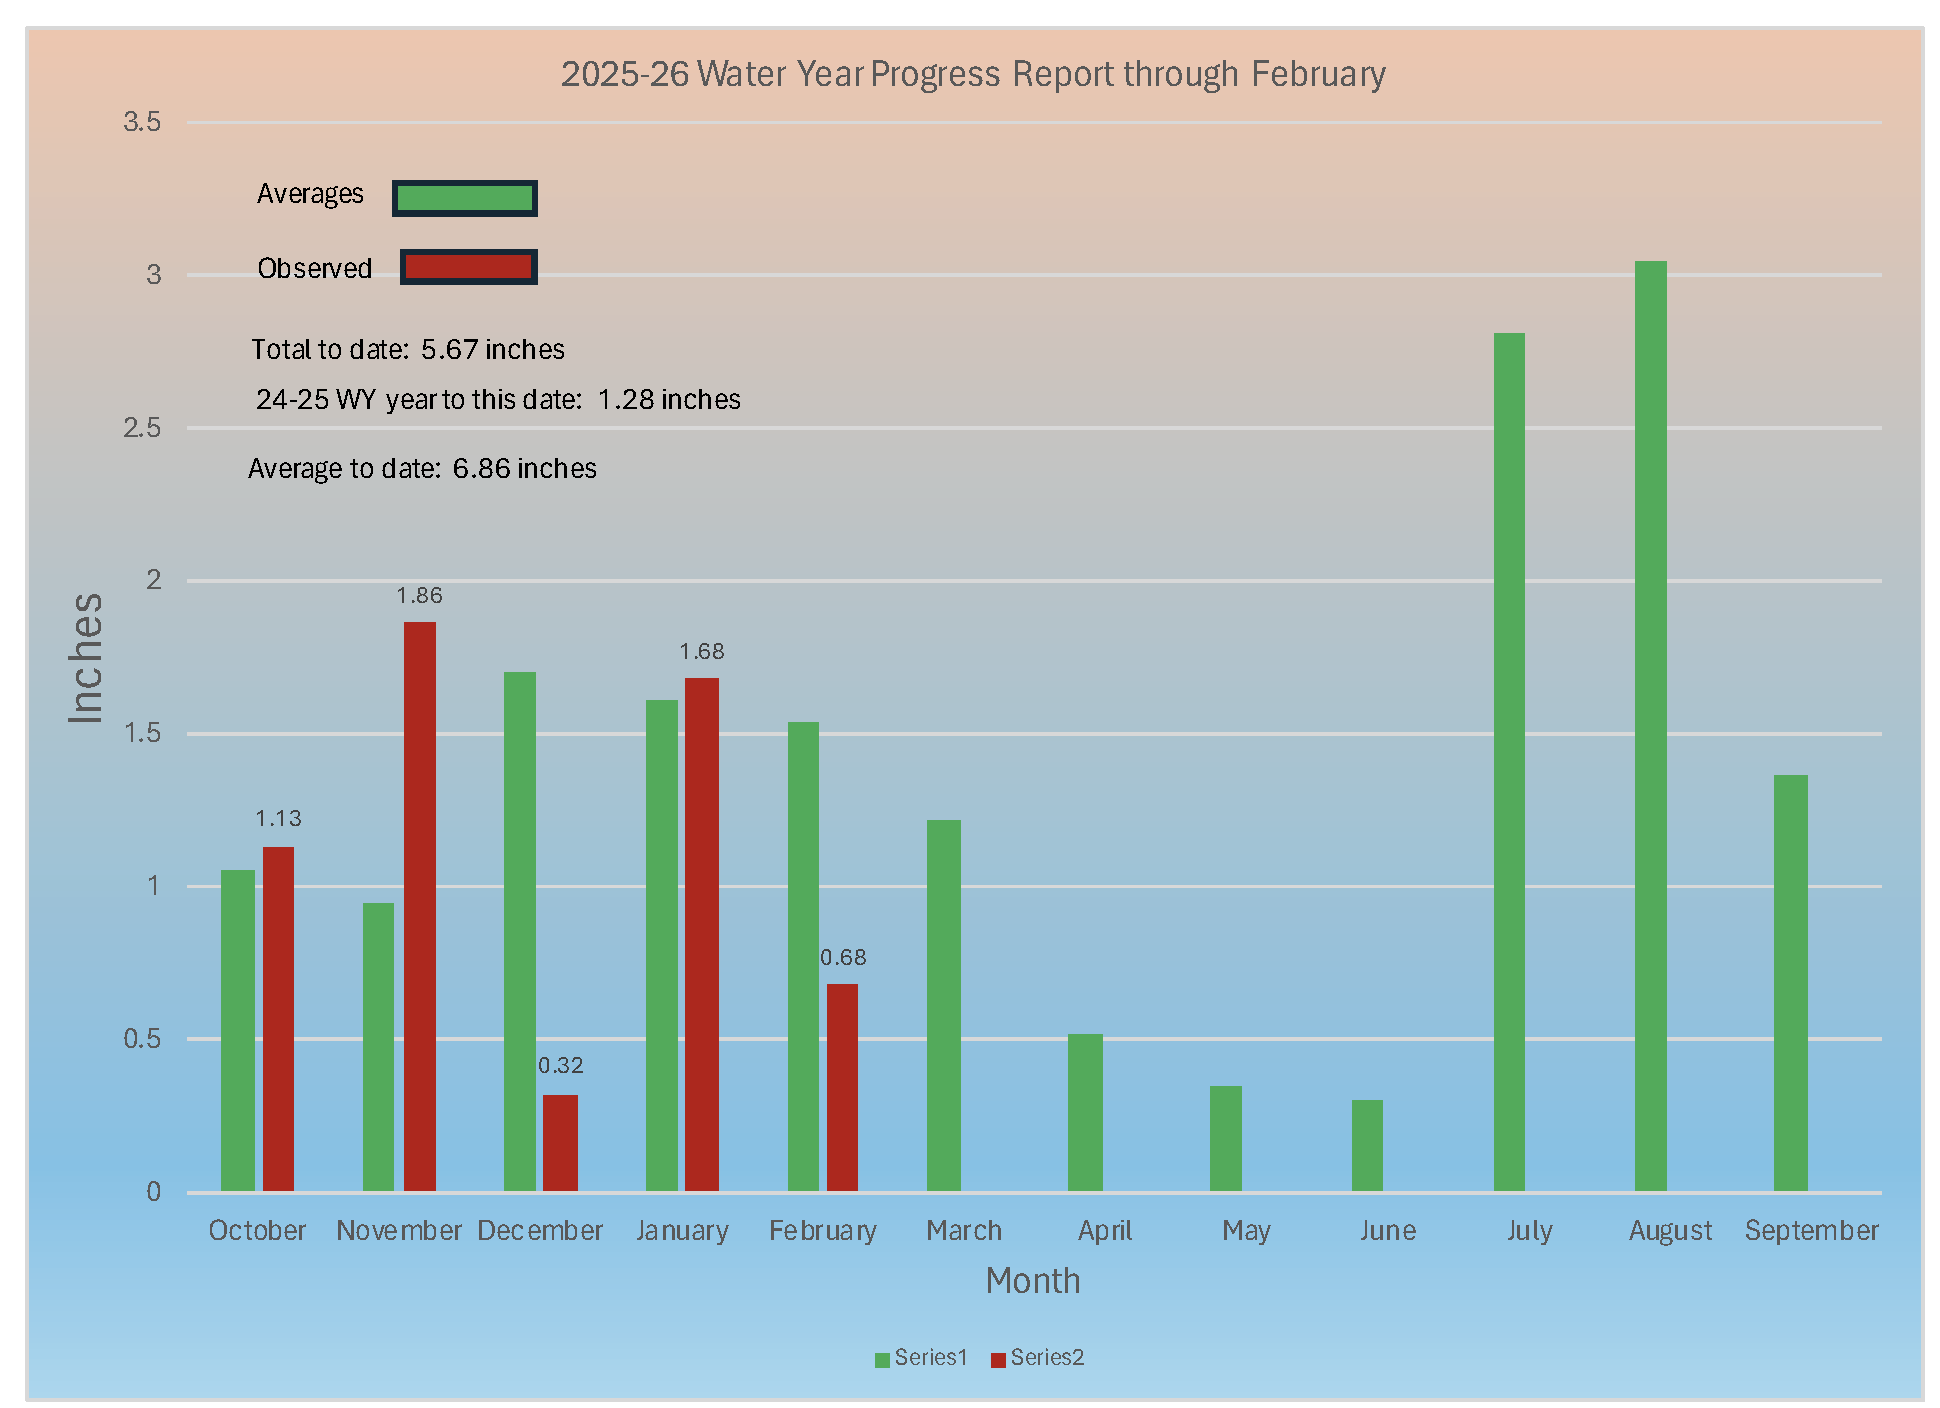
I’ve given up on the thought that any more measurable rain will occur in March. After last month’s summary of “Not That Bad,” this months is, “Getting Sad.” Our March rain total is going to be about 1 inch below normal at 0.28 inches.
Read it and weep;
in the inappropriate heat.
 Summary: Not that bad:
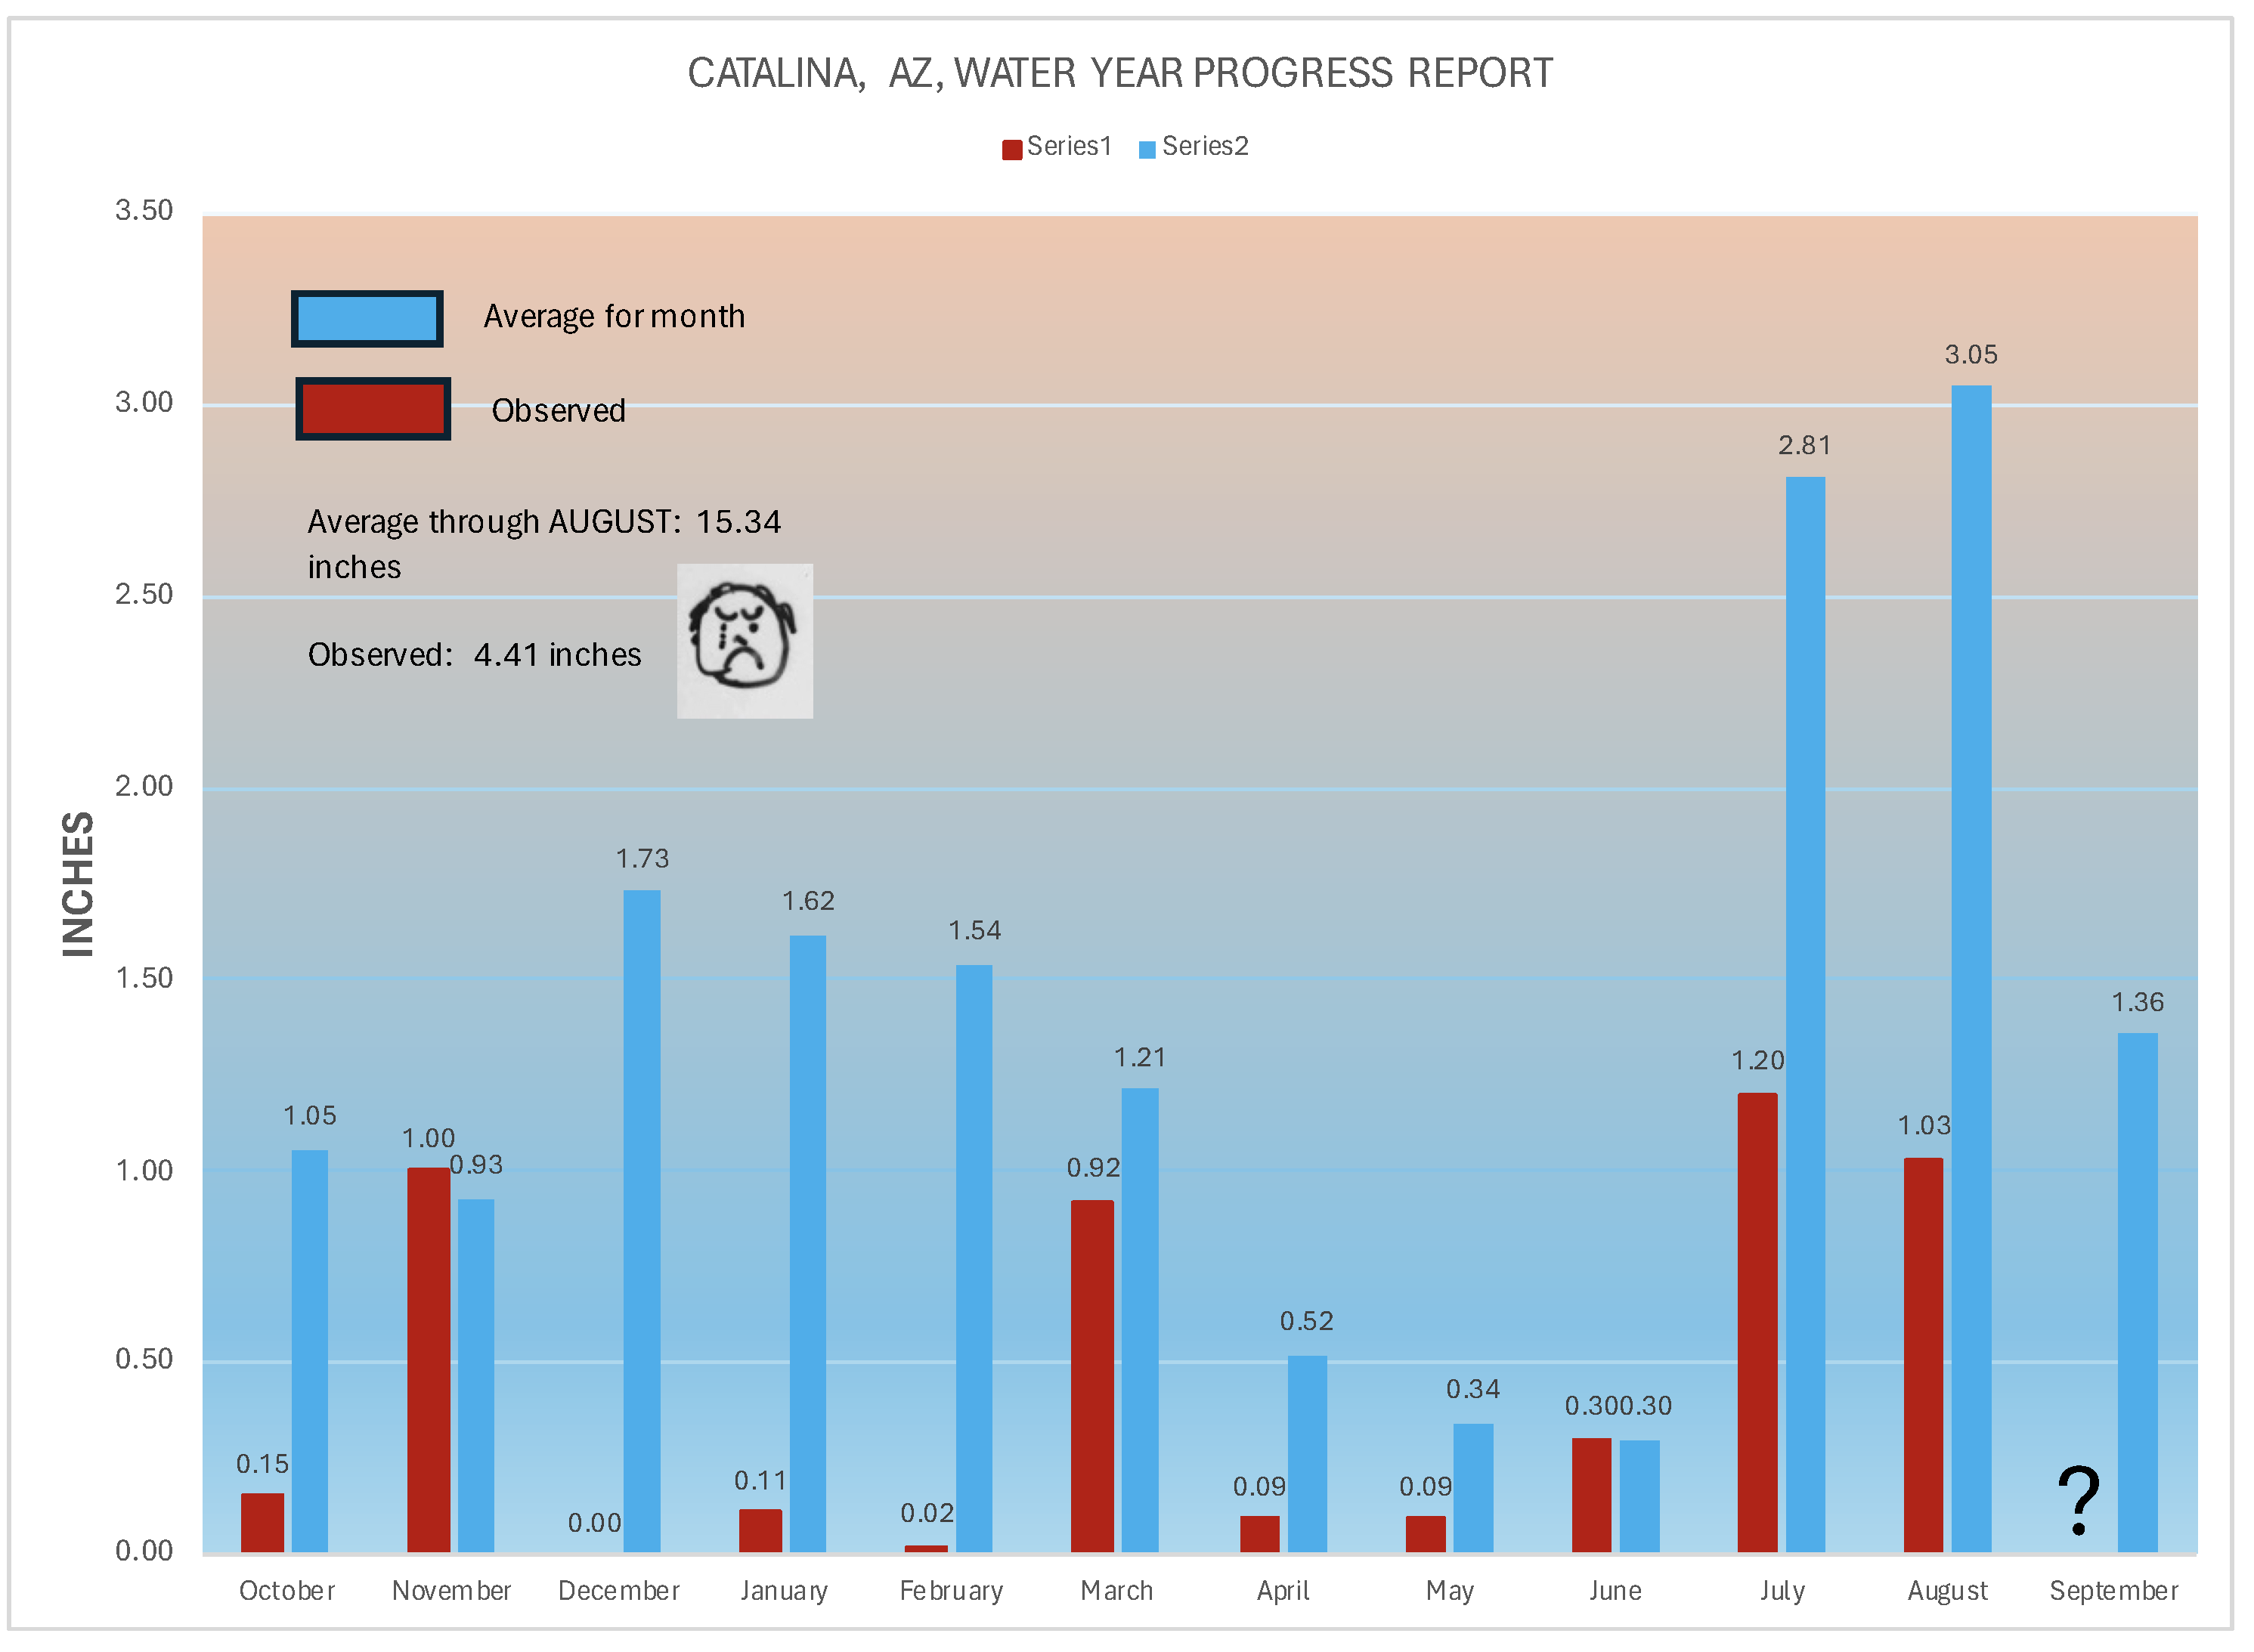
We experienced something “special” and horrible this past water year: It was TWO standard deviations below average! Calling climate change news conference now…
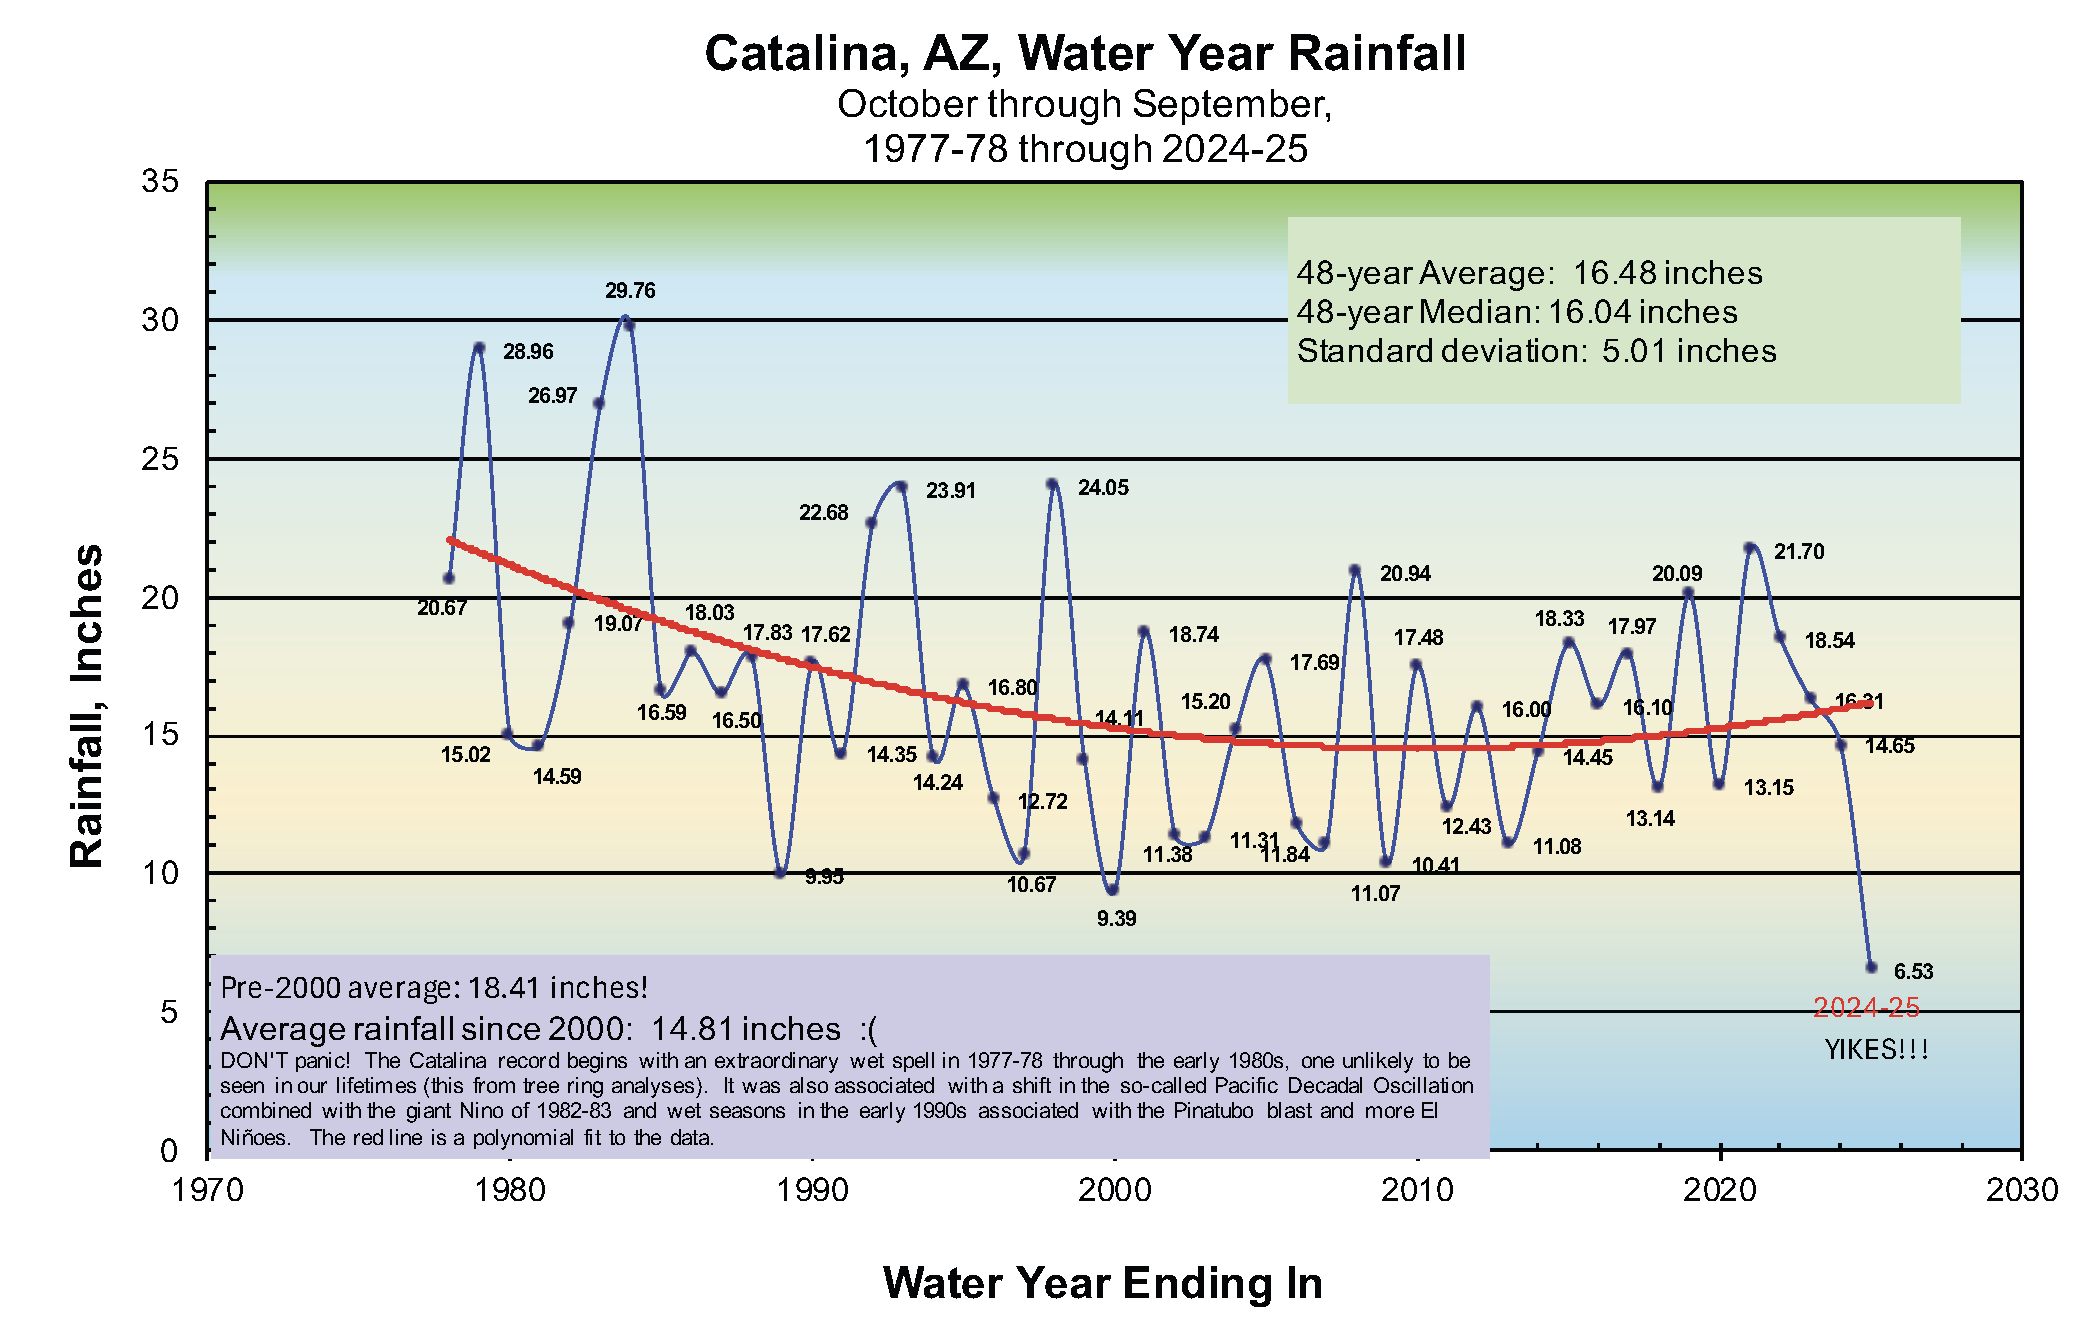
How’d we get here?
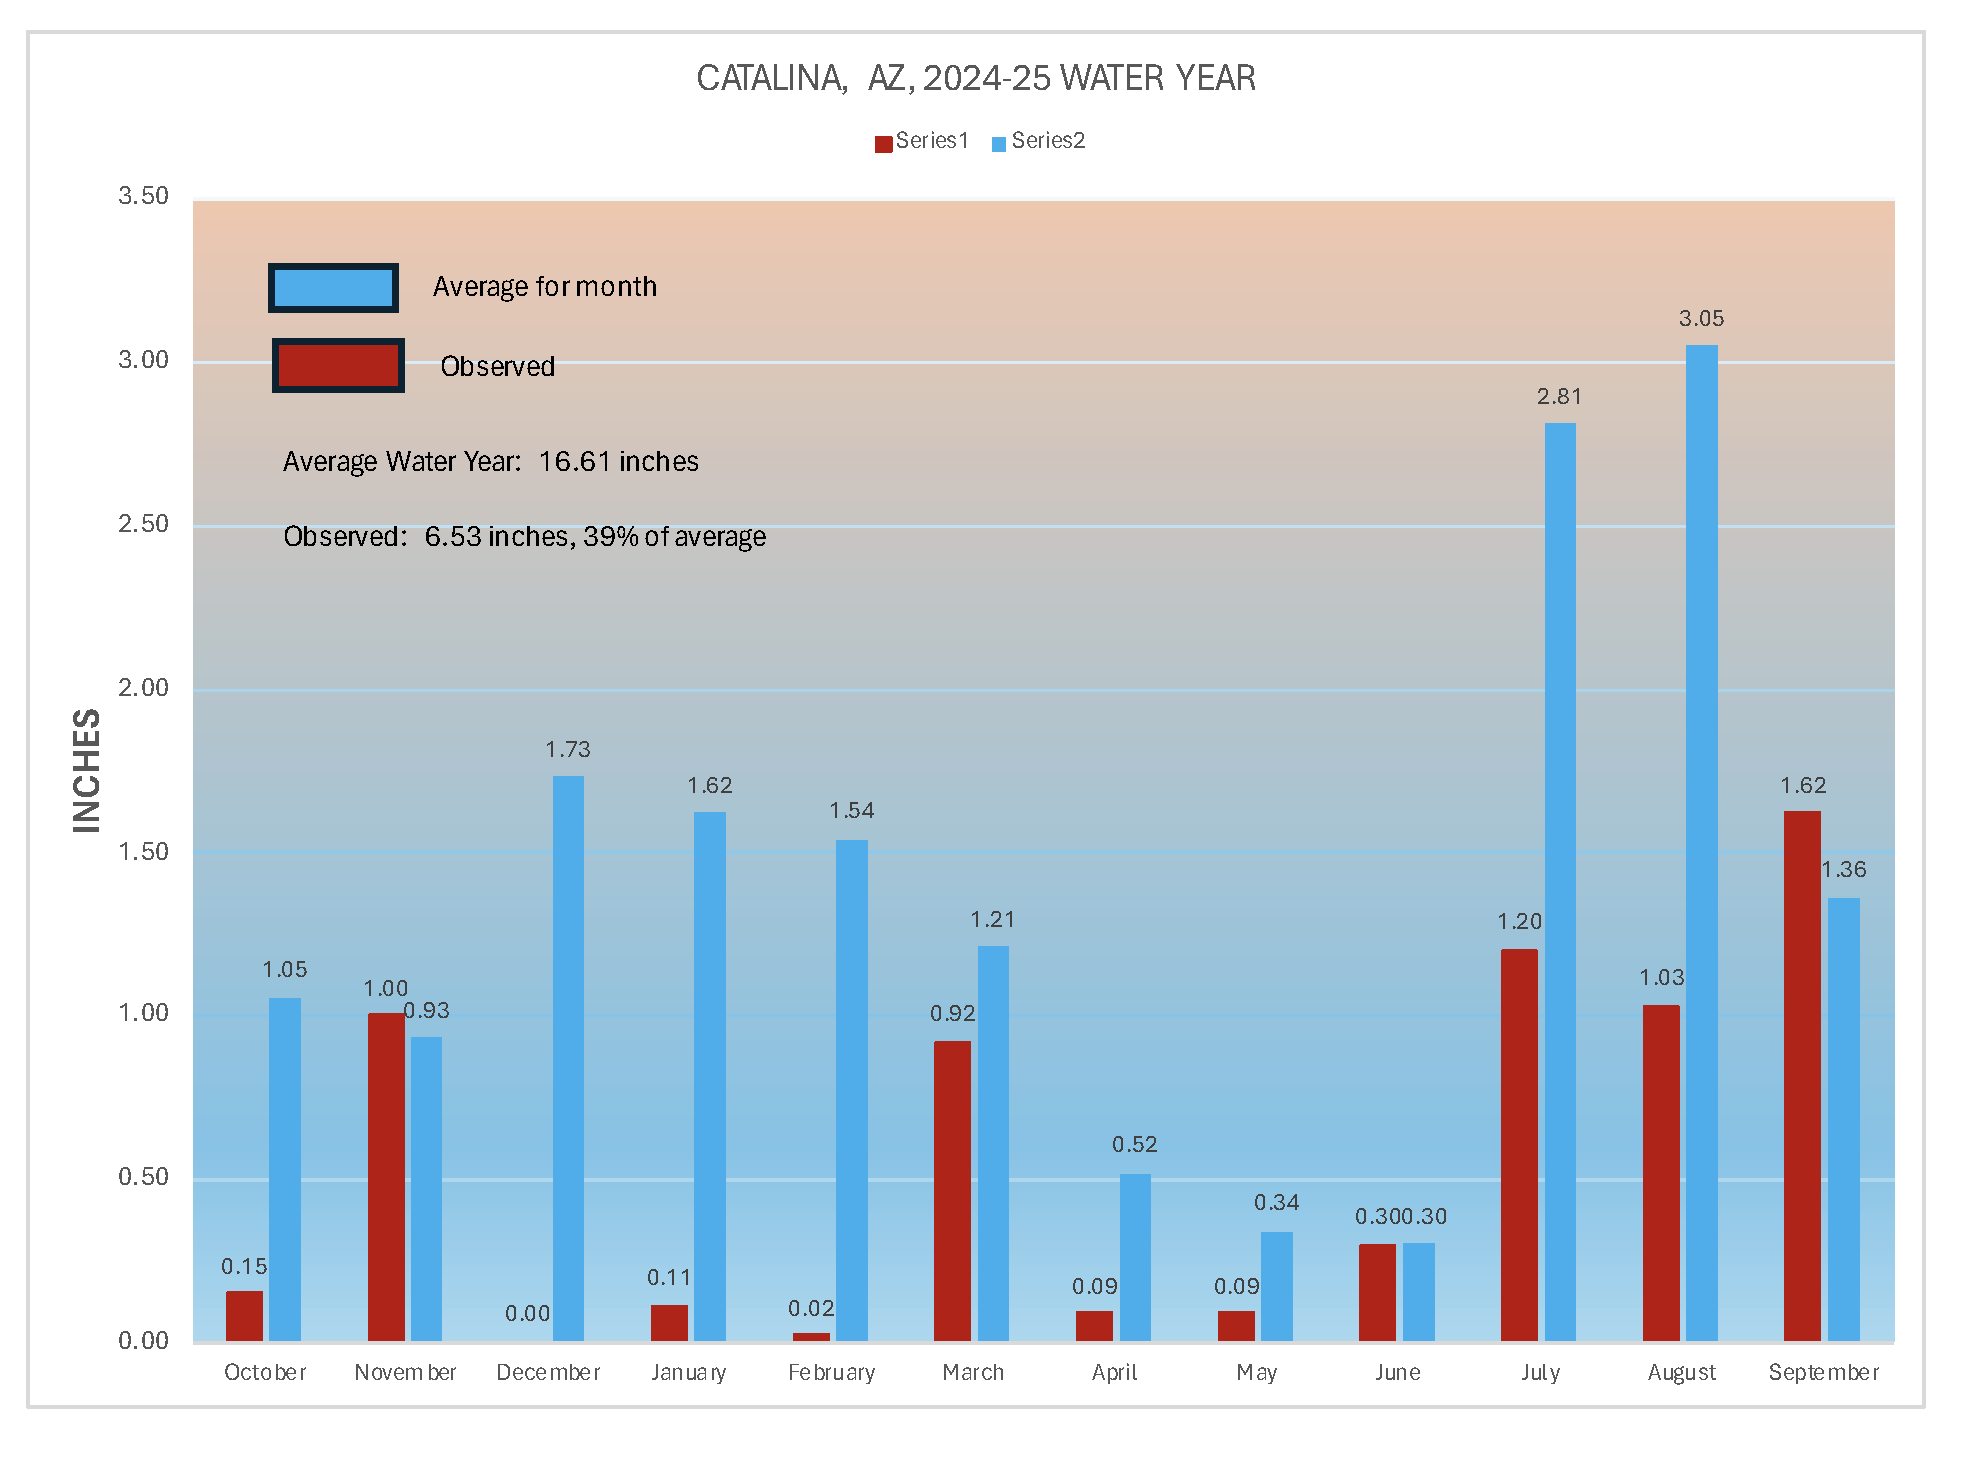
September was the only month in the past 12 with a noticeable rainfall total above average and the desert showed it with no spring greening, and barely one at the end of the summer rain season. The previous low water year total was 9.39 inches in the 1999-2000 water year, to give you some idea how “off the charts” we were this water year. But much of Arizona had more generous rains in September than Catalina, but probably too much all at once at Globe.
Is this the new normal? I don’t think so. However, it is notable that our average water year total since 2000 is only 14.81, down almost four inches from the WY average up to that point. However, there are reasons for that; big Niñoes and a big spurt from Mt. Pinatubo in the 15 years after the Catalina record started. If the Catalina record had started in the droughty years of the 1950-early 1970s, you would not see a decline.
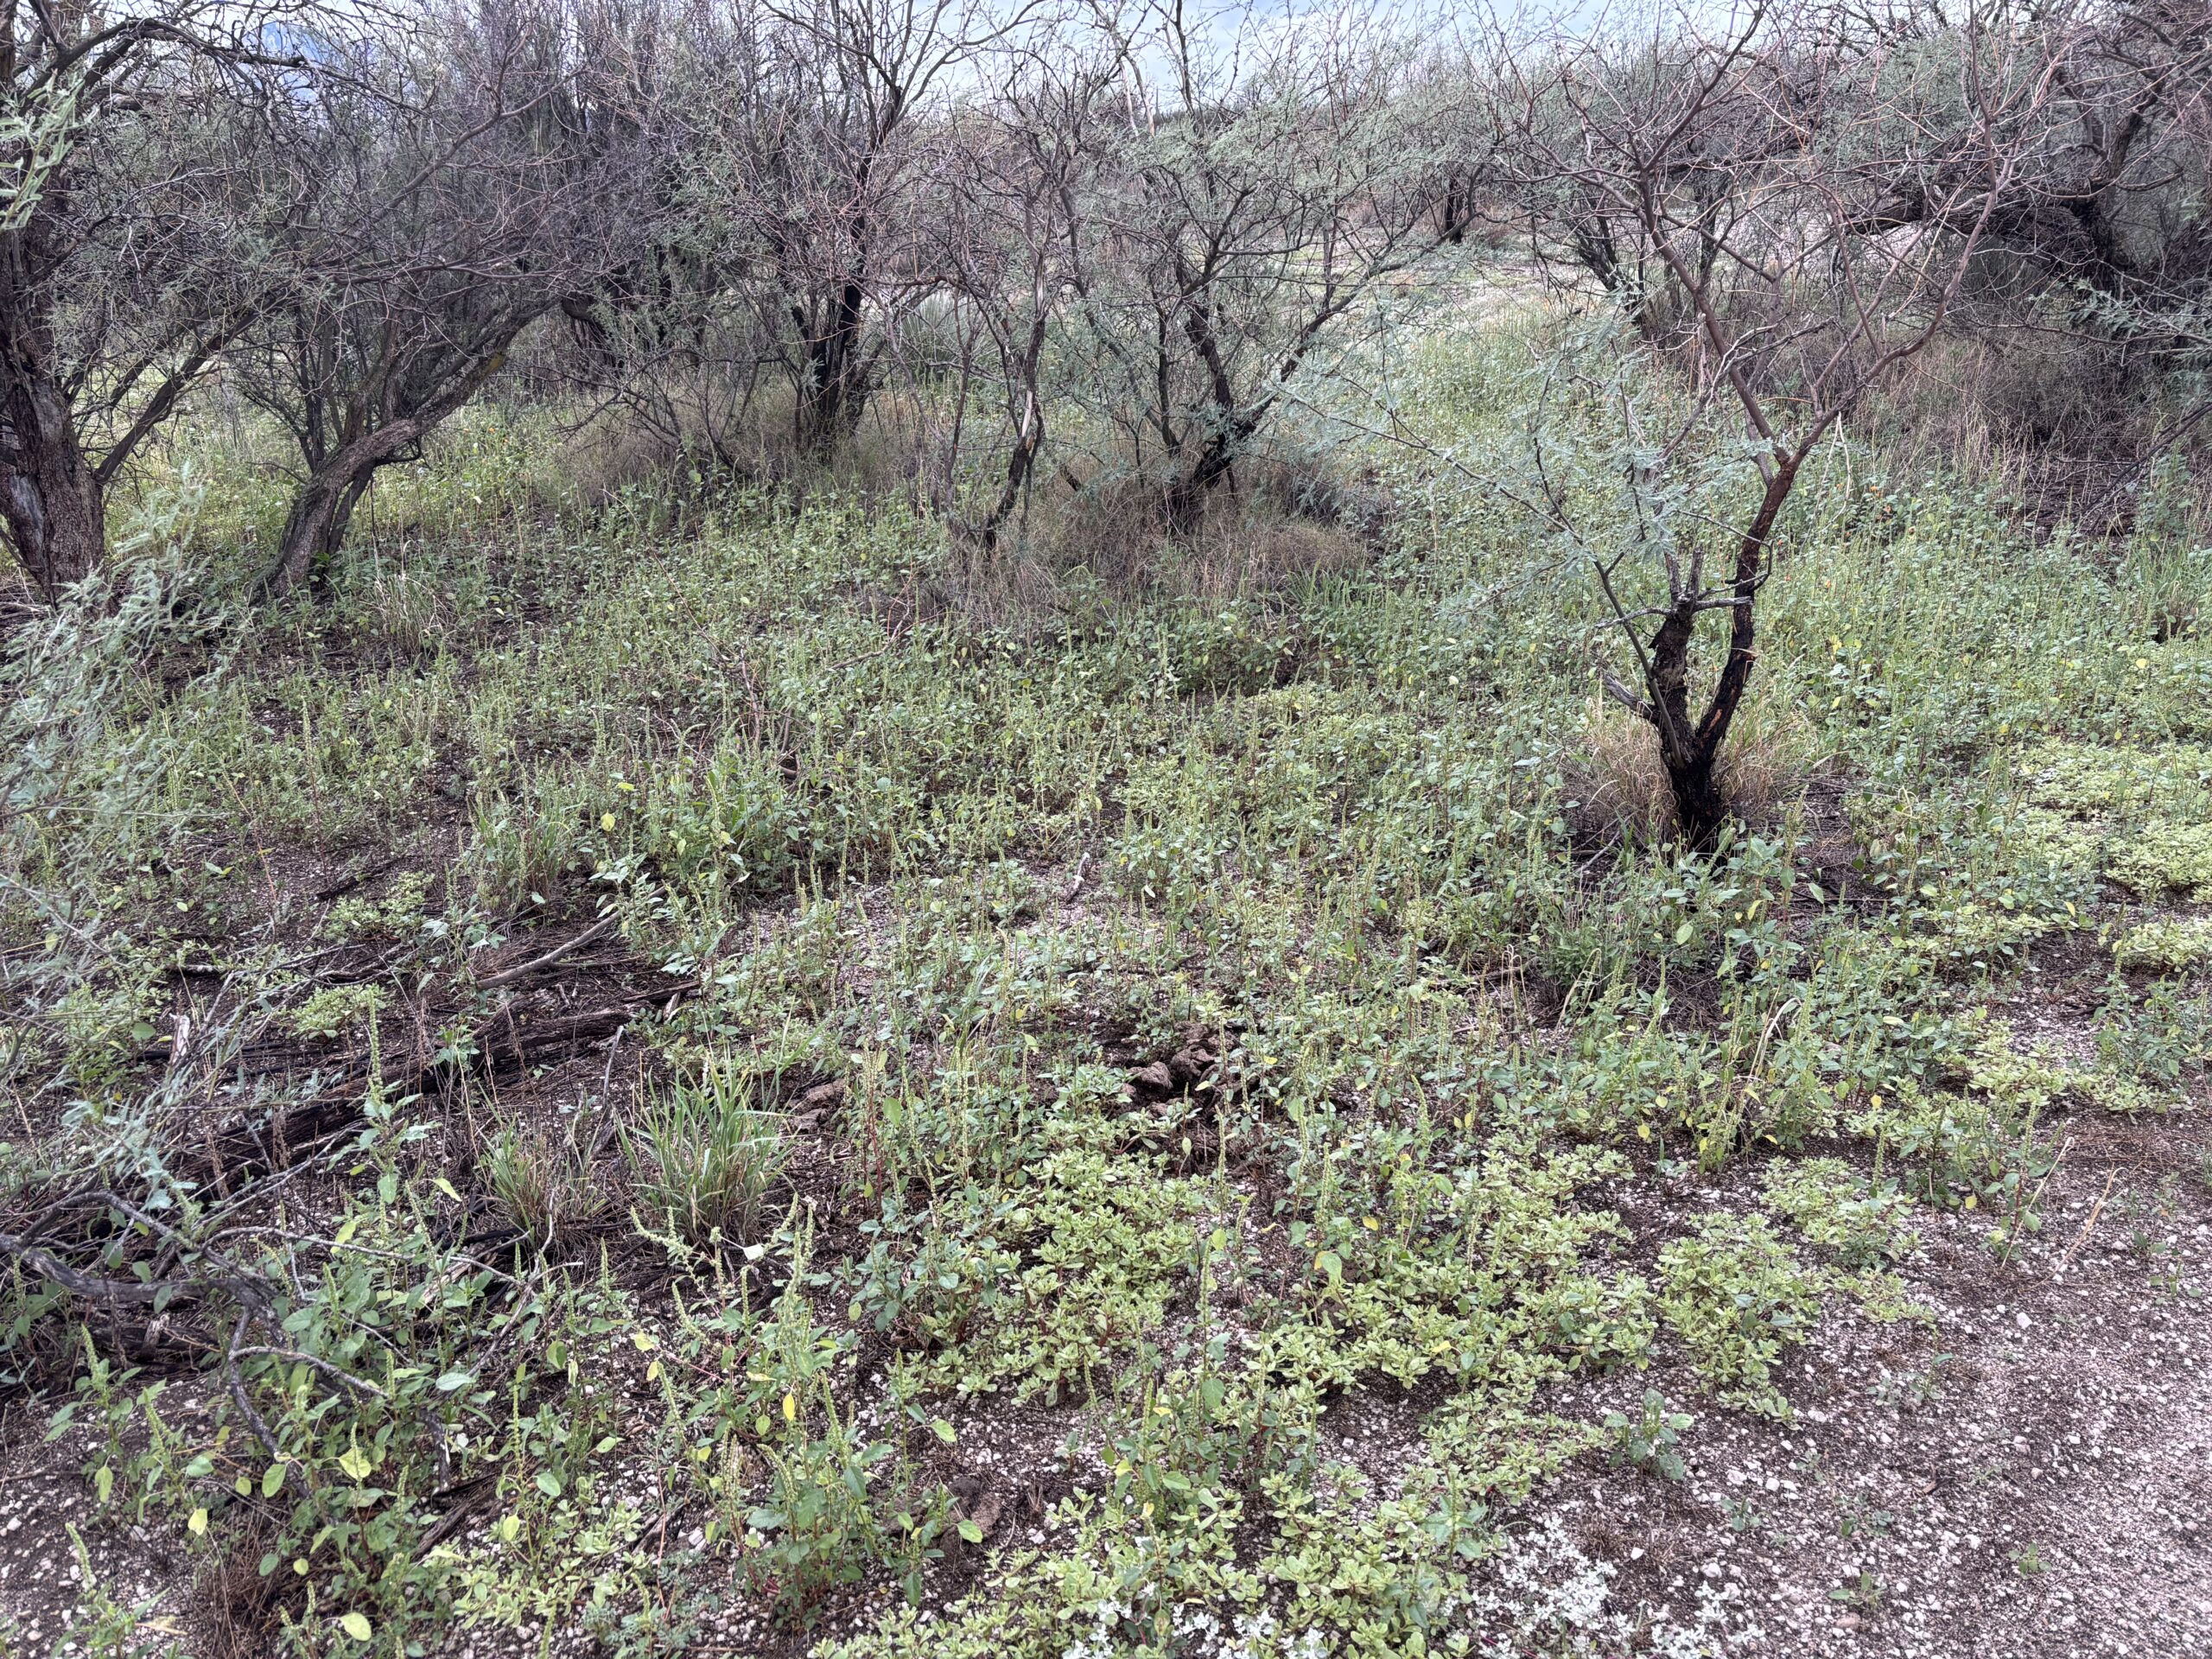
The last 30 days brought just over 2.5 inches to this site, beginning with a 0.95 inches drenching on August 26th, and the desert. despite how late the rains came, responded in spades. The free range cattle on the State Trust lands, within a couple of weeks finally had new growth to munch on. It was fantastic to see that!
The photo below was taken on September 17th, before the green started to fade under our declining sun and longer nights. I was coming out of the Sutherland Wash with doggie, Cody.
The Climate Prediction Center of NOAA has a La Niña in the works. As you may know, a La Niña is not so good for wintertime precipitation in Arizona. The odds are that our below rainfall totals will continue in the coming months, with the usual outlier, and I hope that outlier is “ginormous,” as they can be.
===========
I know the millions of you out there have been wondering WHAT have I been doing to be so unproductive at this website for so long. Well, I was being productive in the PEER-REVIEWED literature! Last July, the article appeared in the American Meteorological Society journal titled, “Weather, Climate, and Society.” Prof. Dave Schultz, U. of Manchester, England, my co-author is also the author of the book, “Eloquent Science” and a highly regarded atmospheric scientist.
The article:
https://journals.ametsoc.org/view/journals/wcas/17/3/WCAS-D-24-0076.1.xml
After it FINALLY (story on that some other time) “got in” to a different journal than the one we started with, I got a request to write a shorter, more accessible version by someone I greatly admire, Dr. Judith Curry (former chair, Atmospheric Sciences at Georgia Tech). That plain language, more candid version appeared on her website, Climate etc. not long afterwards. I recommend Curry’s 2023 book for an even handed view of the climate problem, “Climate Uncertainty and Risk.”
The plain language version:
It then appeared on another widely viewed website, What’s Up With That, always worth reading, right away. That was a big surprise.
Now it’s spread to several other websites! It is amazing to me that such an old story, but one that’s not such great a science one, could draw so much attention today. ALR
During the sport’s columnist, Jim Murray’s time at the Los Angeles Times, they had a weekend listing of all the upsets titled, “Read’em and Weep.” I’ve pinched that title for this water year’s dreadful total; truly an “upset.” No one saw a WY as deficient as this one coming. Neighbors are putting out tubs of water for wildlife. However, the near inch of rain a week ago has spawned a desert greening, with even summer poppies being spotted. The free range cattle now have their noses on the ground scarfing up as much of this skin of greening as they can. Pig weeds are already sprouting seeds at only 2-3 inches high! I guess they know they have to do that when it’s this late and further moisture around here is a crap shoot. Thankfully, too, the greening has muted the possibility of strong erosion that goes with all the bare ground we’ve had which has completely disappeared in many areas of the desert.
August has been a huge disappoint after July had but 43% of average rainfall. In fact, this is the FIRST August in which the first 14 days have not had measurable rain in Catalina! Yikes. The desert looks awful, especially in those areas subject to brush removal and runoff enhancement projects hereabouts by the fire department last year. Poor critters like our free range cattle are eating dead prickly pear cactus since there was no spring greening, and now virtually no summer greening either. Here’s the bad news for our 2o24-25 water year through July. Our best hope for some “juice” is the last ten days of August, according to recent model projections, and maybe, a dying hurricane remnant barging into the state in September. Fingers crossed.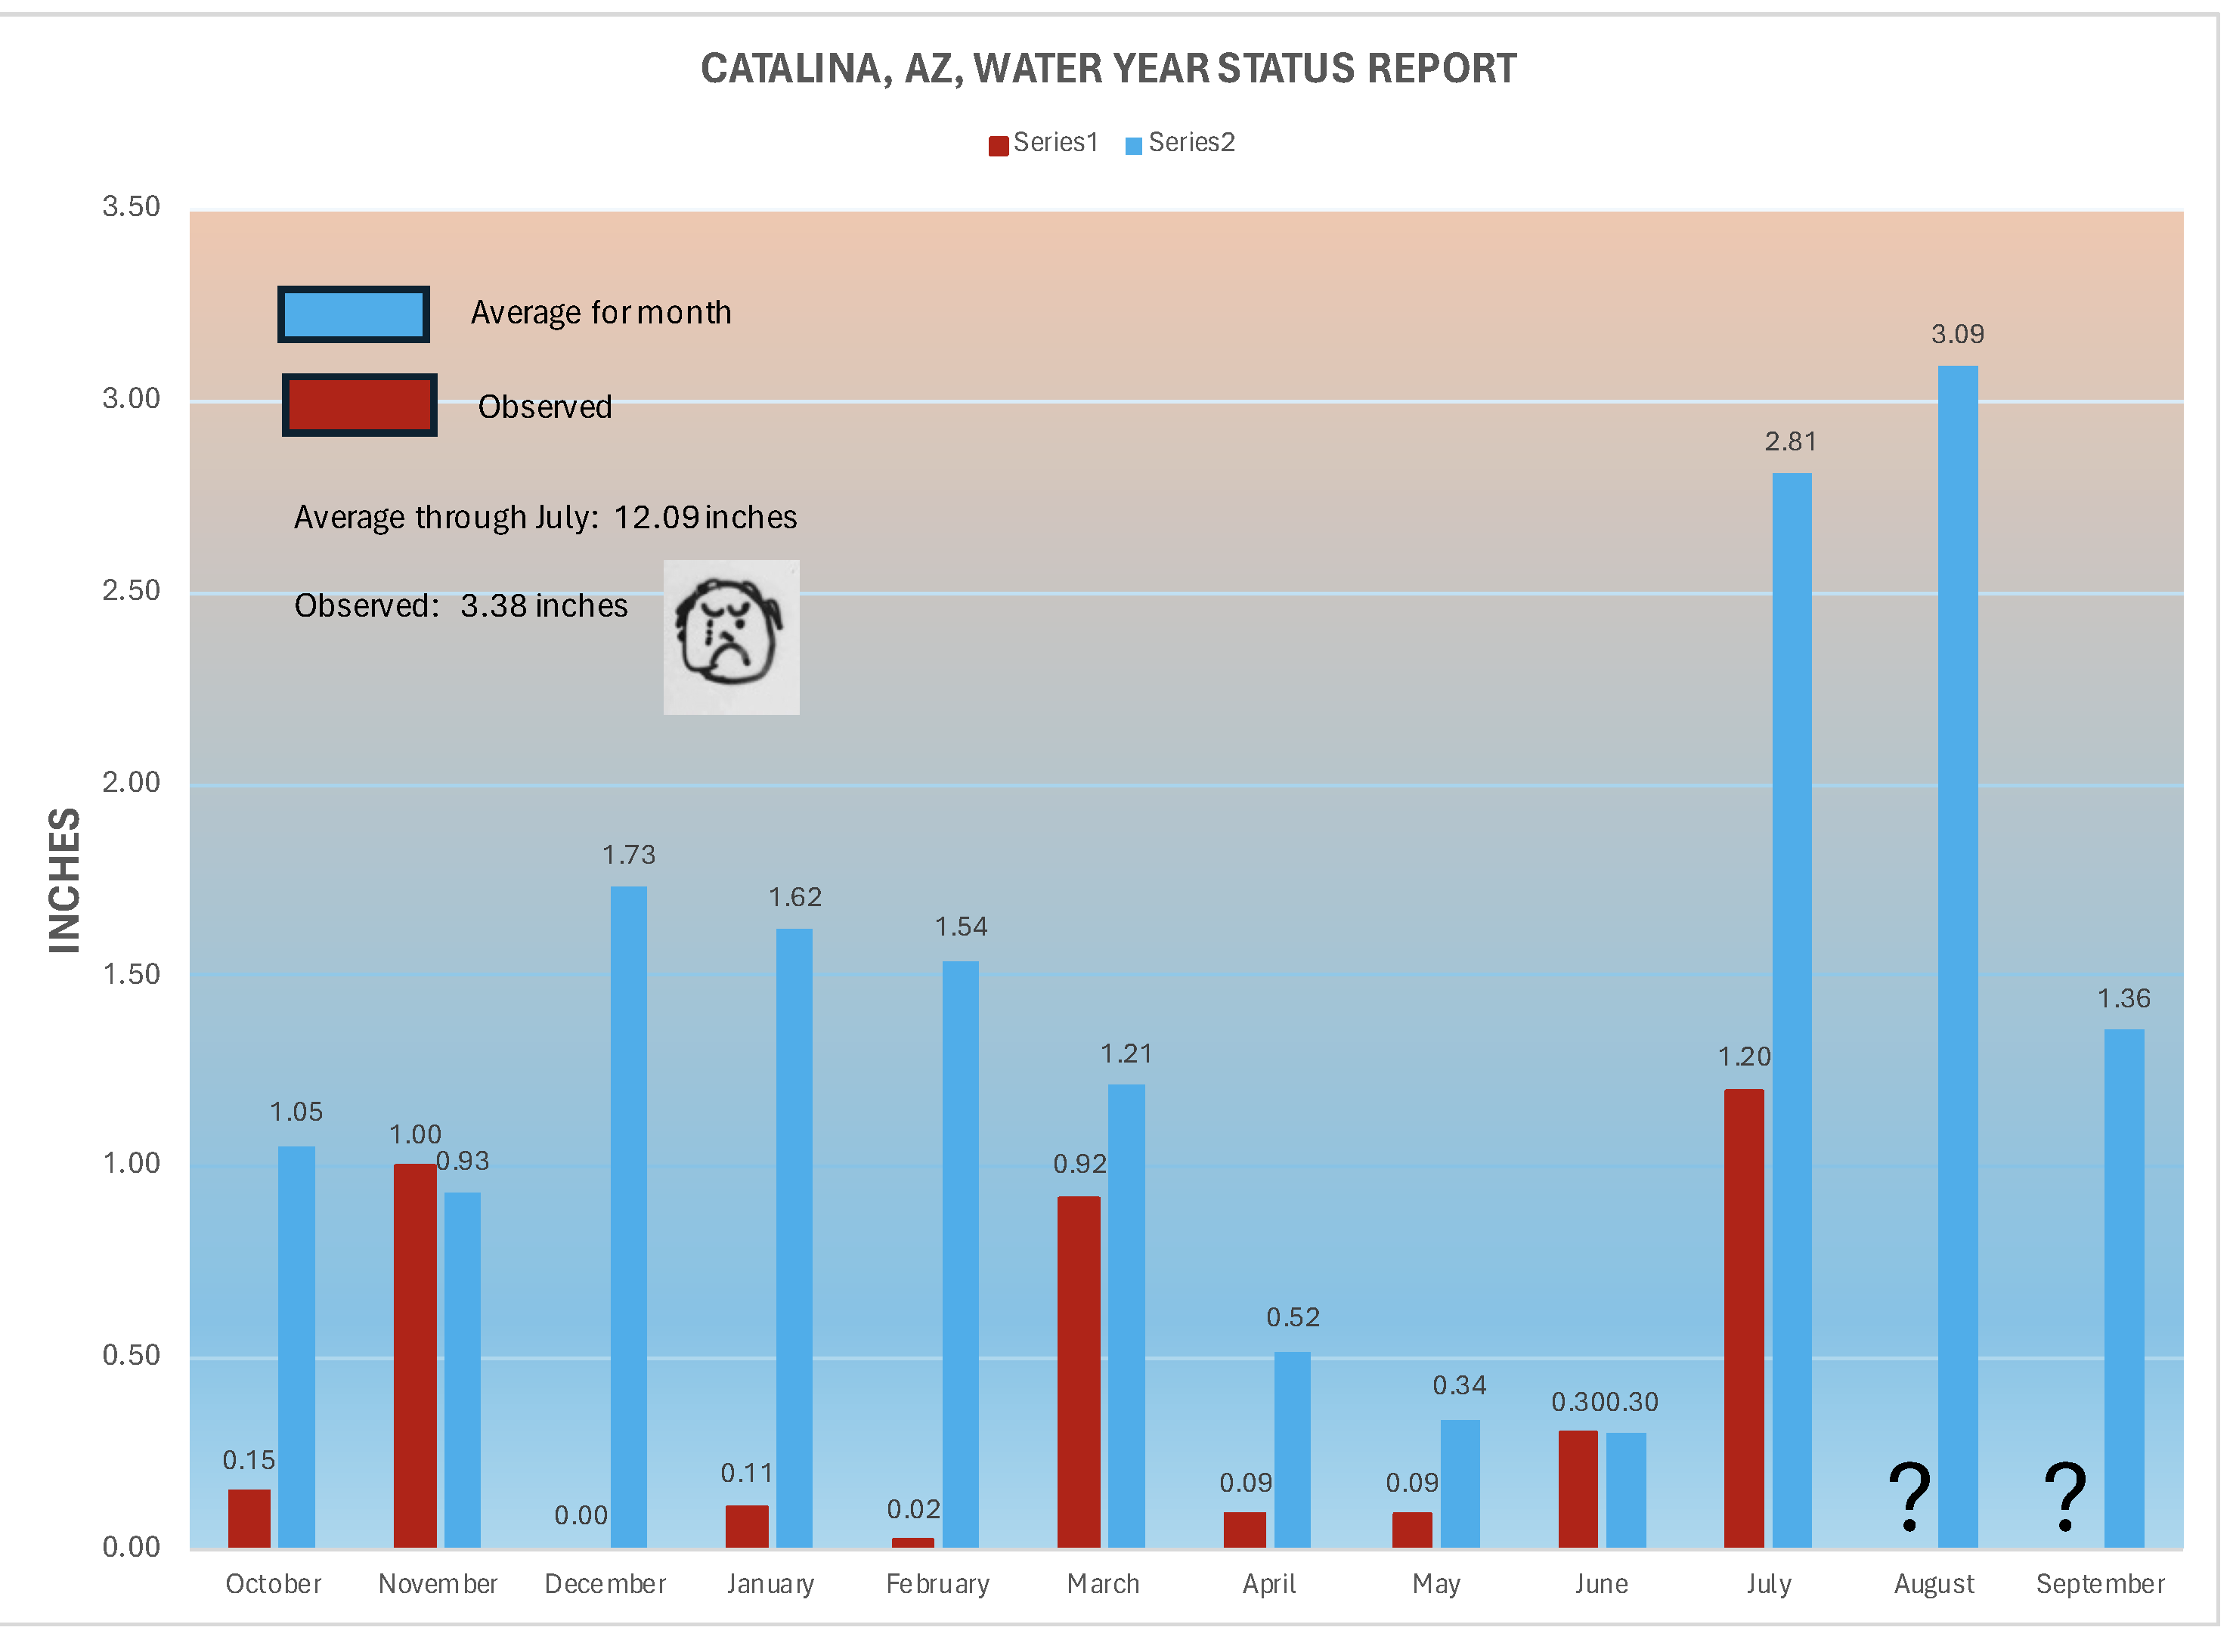
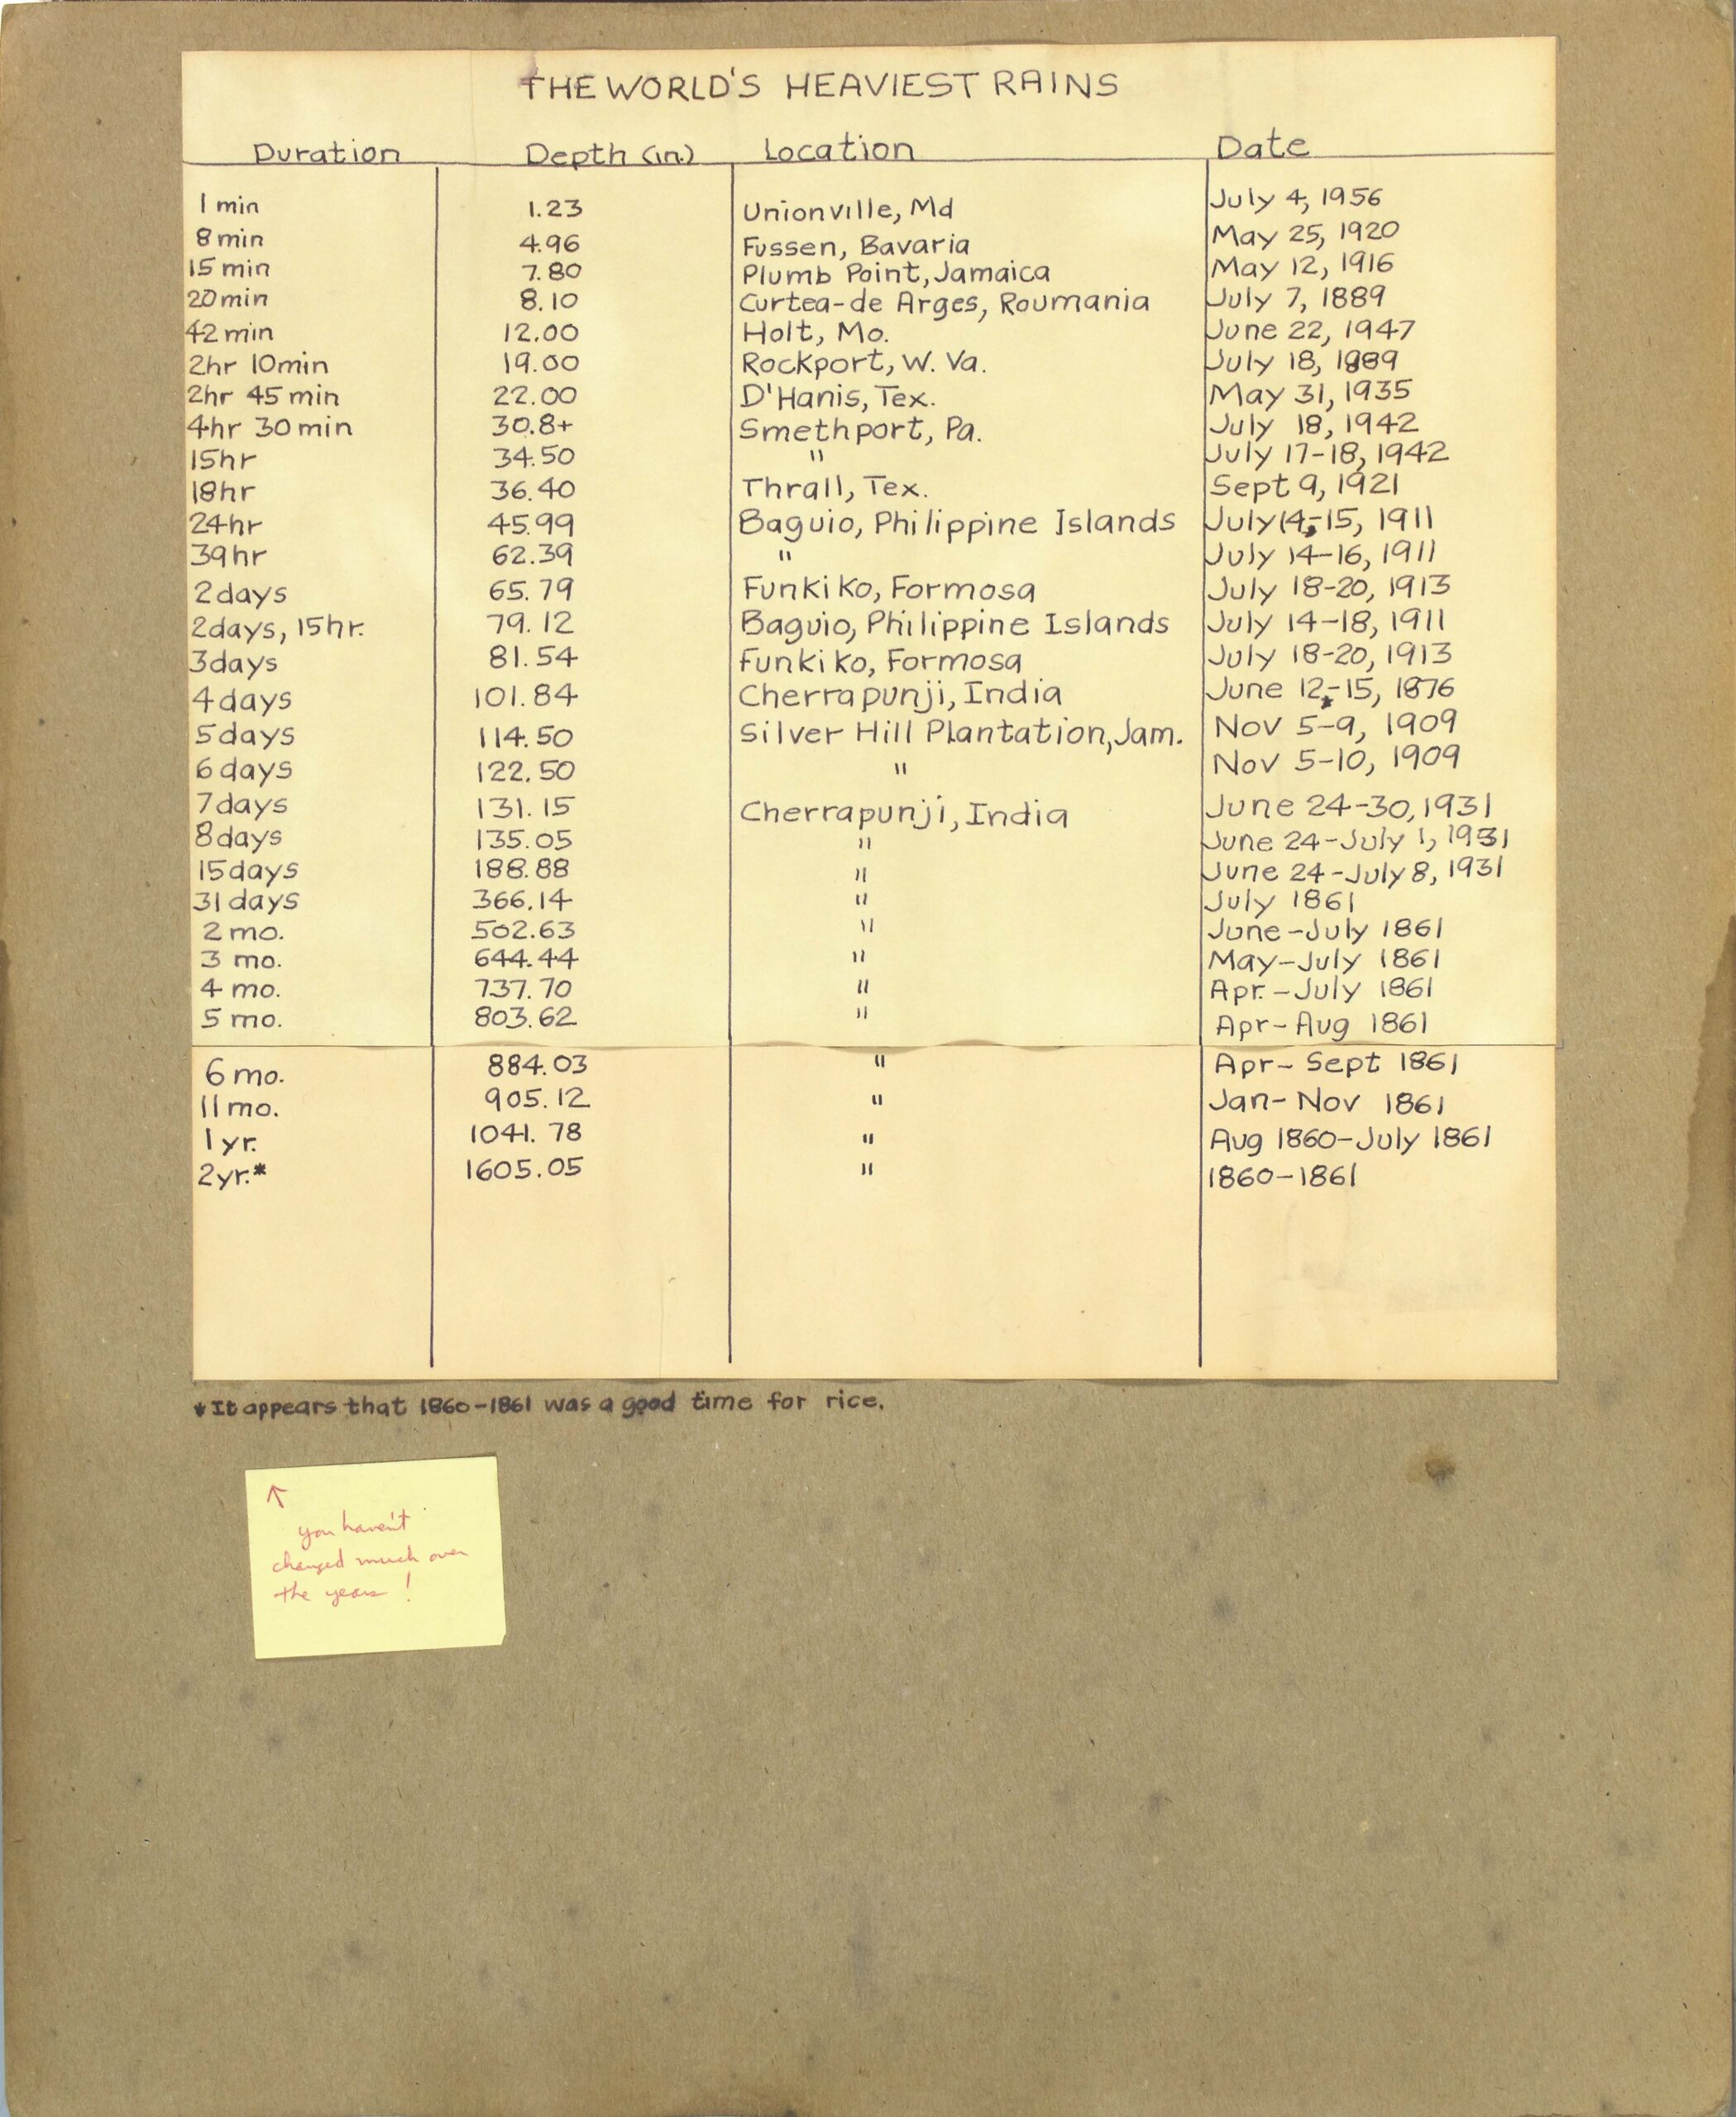
In view of the recent Texas flood tragedy, and some outlandish climate change claims, I thought I would post this list copied off the back of “The Daily Weather Map” for my 1958 Reseda High School physics term project about weather. That project ended with this table of world record rainfalls over various durations. It seems there were plenty or rainfall “extremes” for almost a hundred years preceding 1958. Some are pretty amazing. Note those that had occurred in the USA for some perspective.