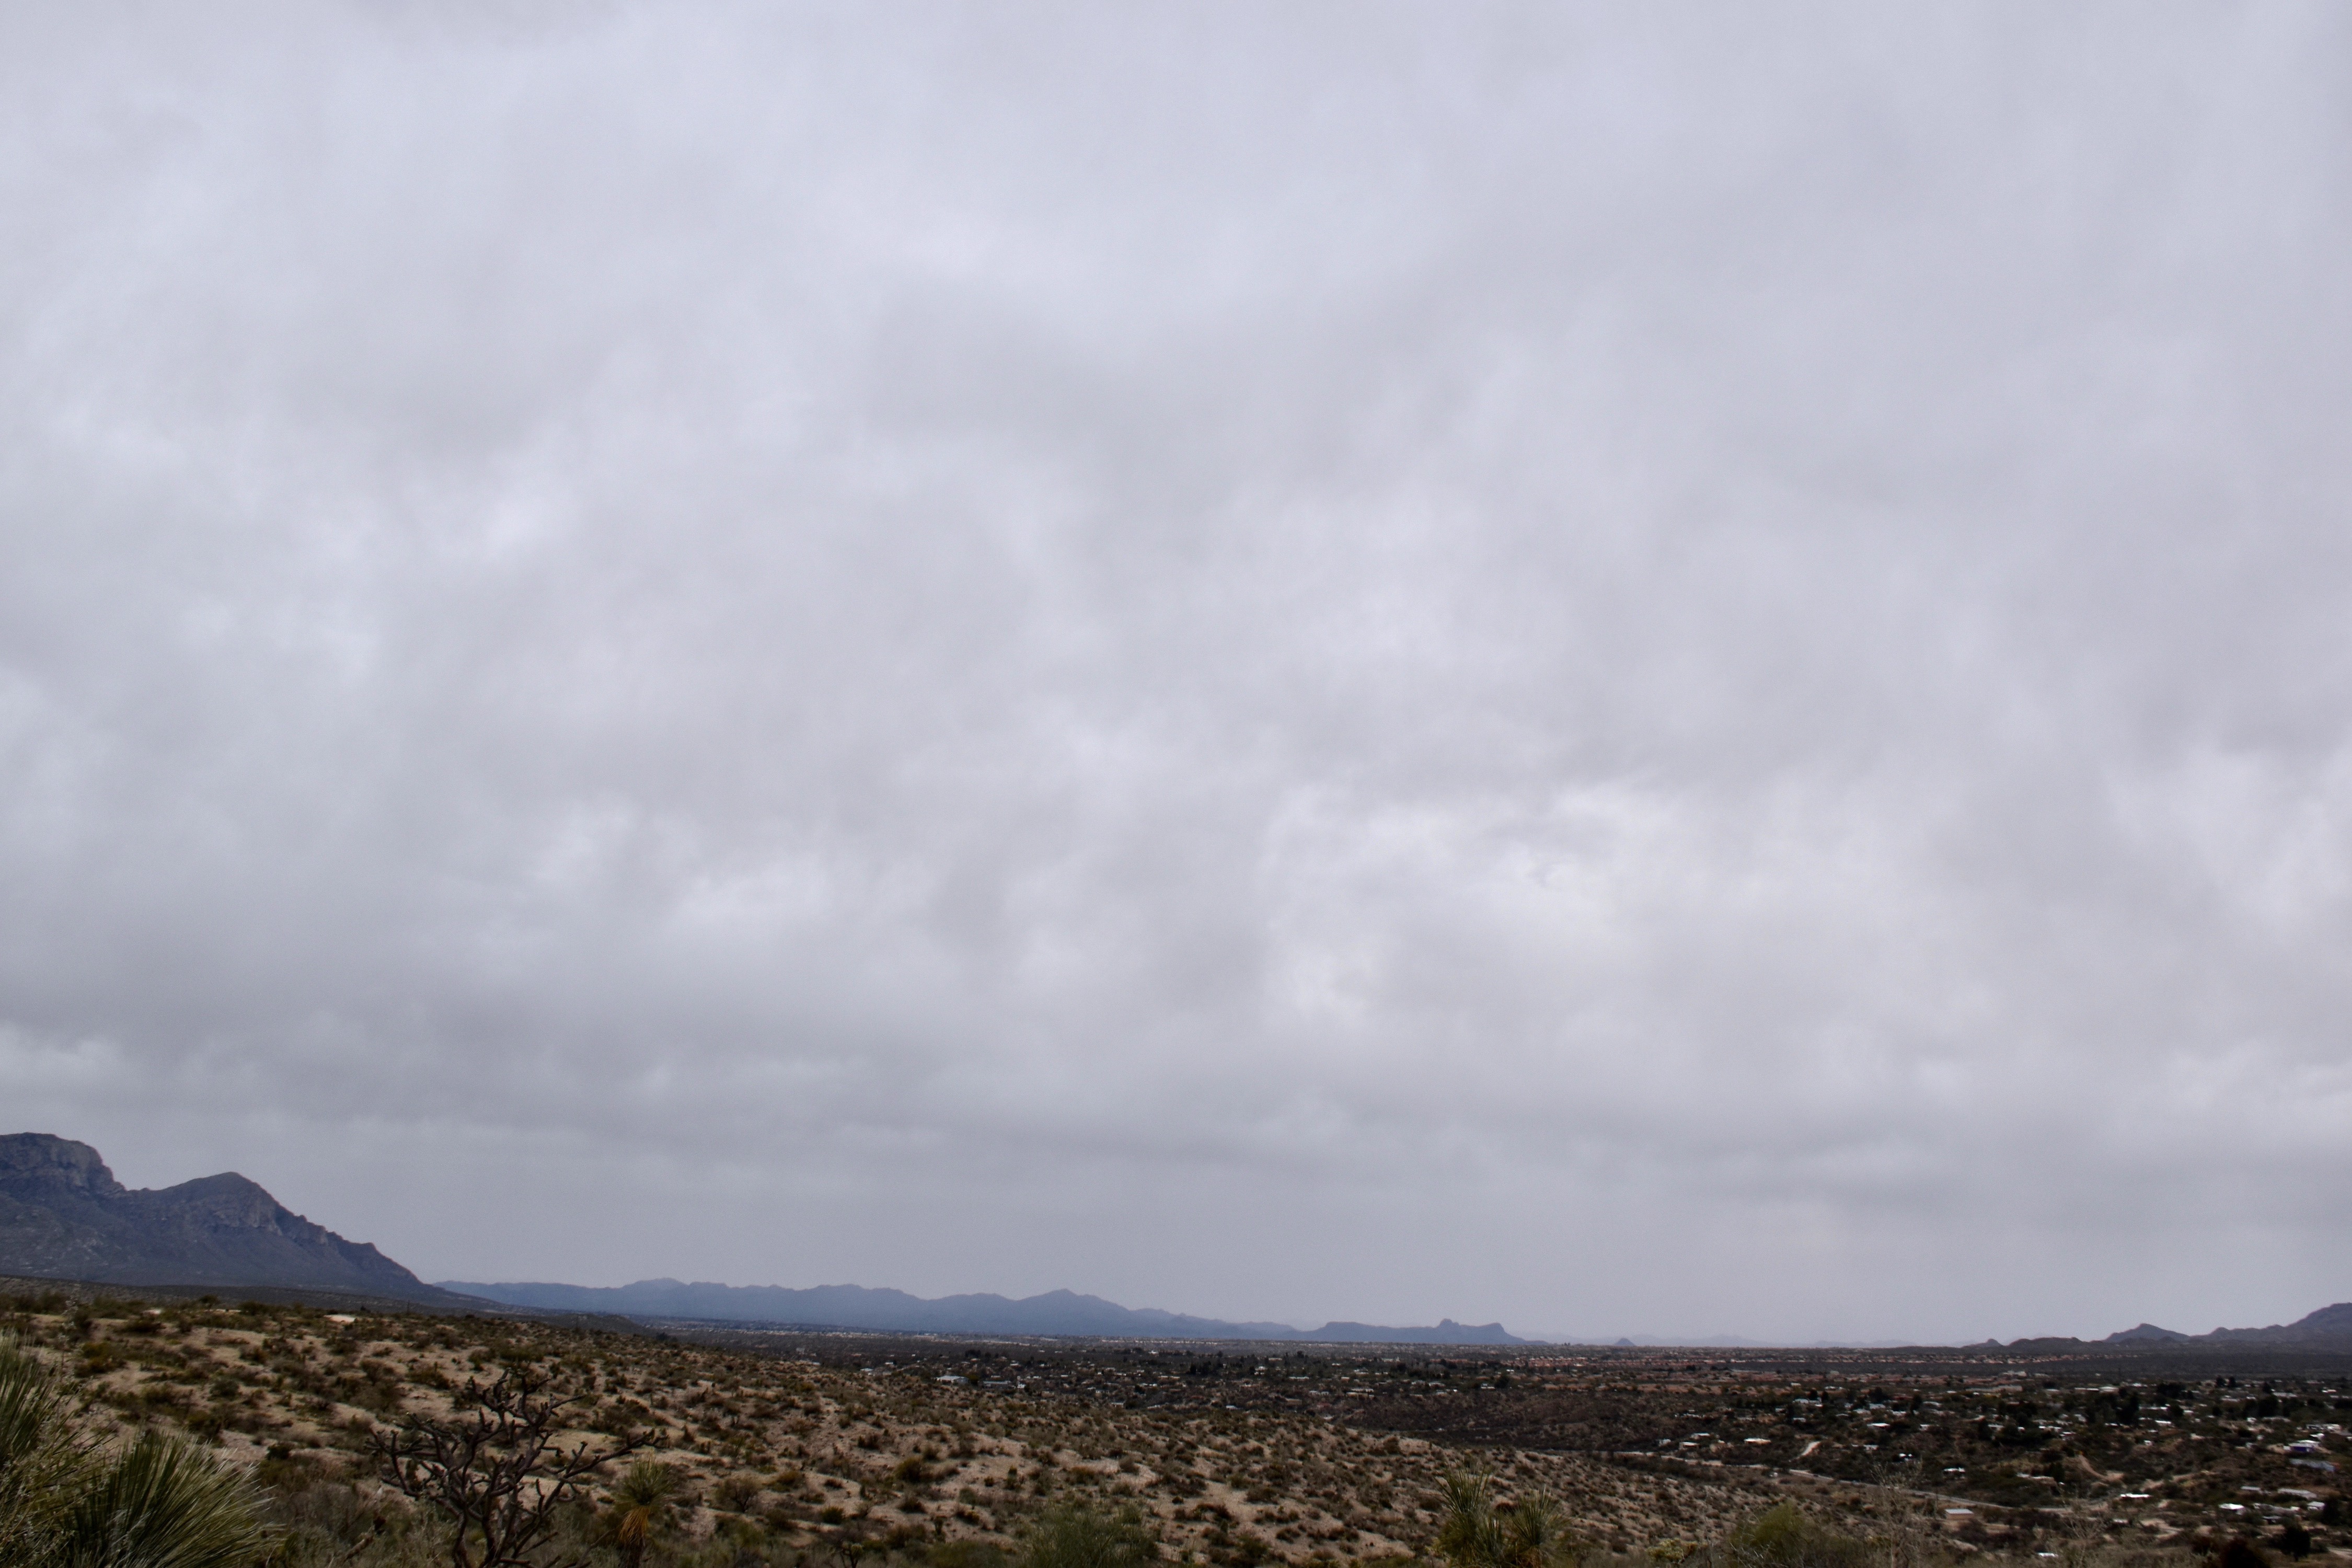
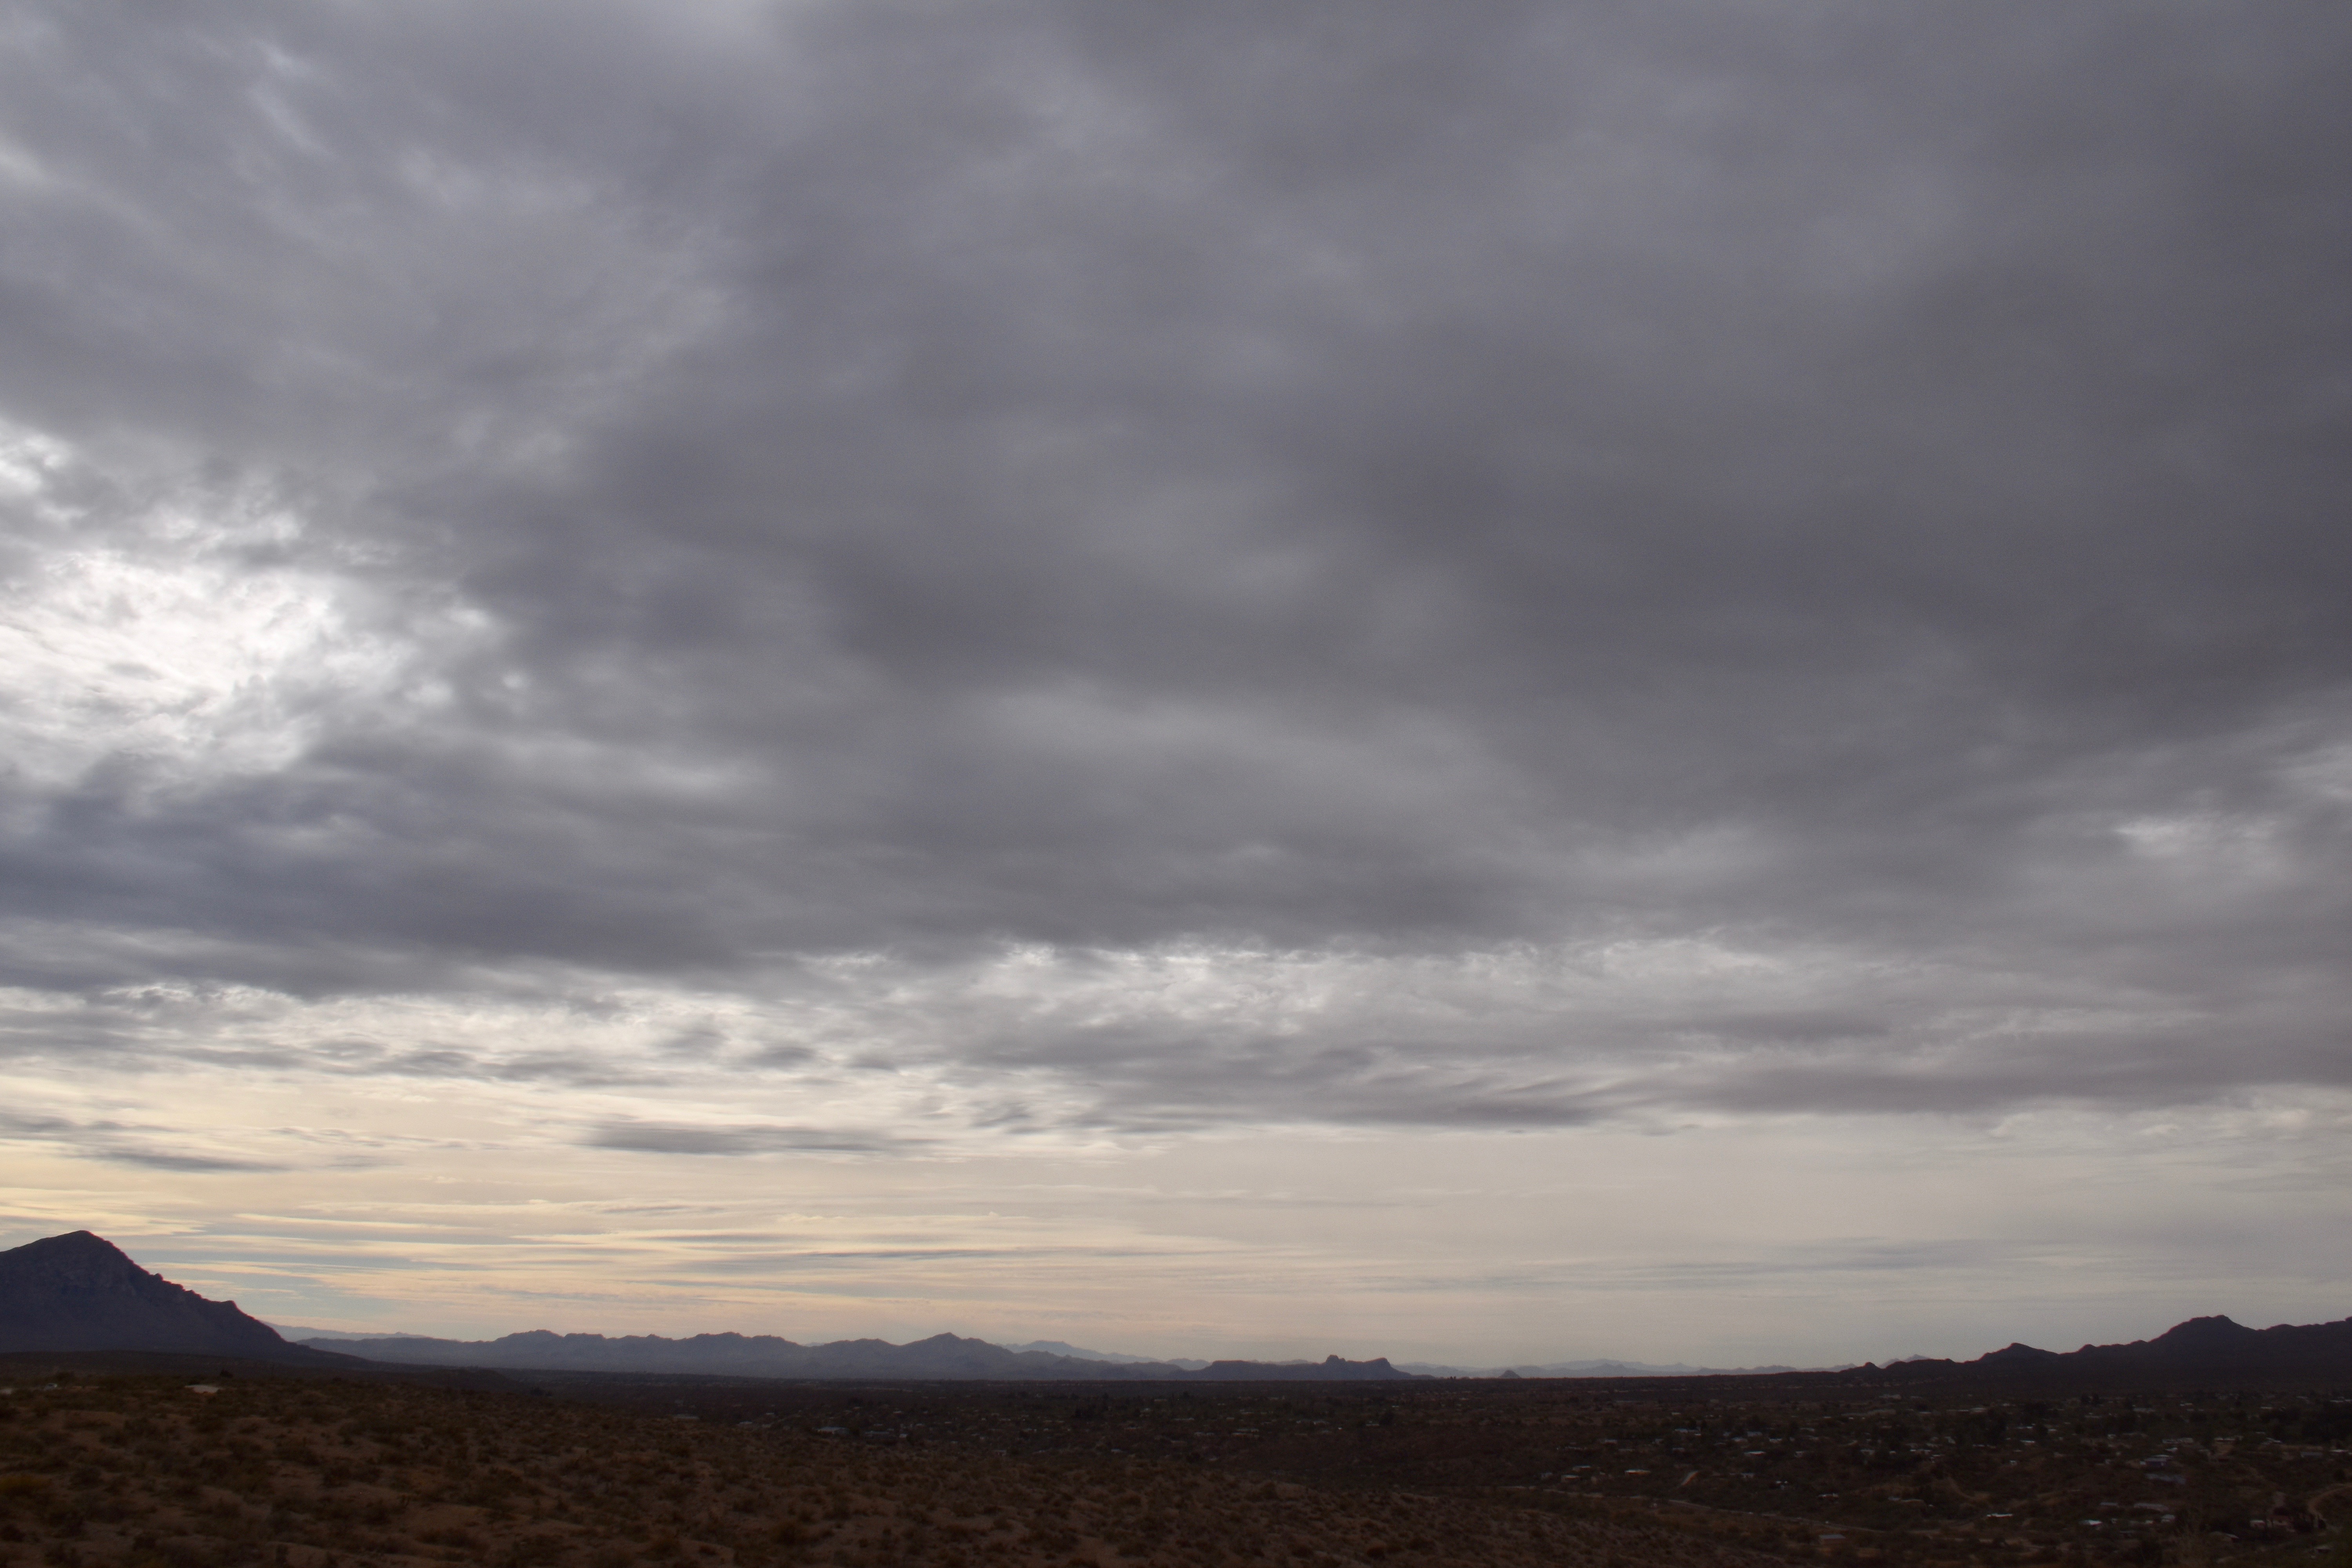
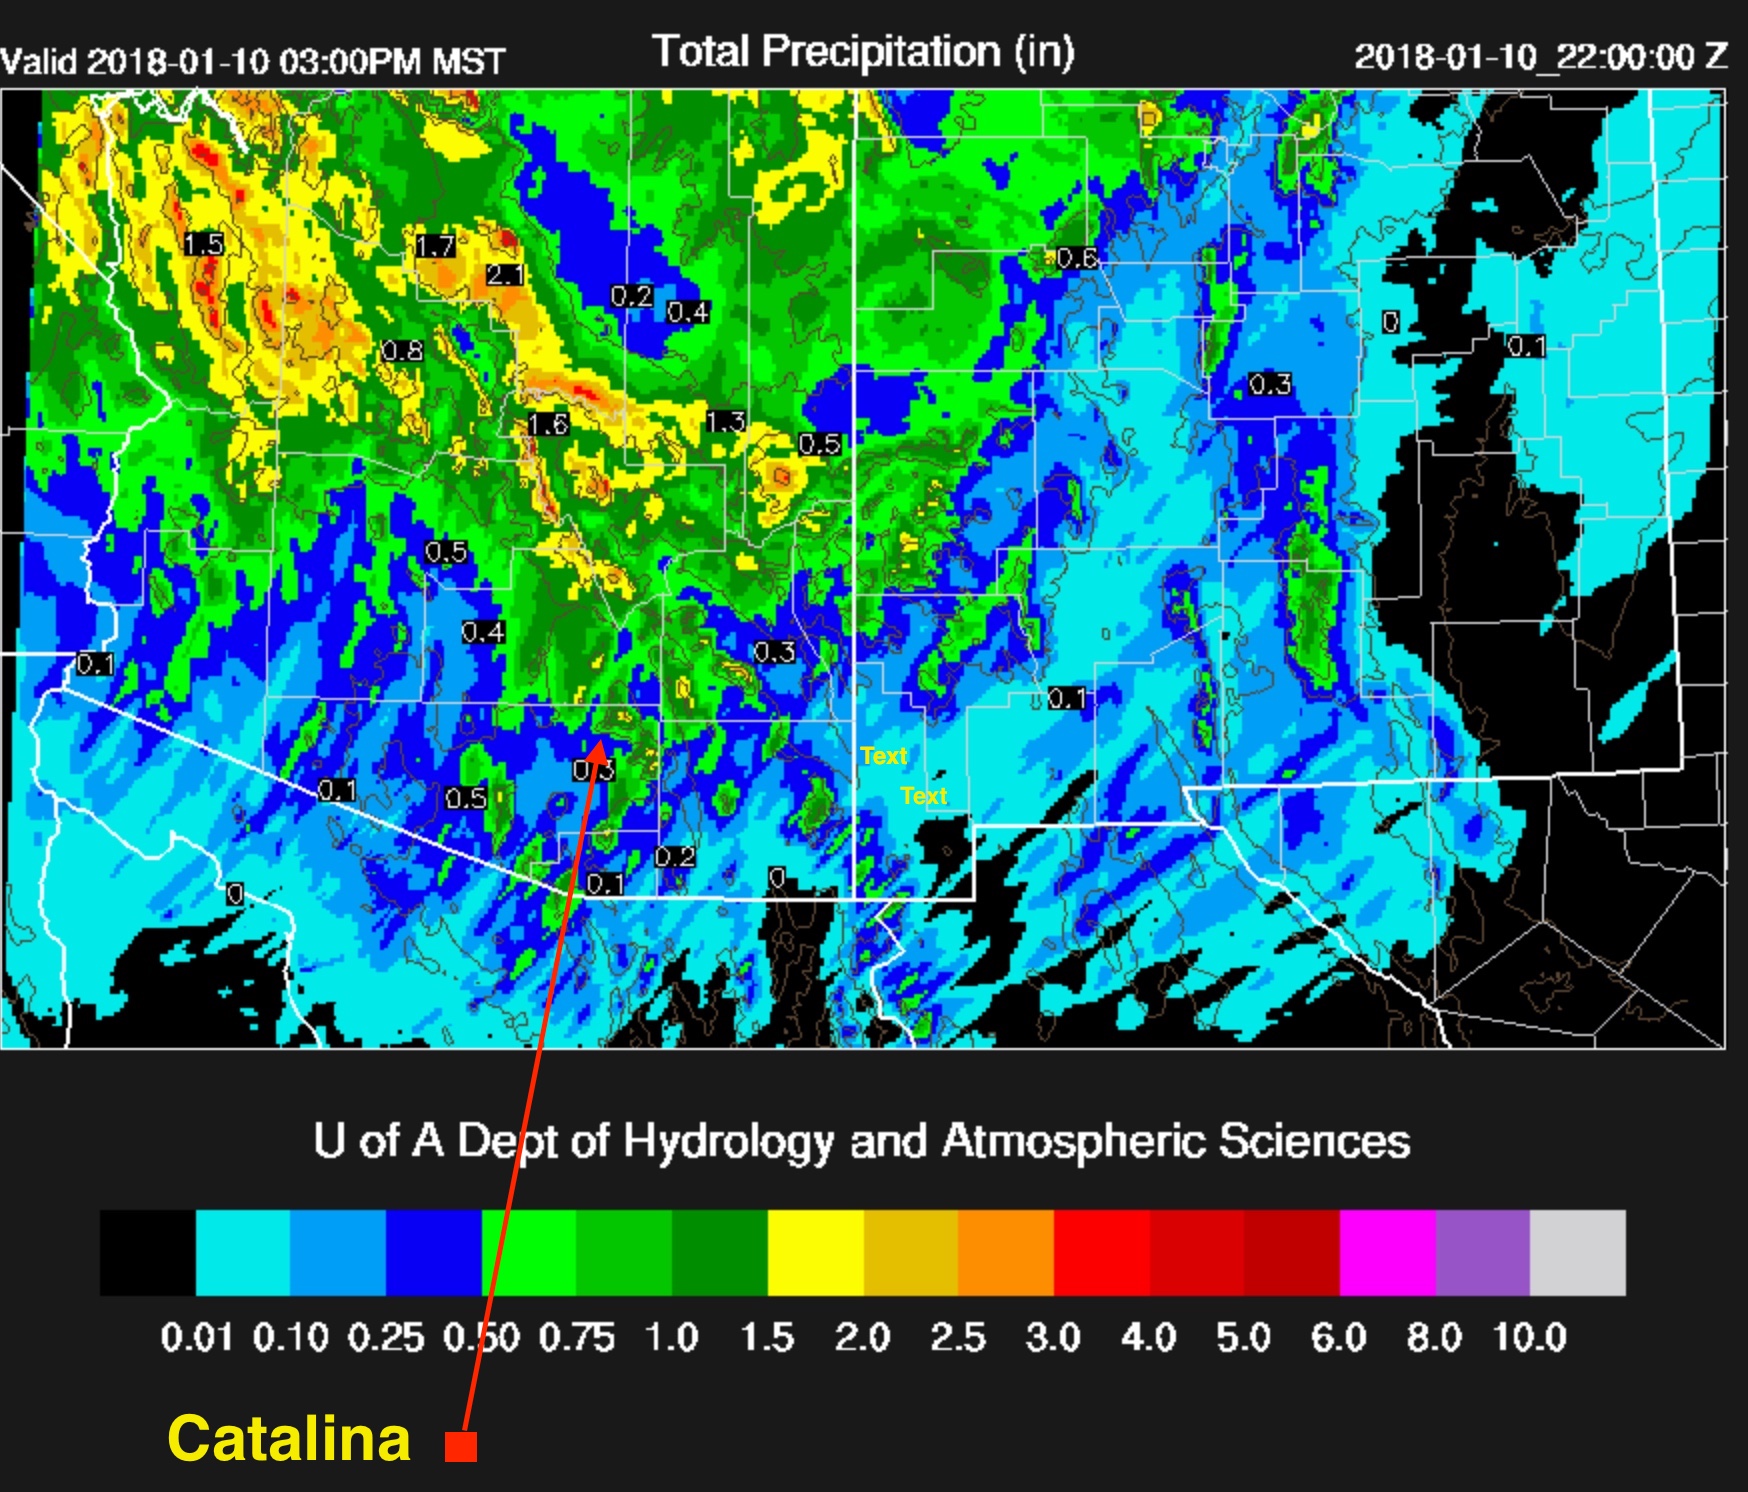
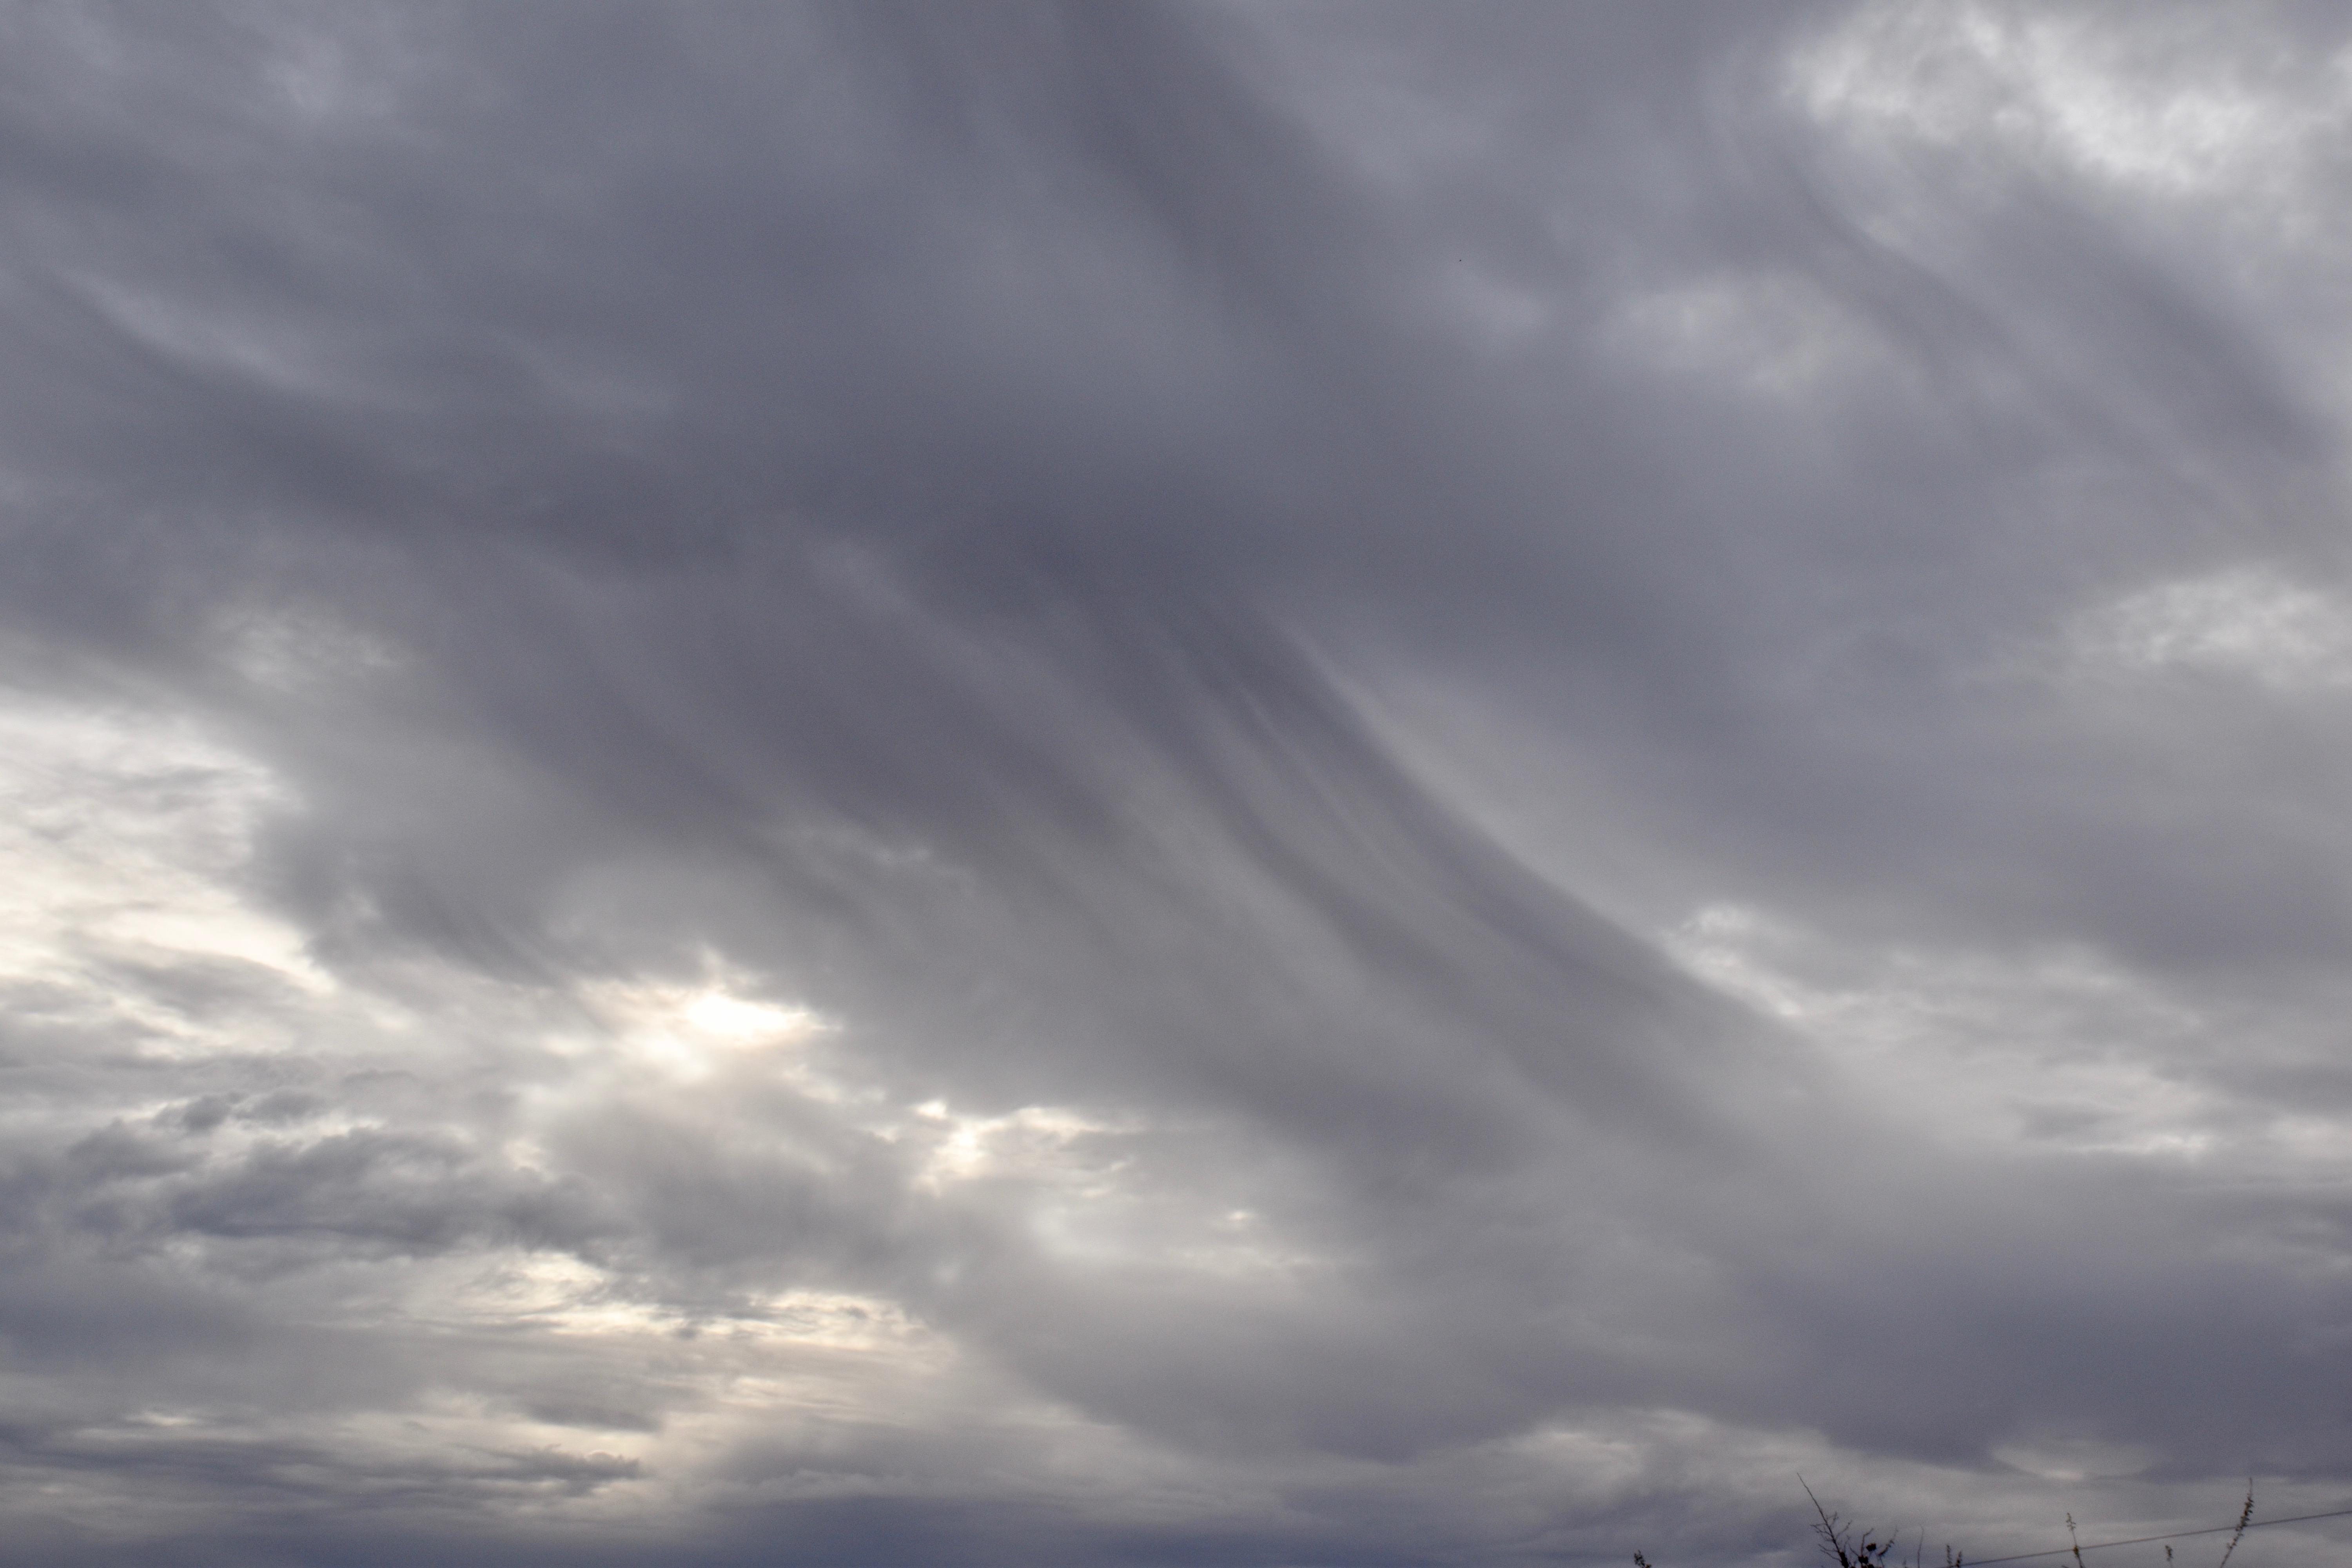
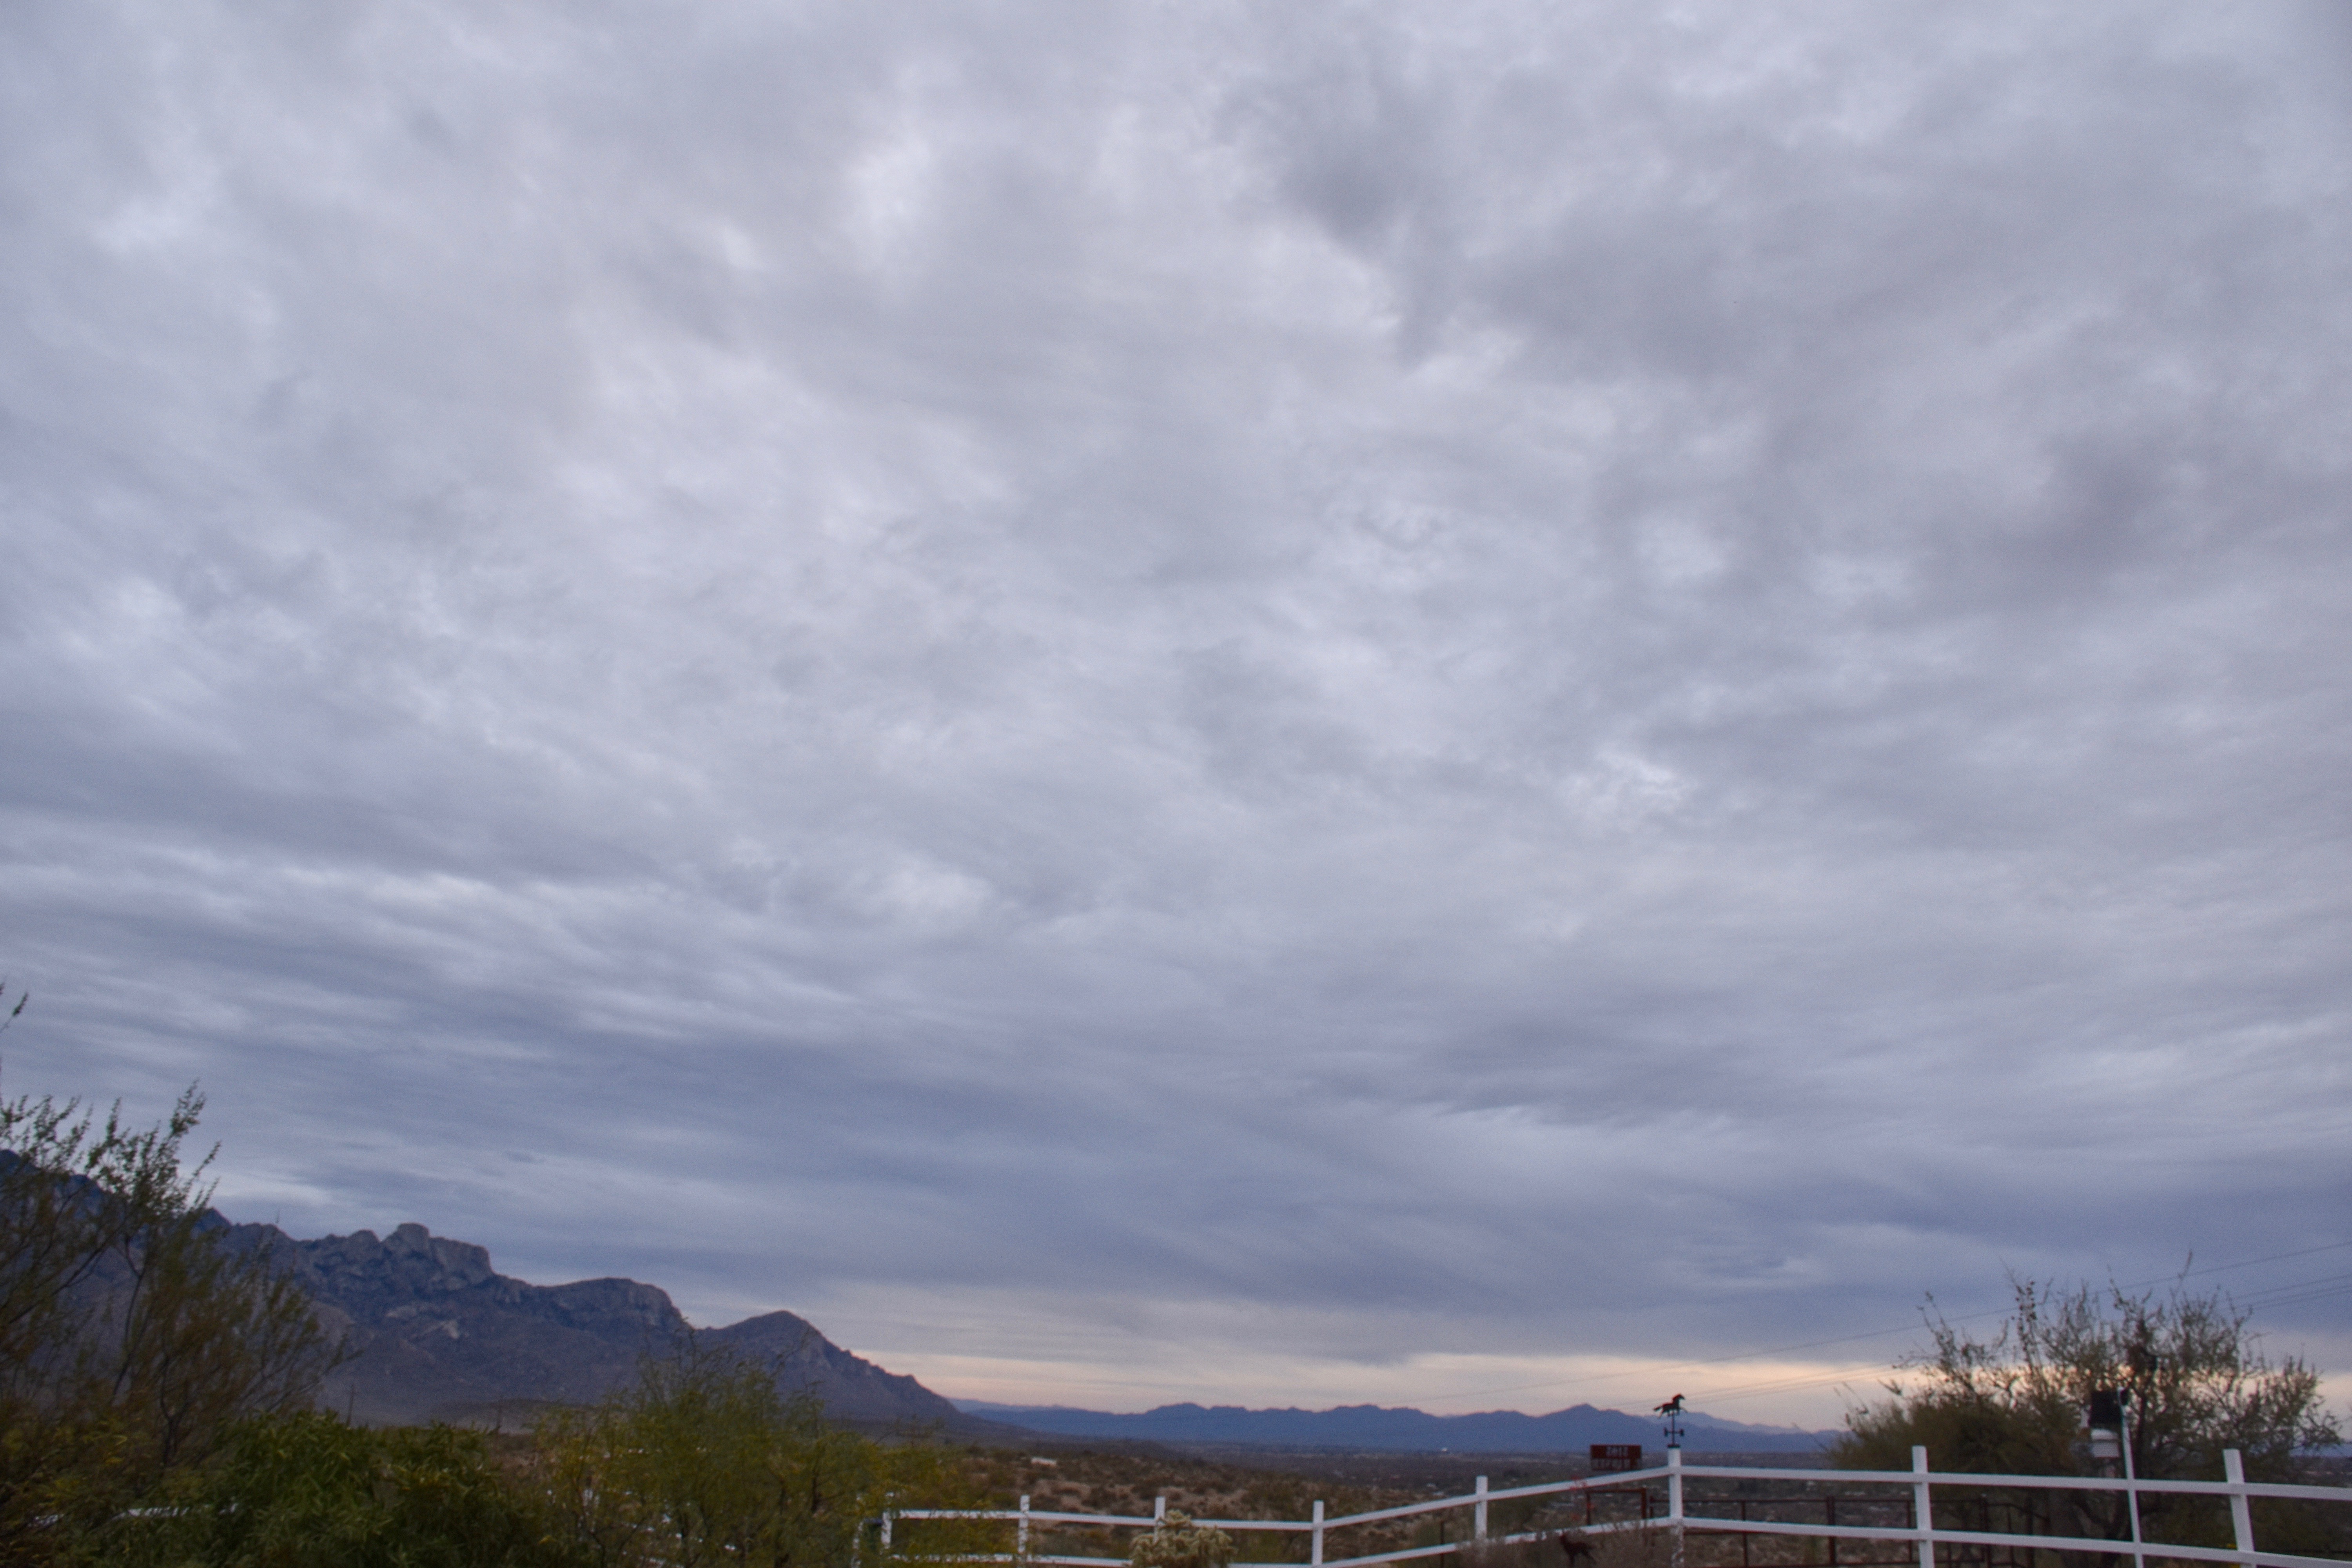
Huh, Sounds familiar. Well, 50 shades of gray is a theme here at cloud-maven.com. Those various shades brought 0.02 inches of rain this morning to The Heights. Here are yesterday’s 50 shades:
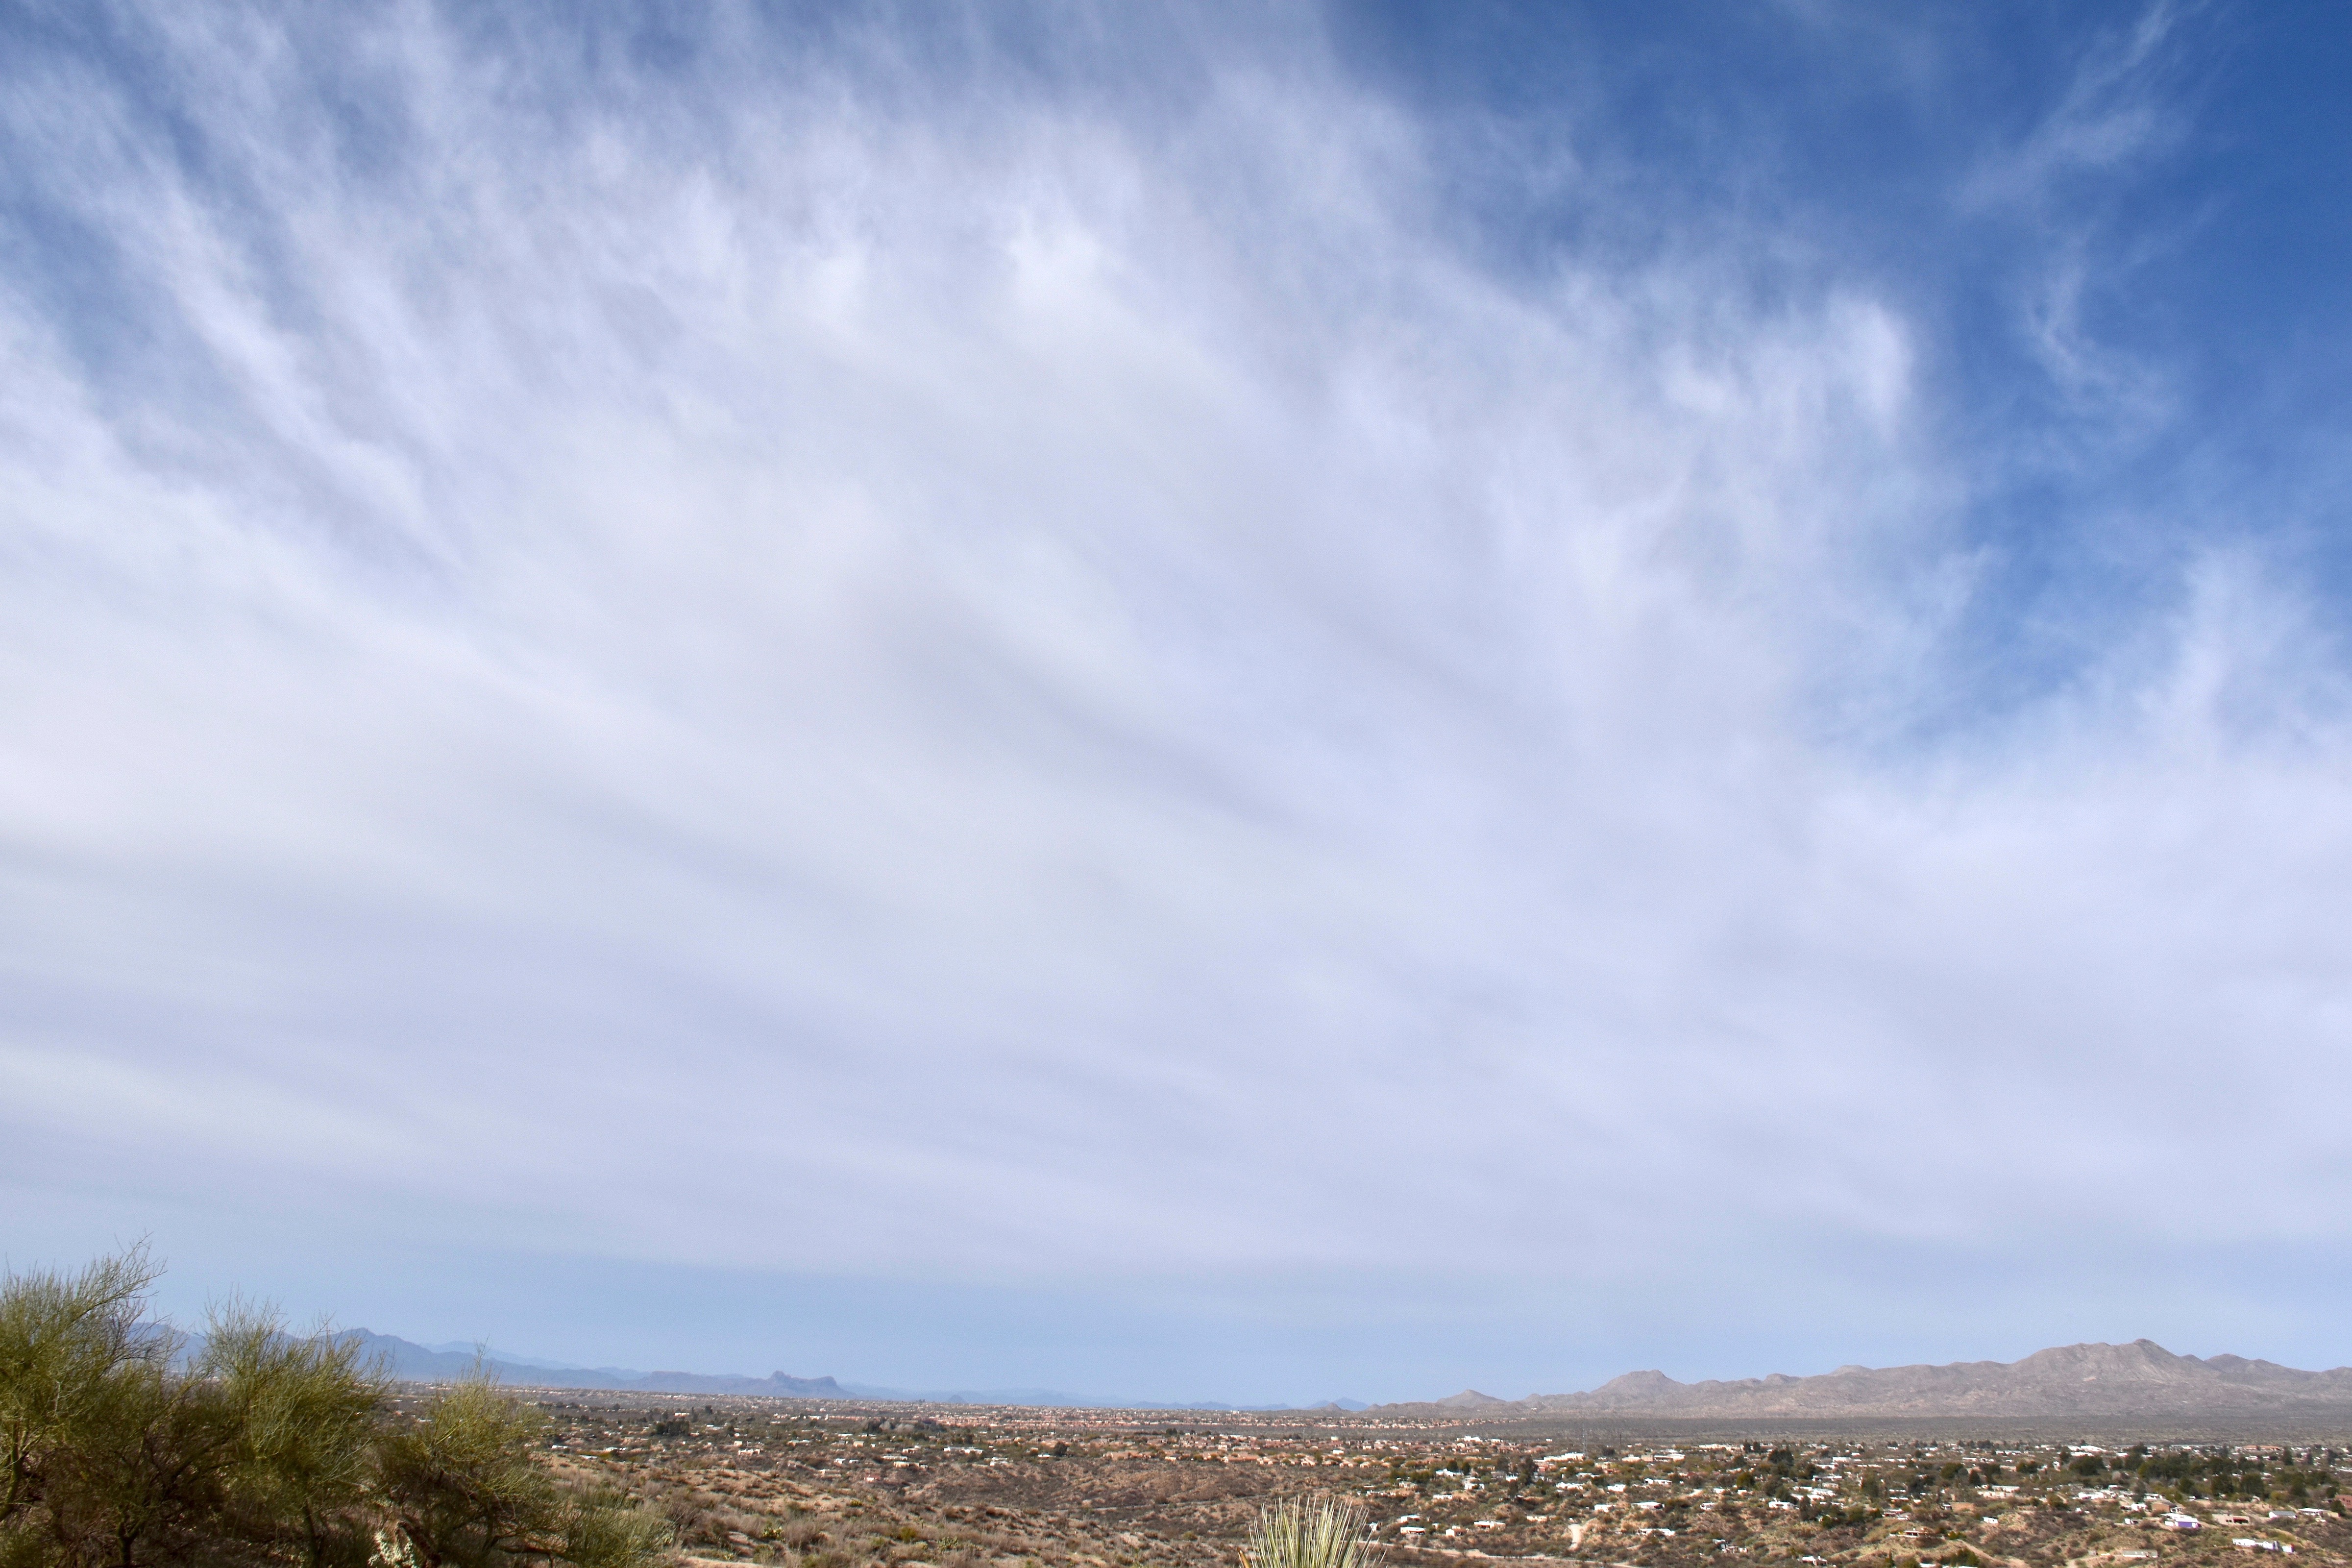
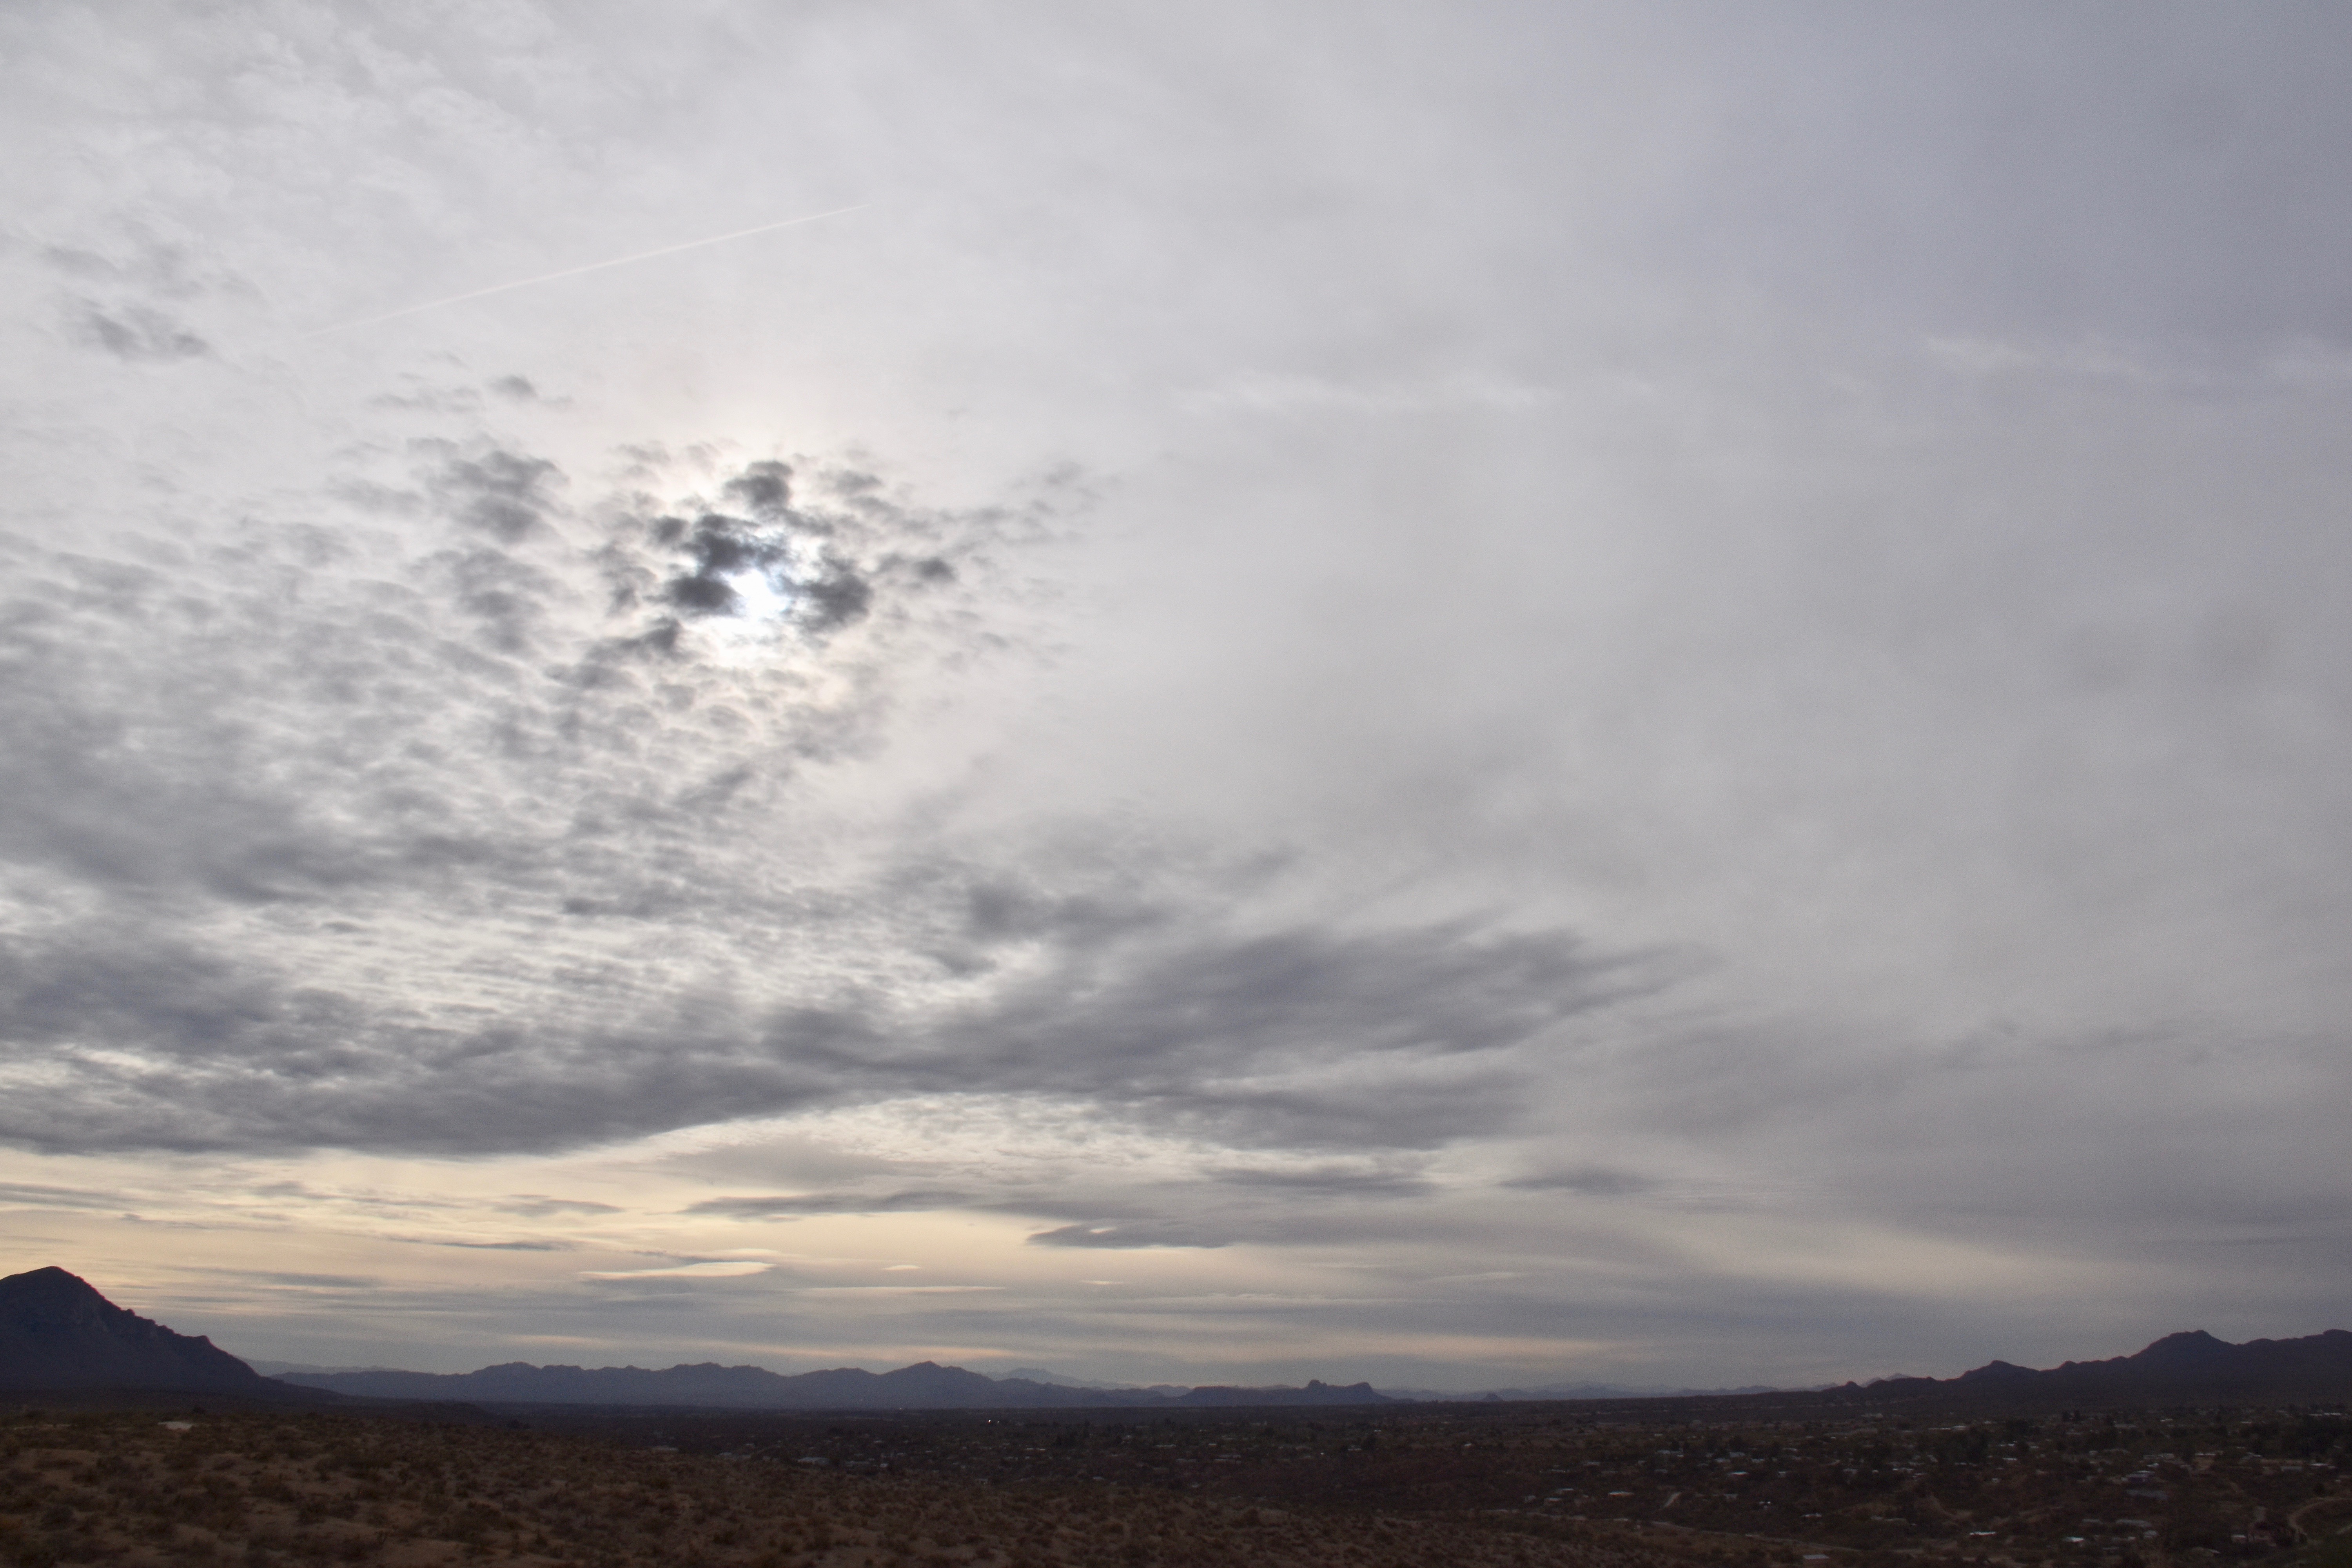
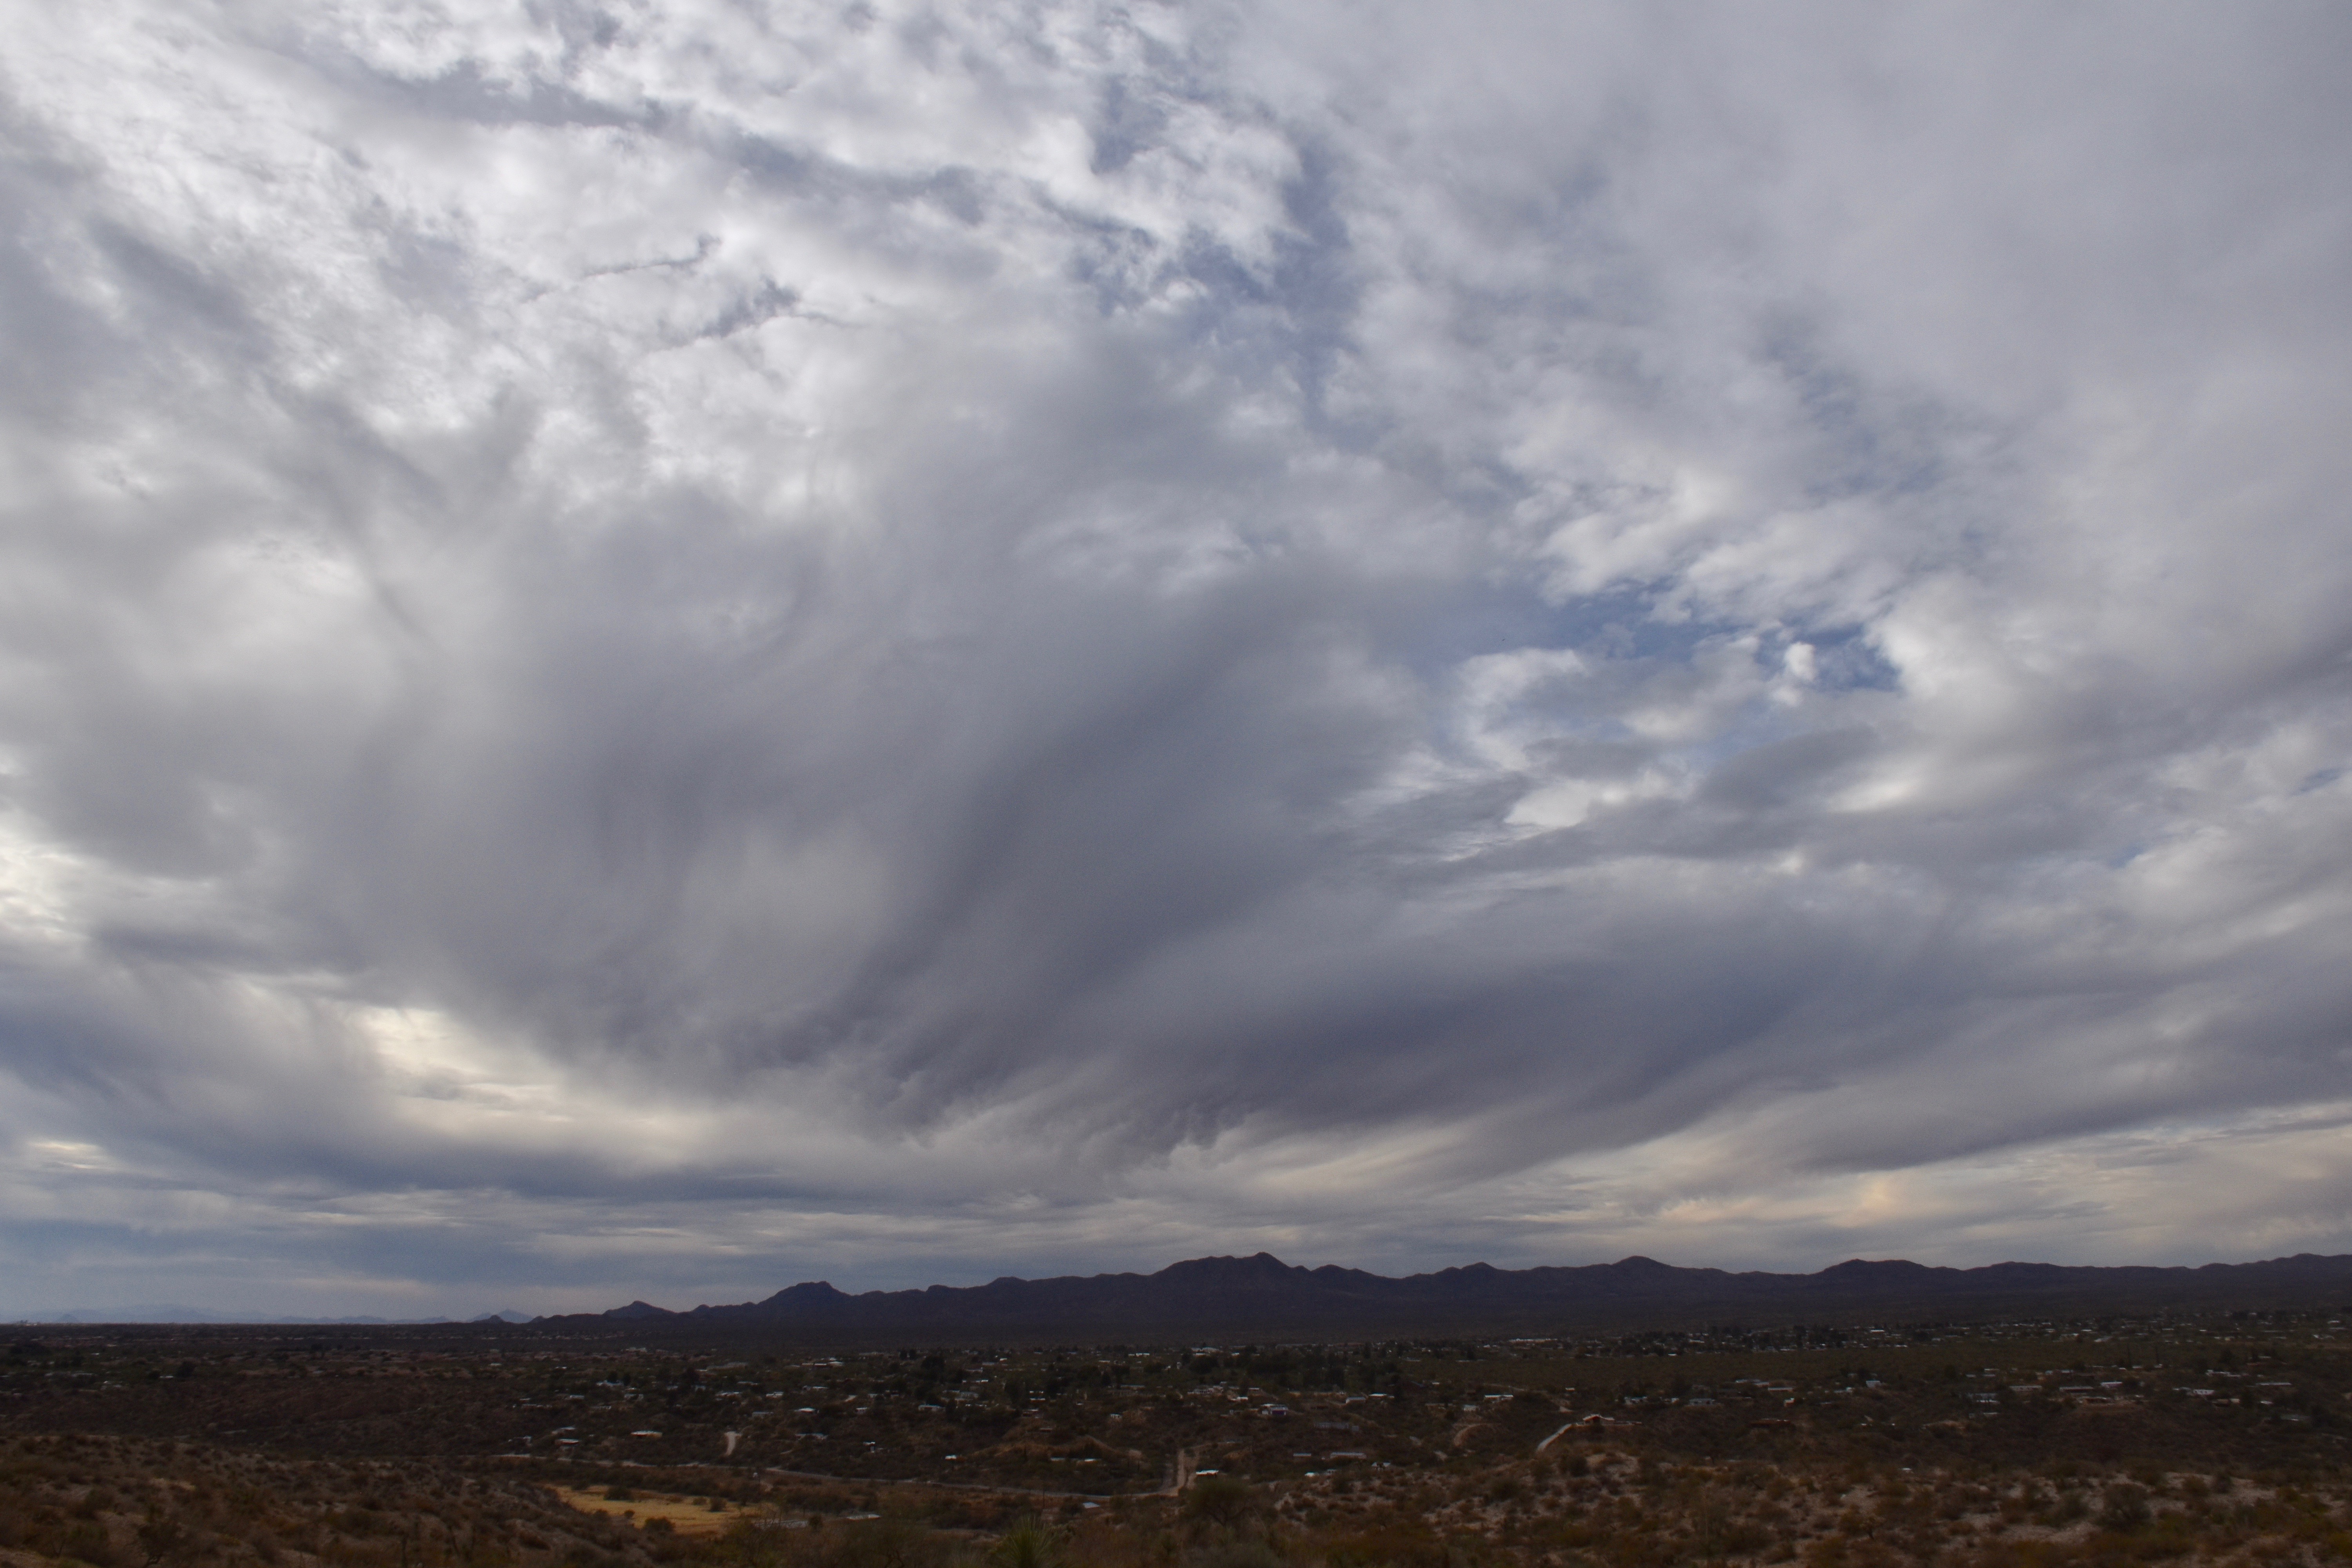
7:58 AM. Massive ice cloud advances on Catalina from the Tropics.
This Altostratus invasion covered the sky within about 15 minutes, and that was it for sun, except some “filtered sun” at times (when this layer is called Altostratus translucidus (the sun’s position can be seen). Its an all ice or mostly ice cloud.
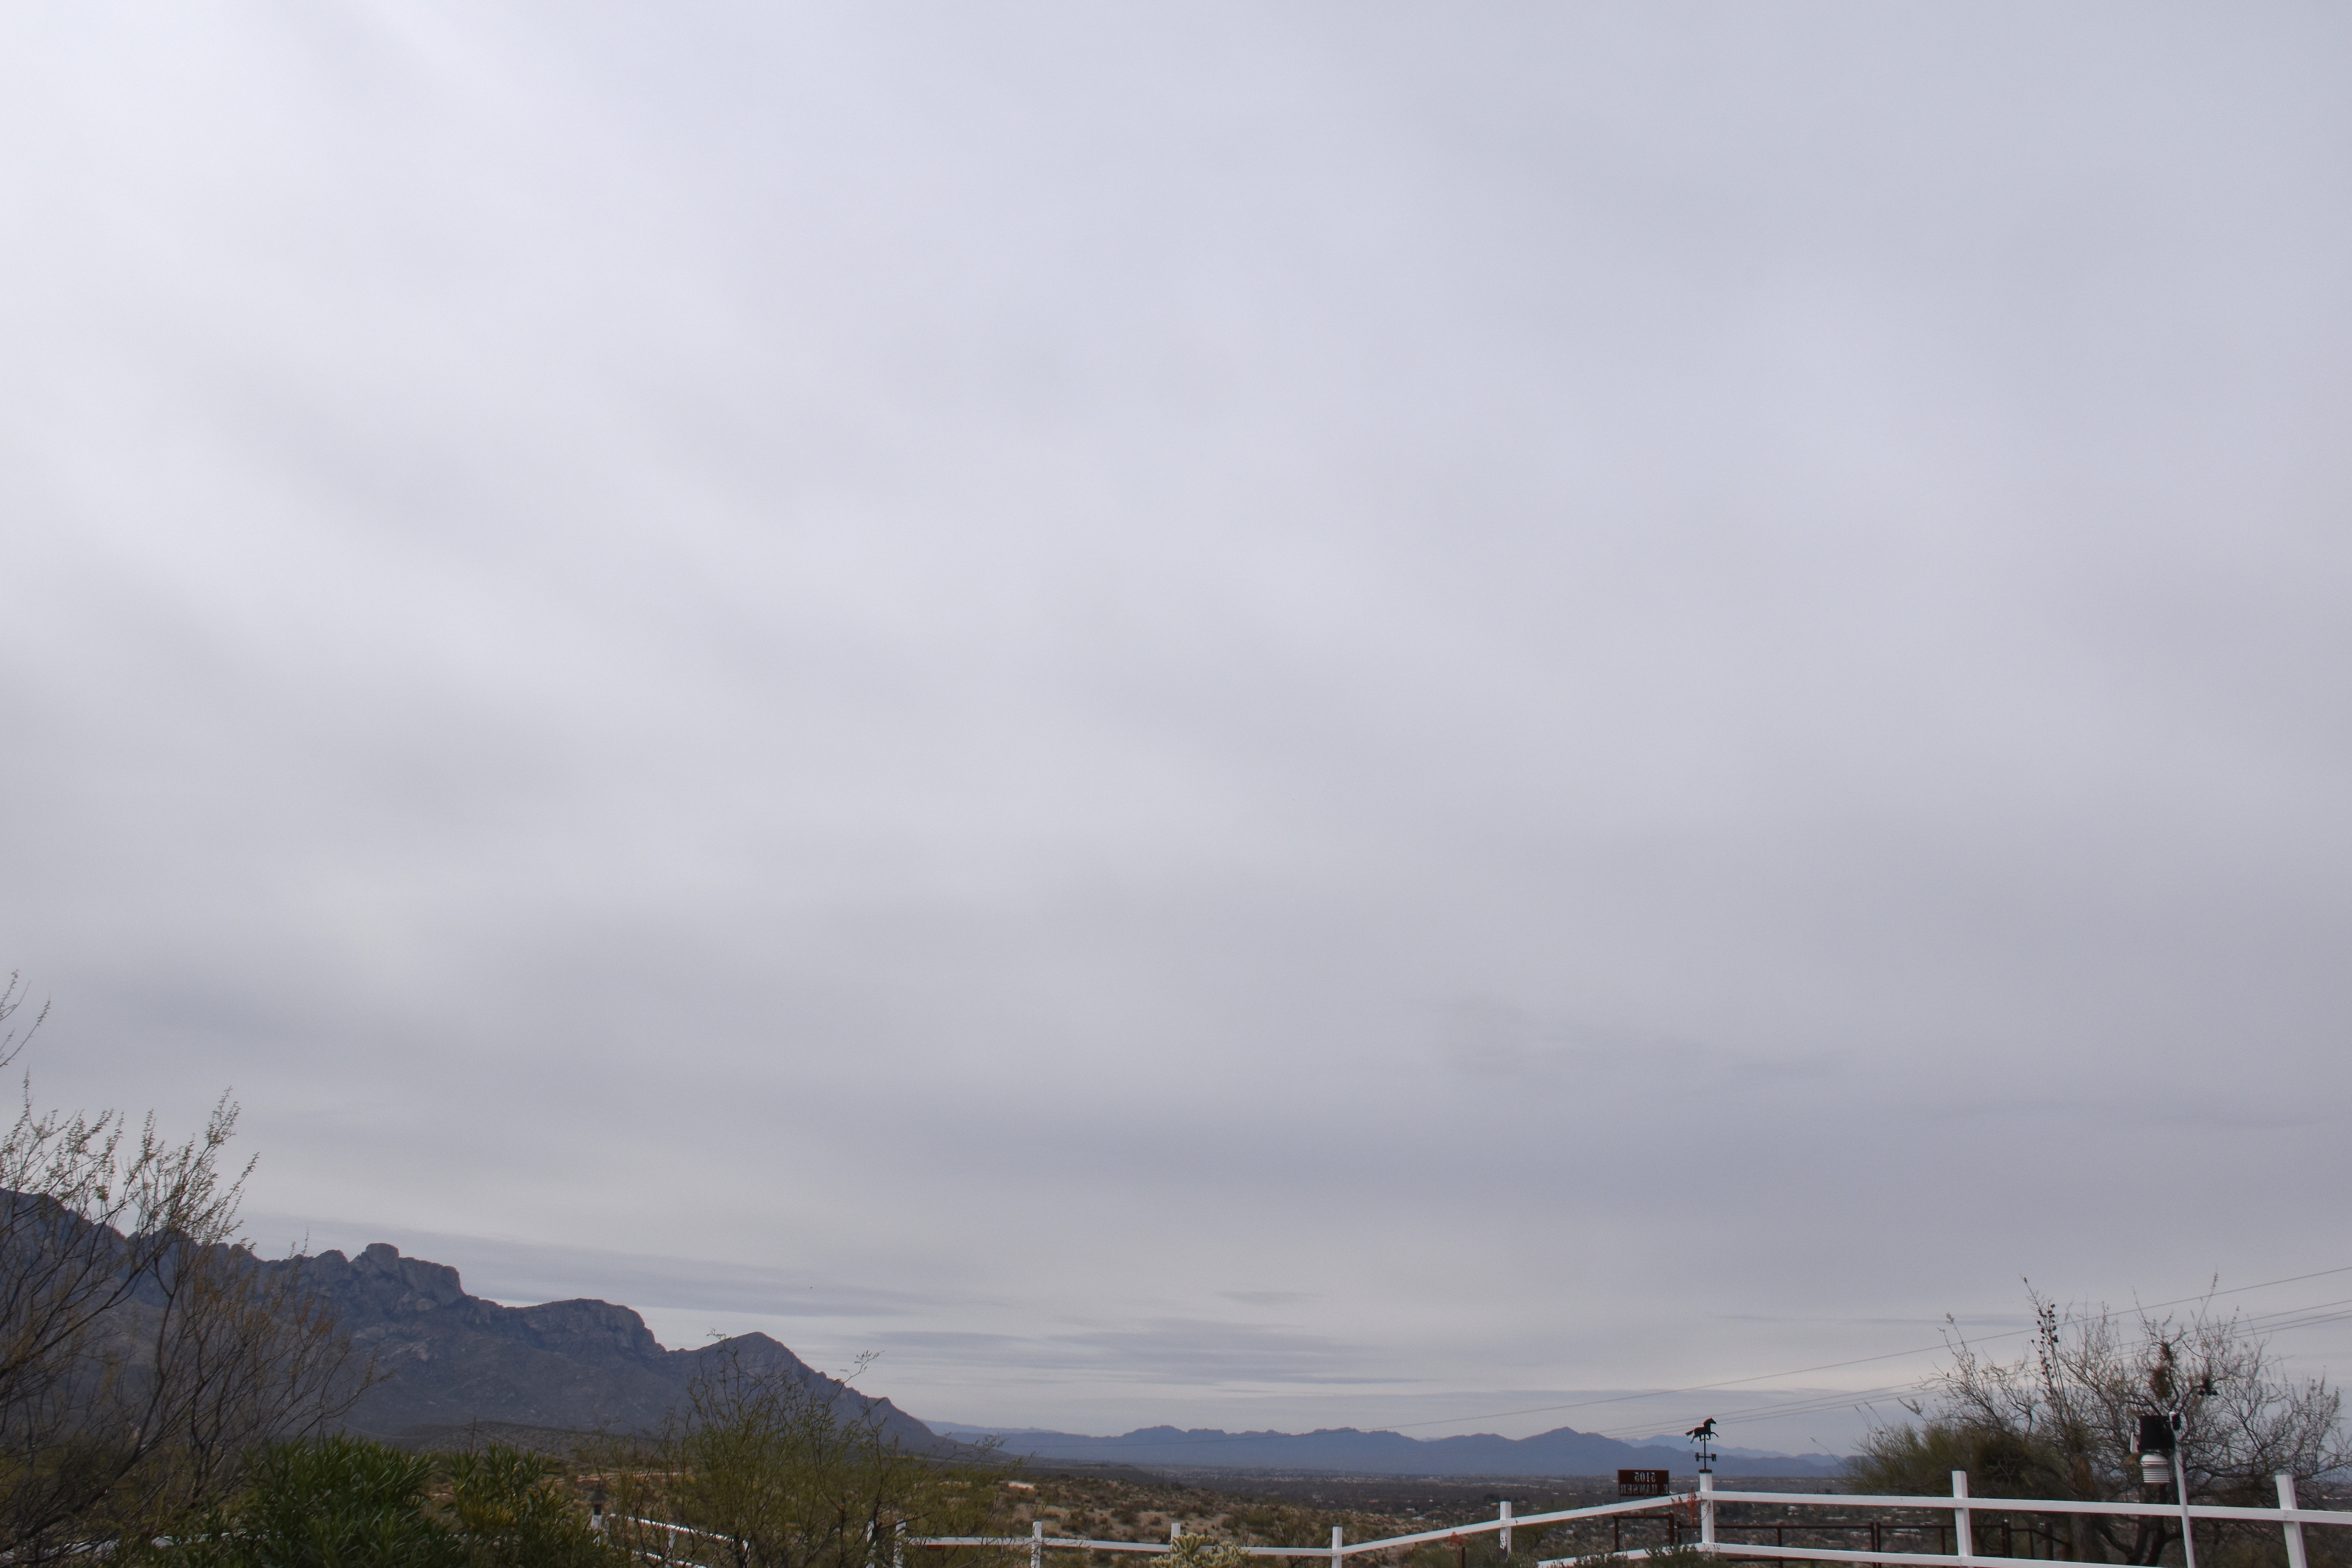
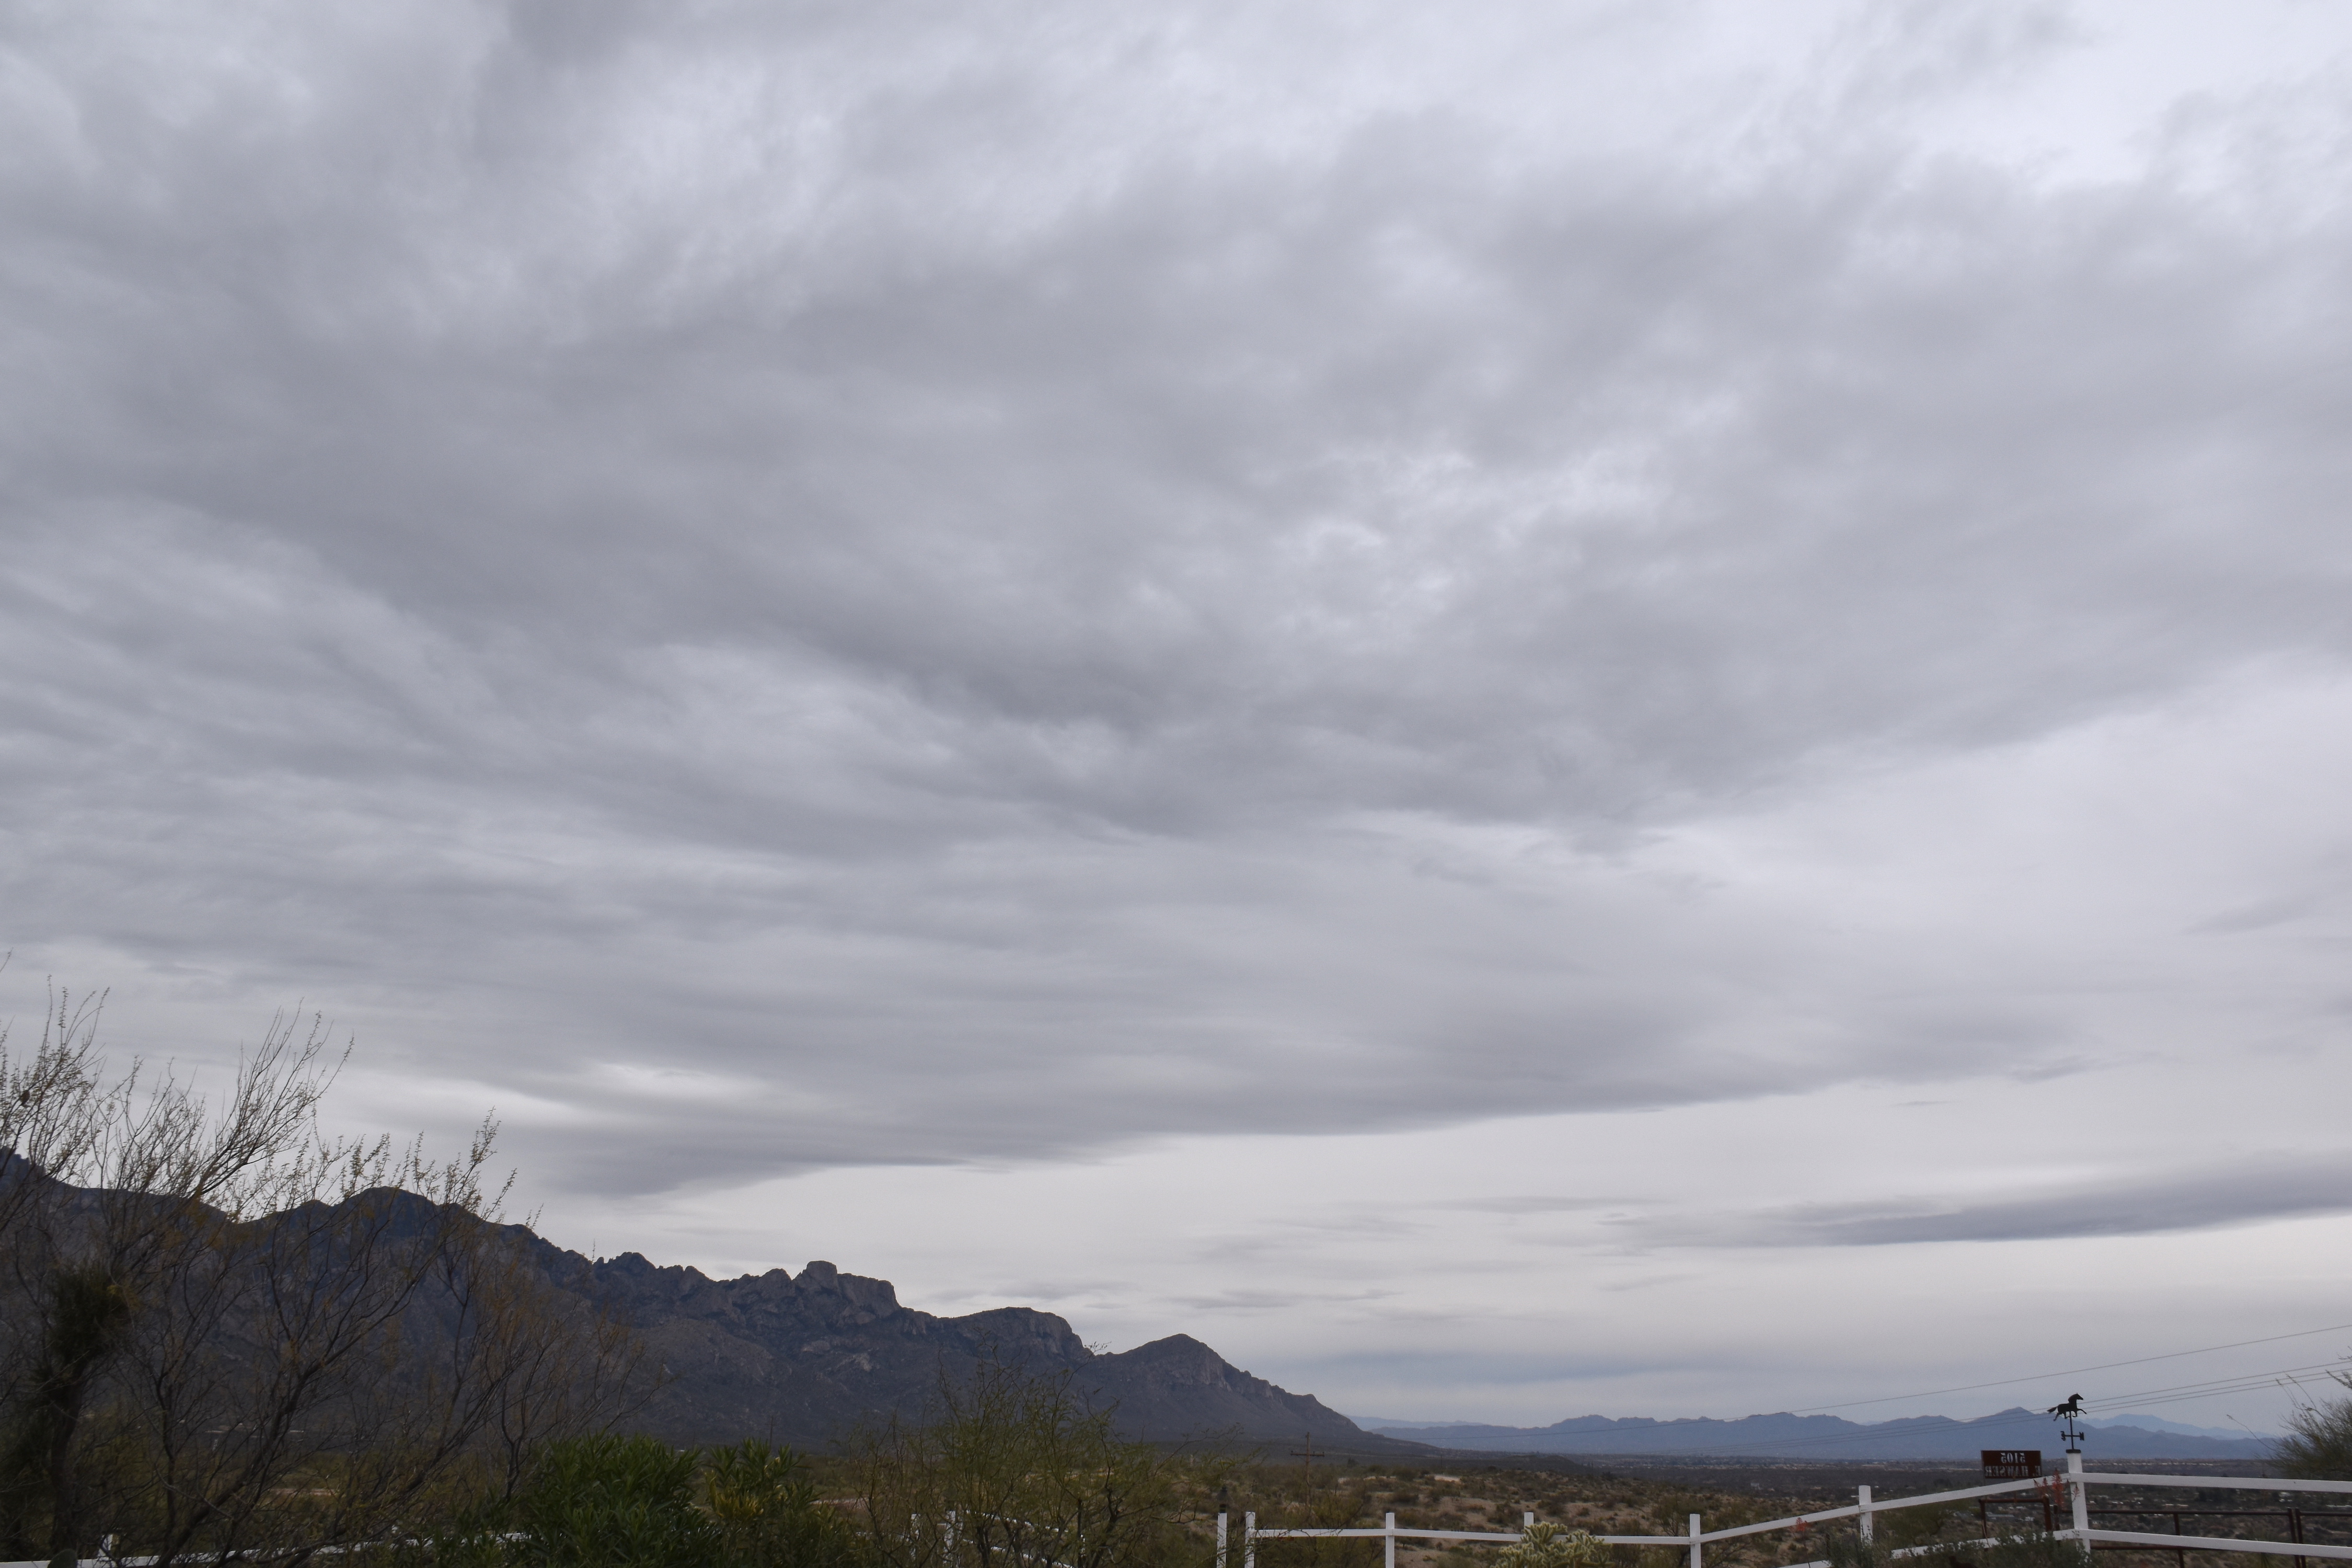
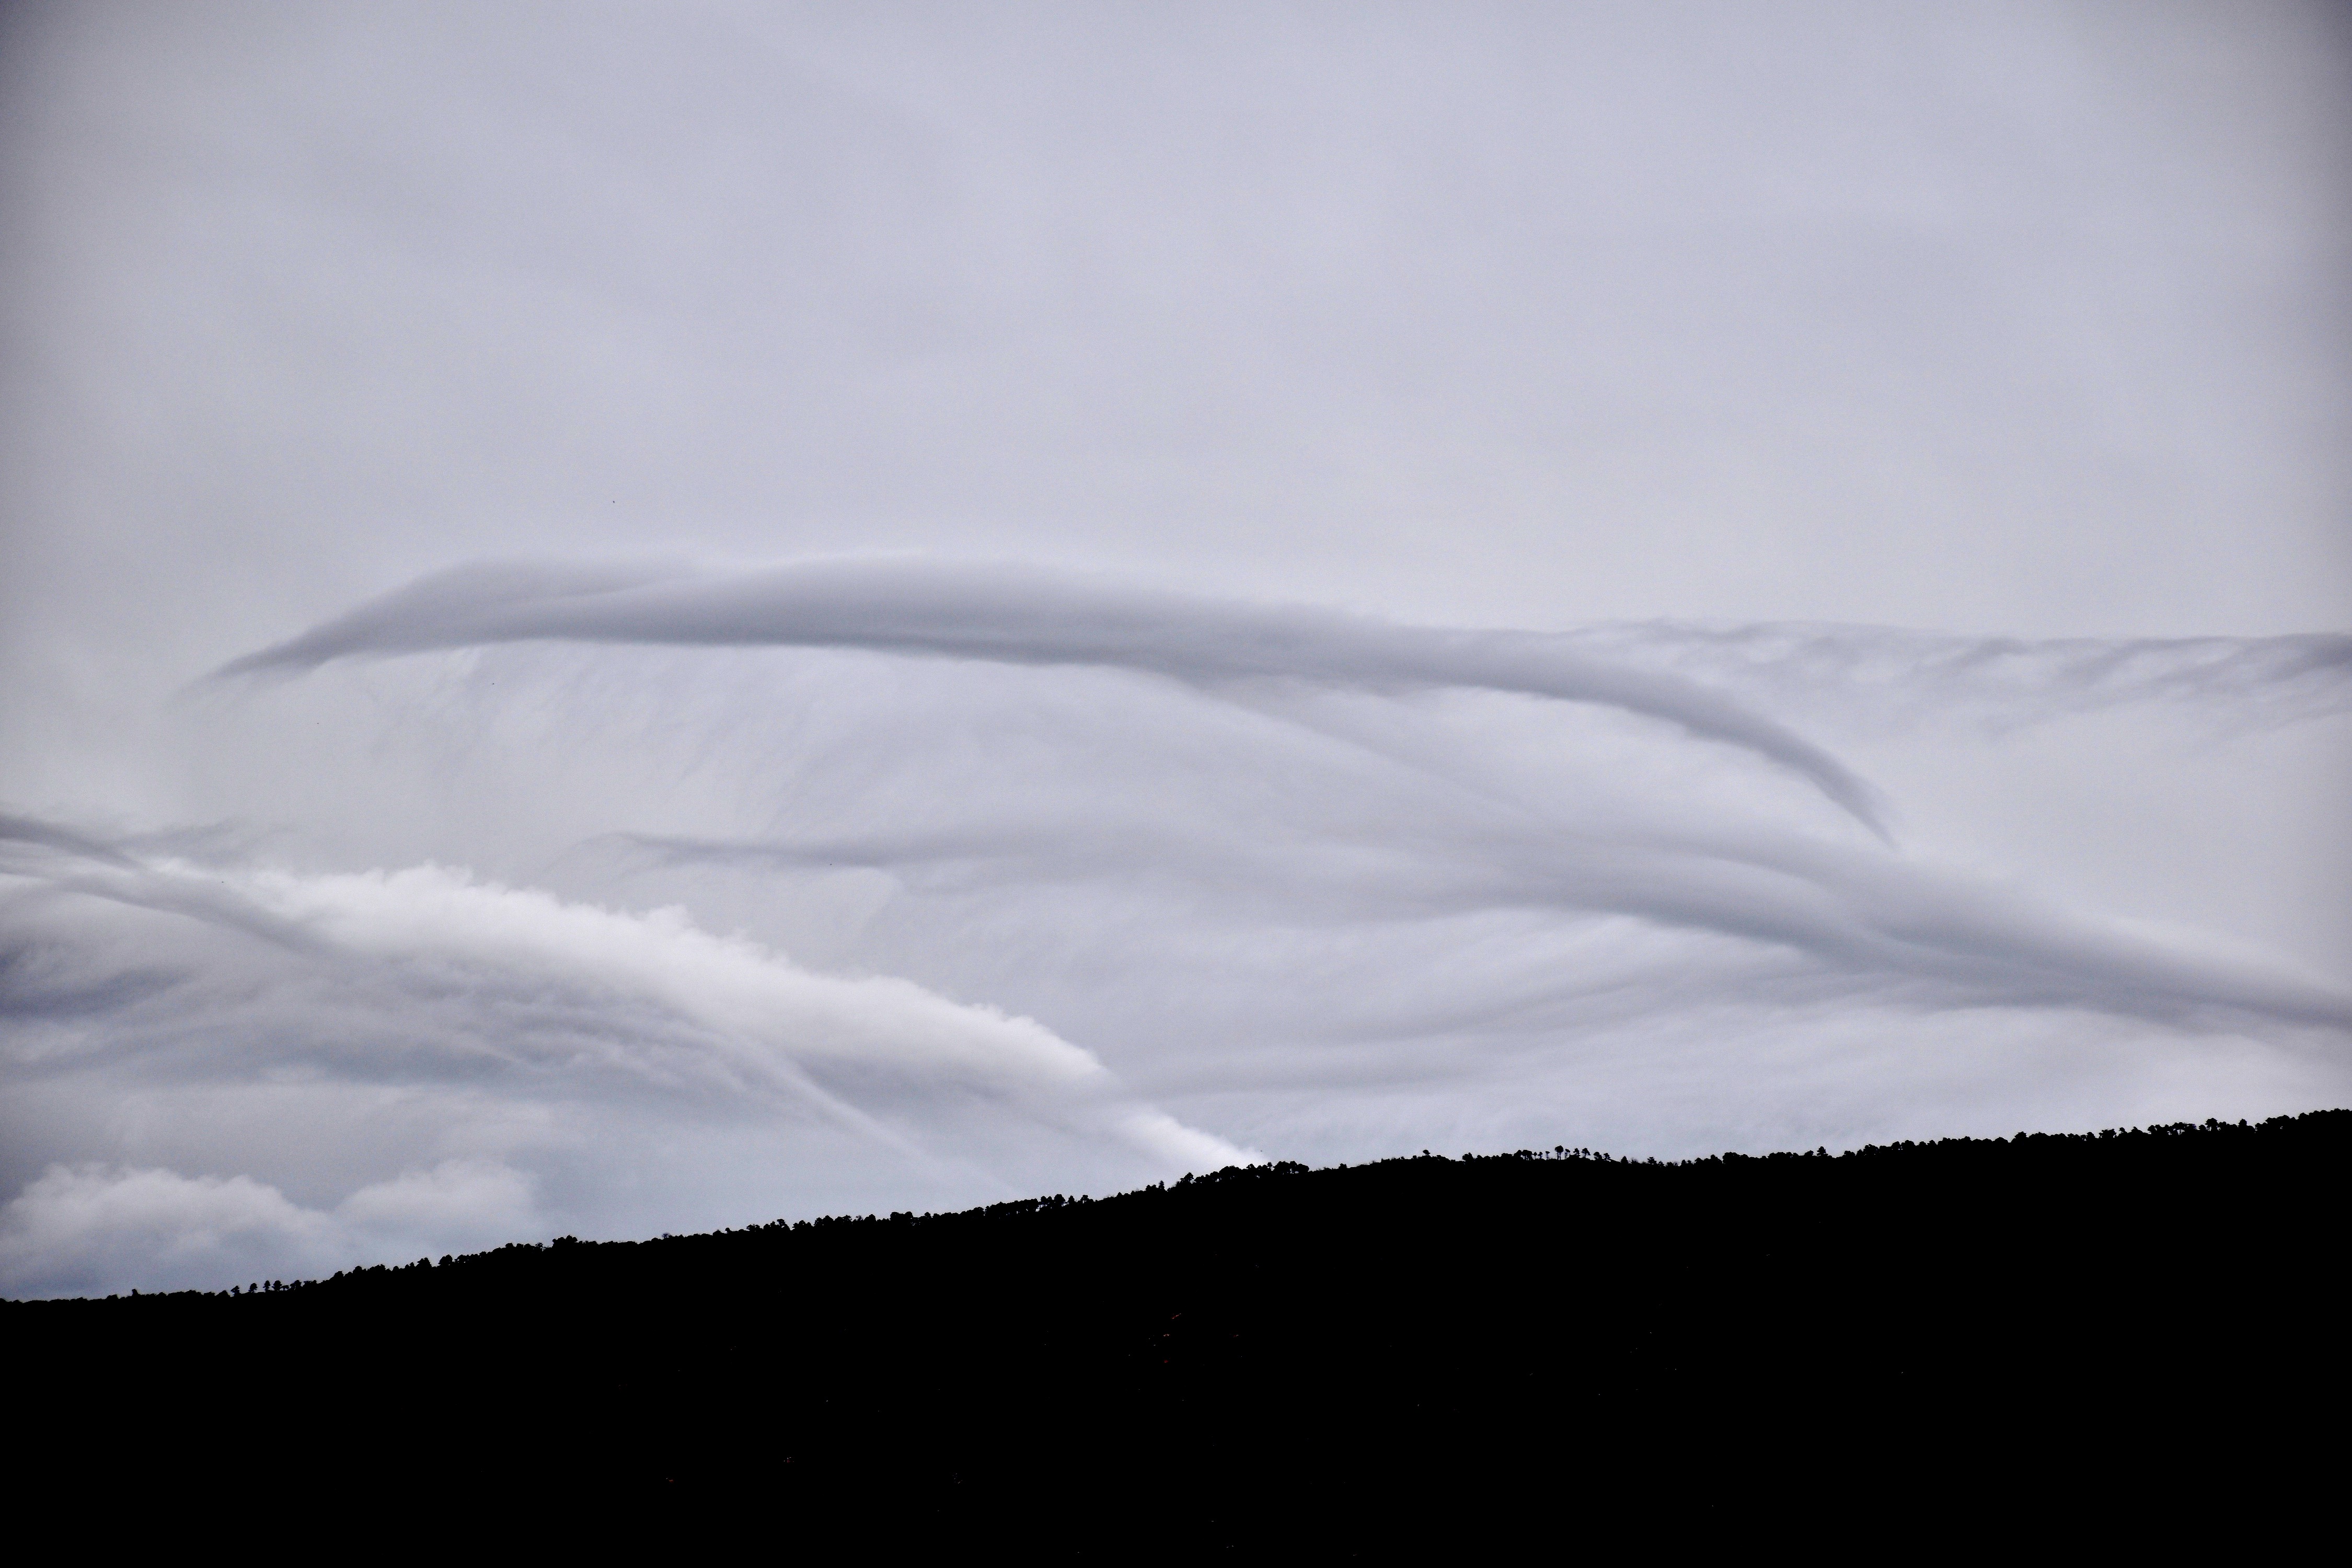
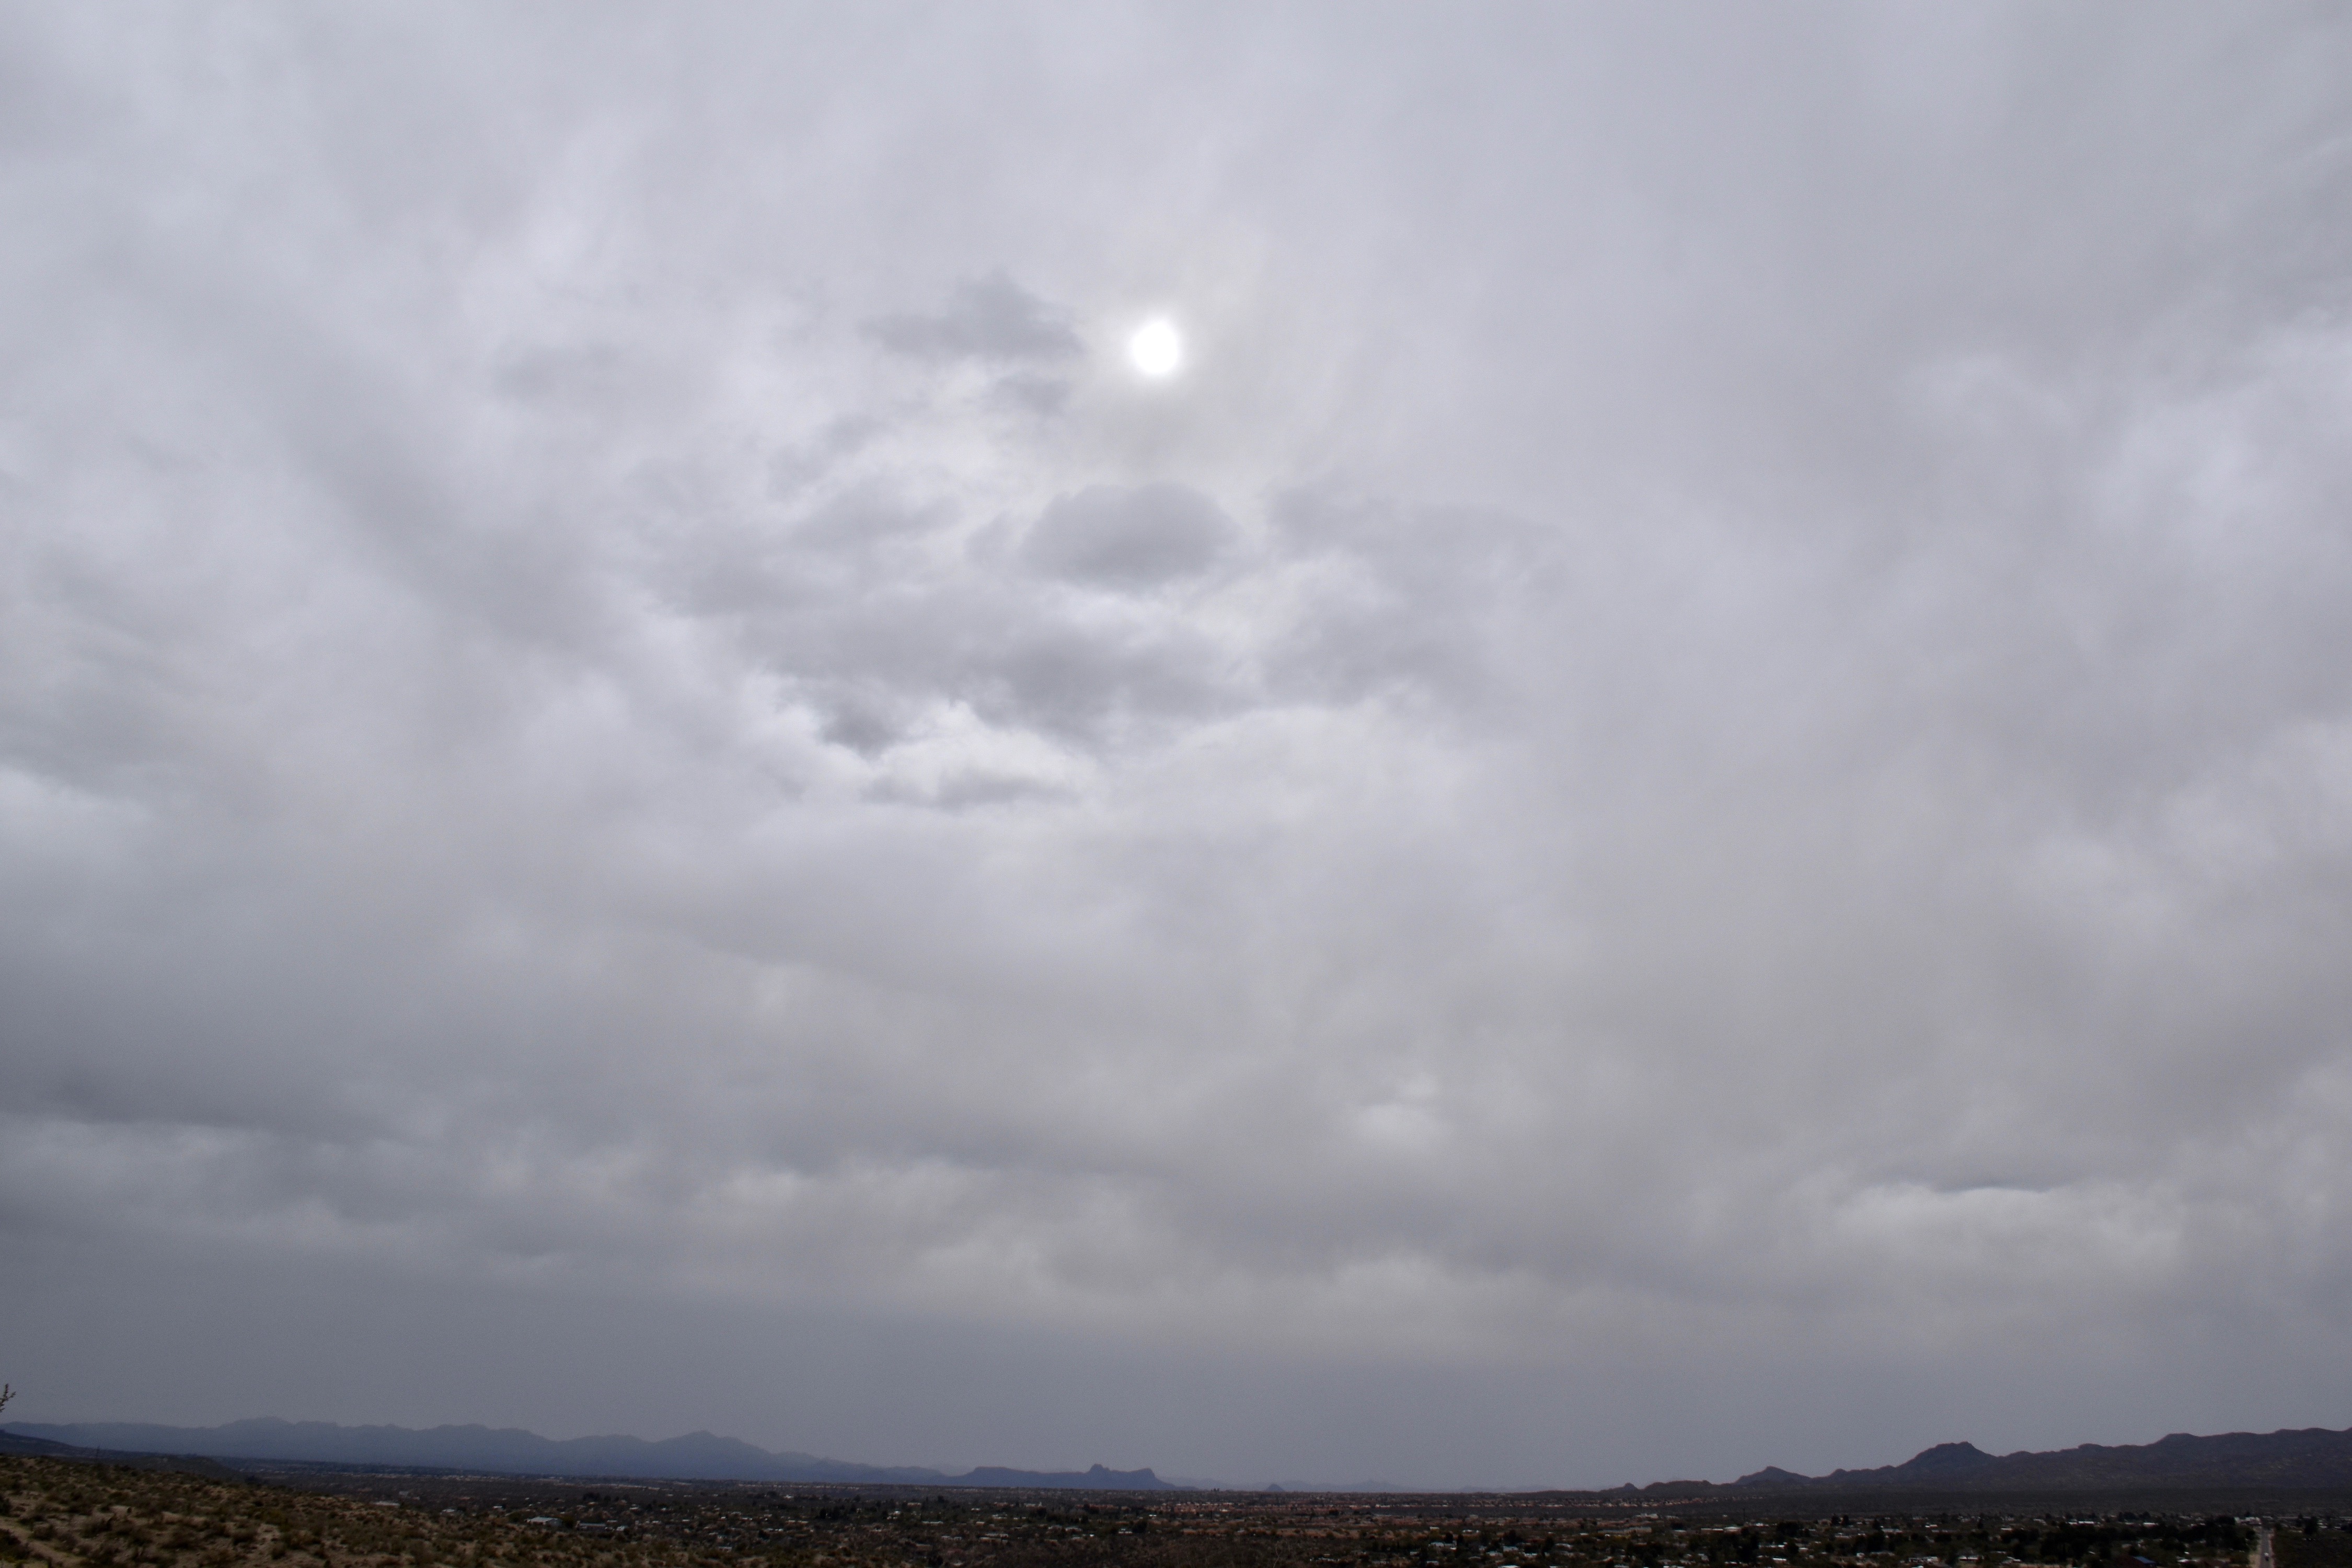
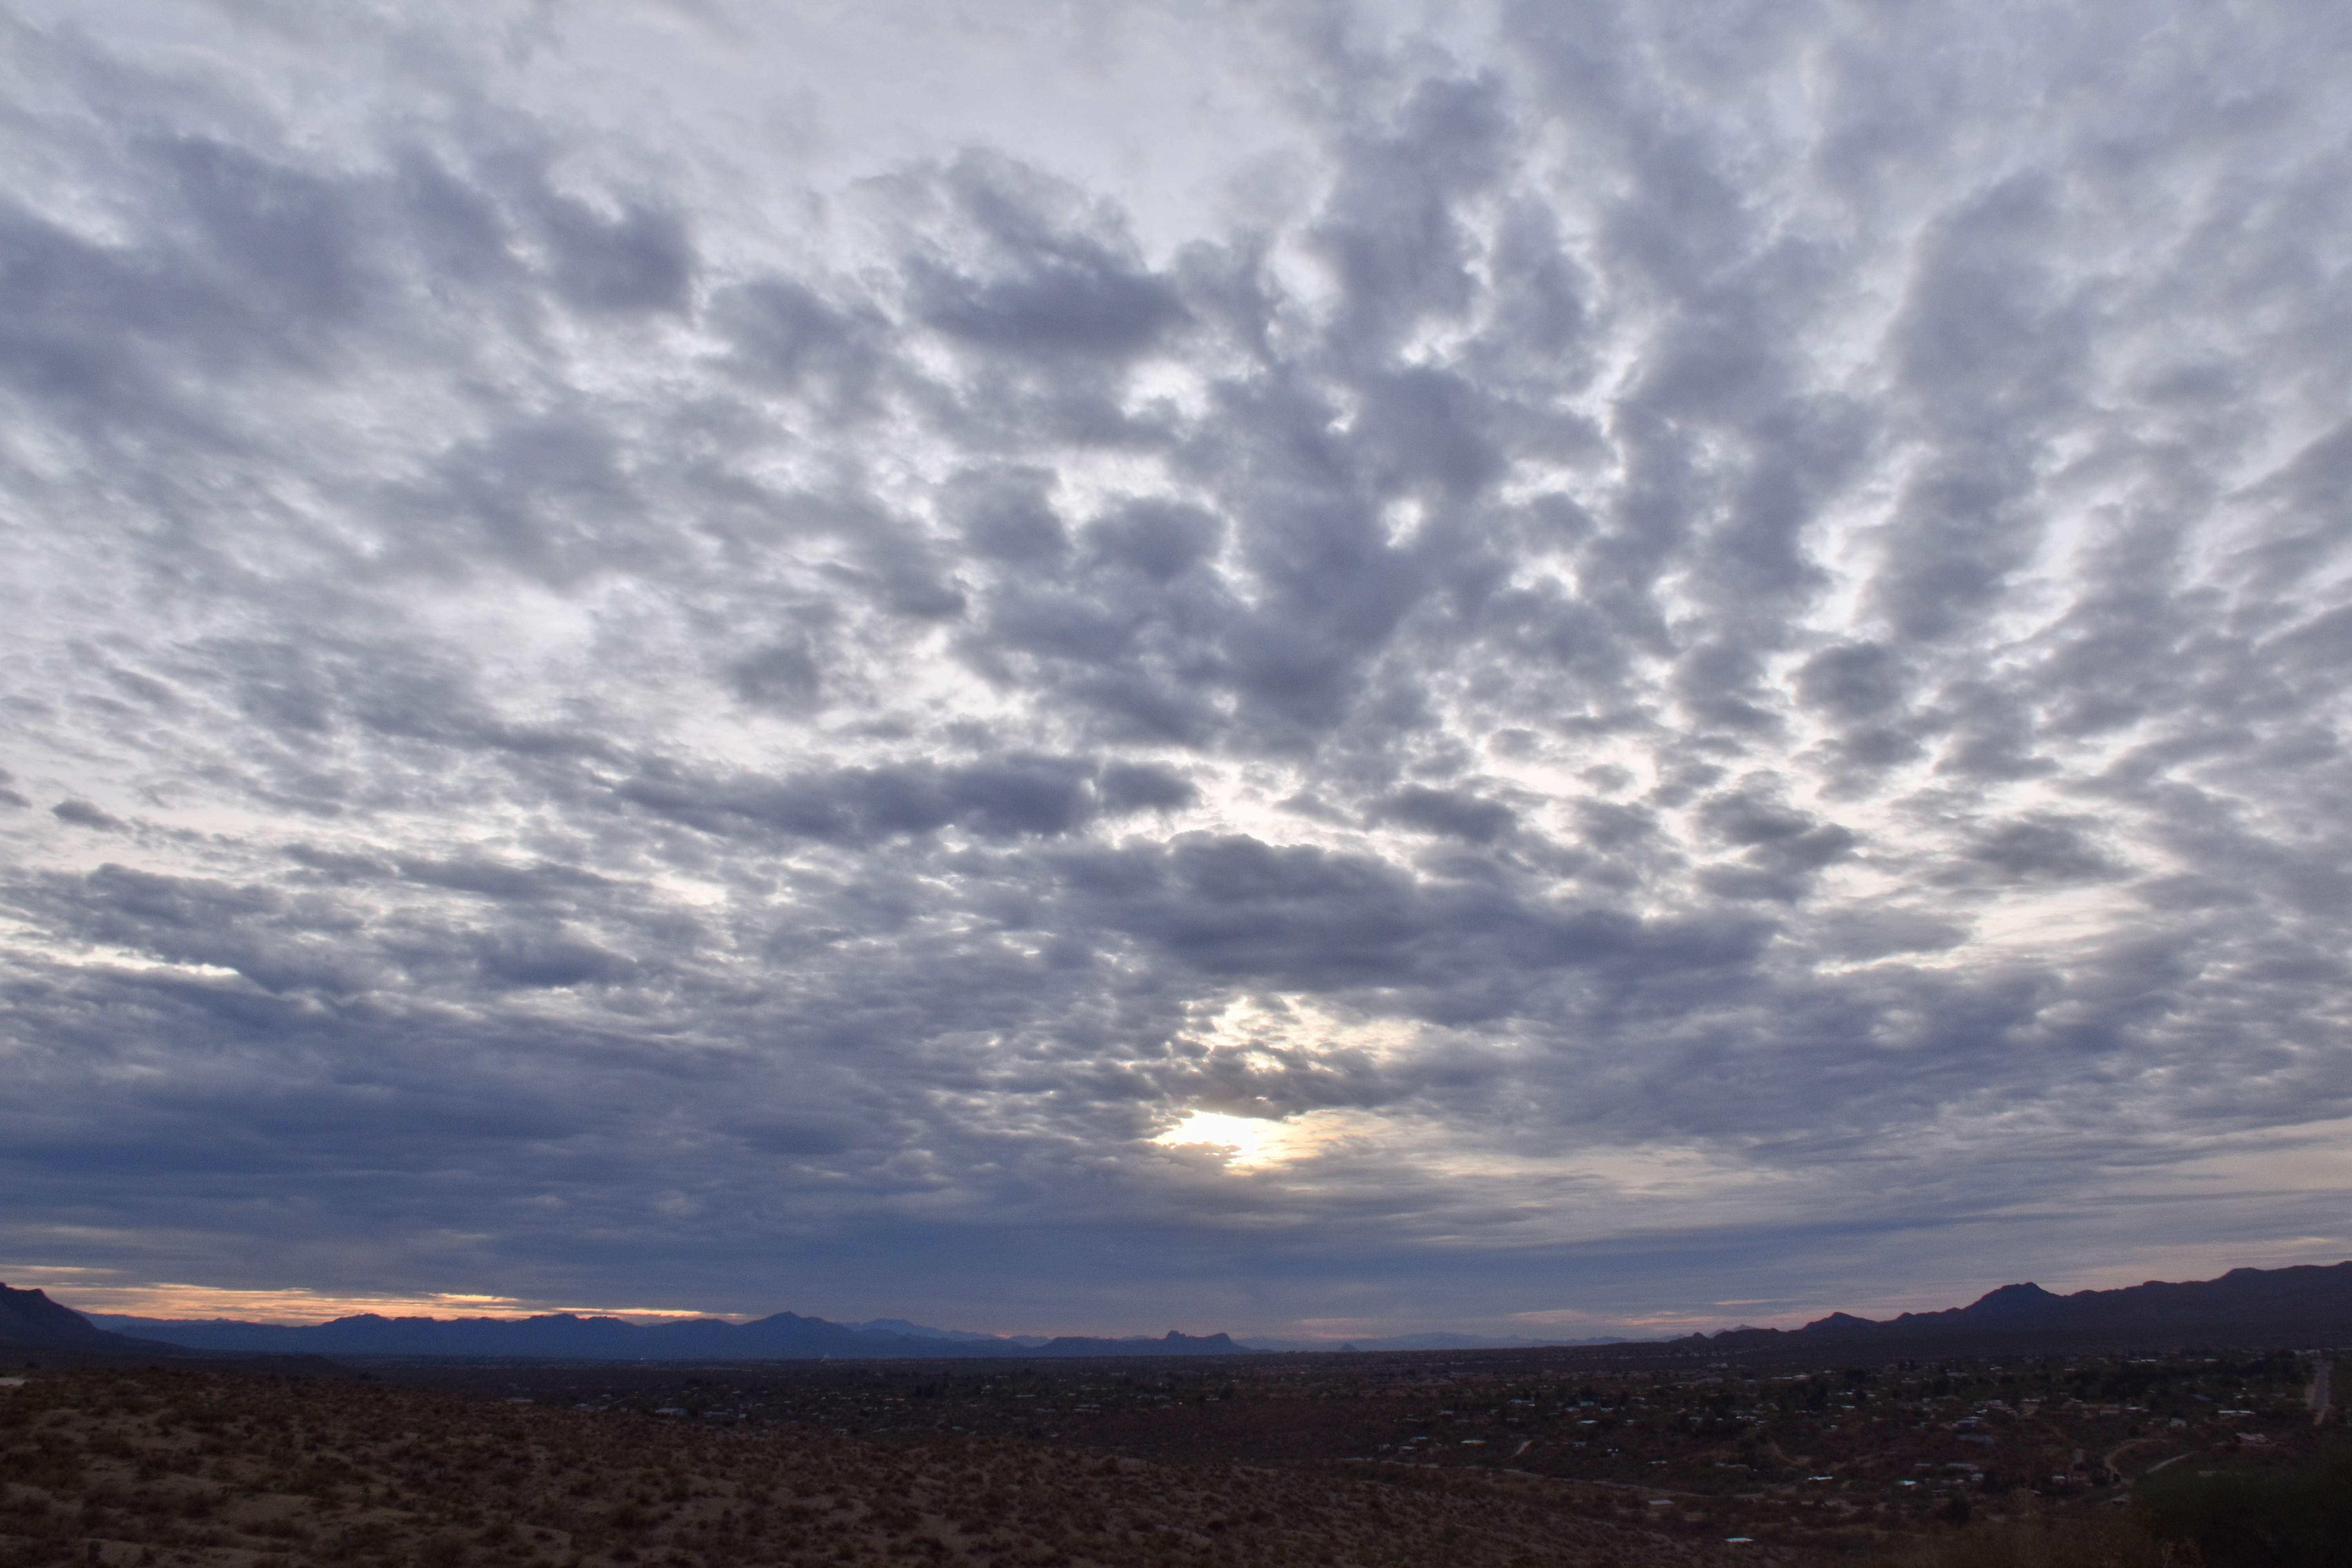
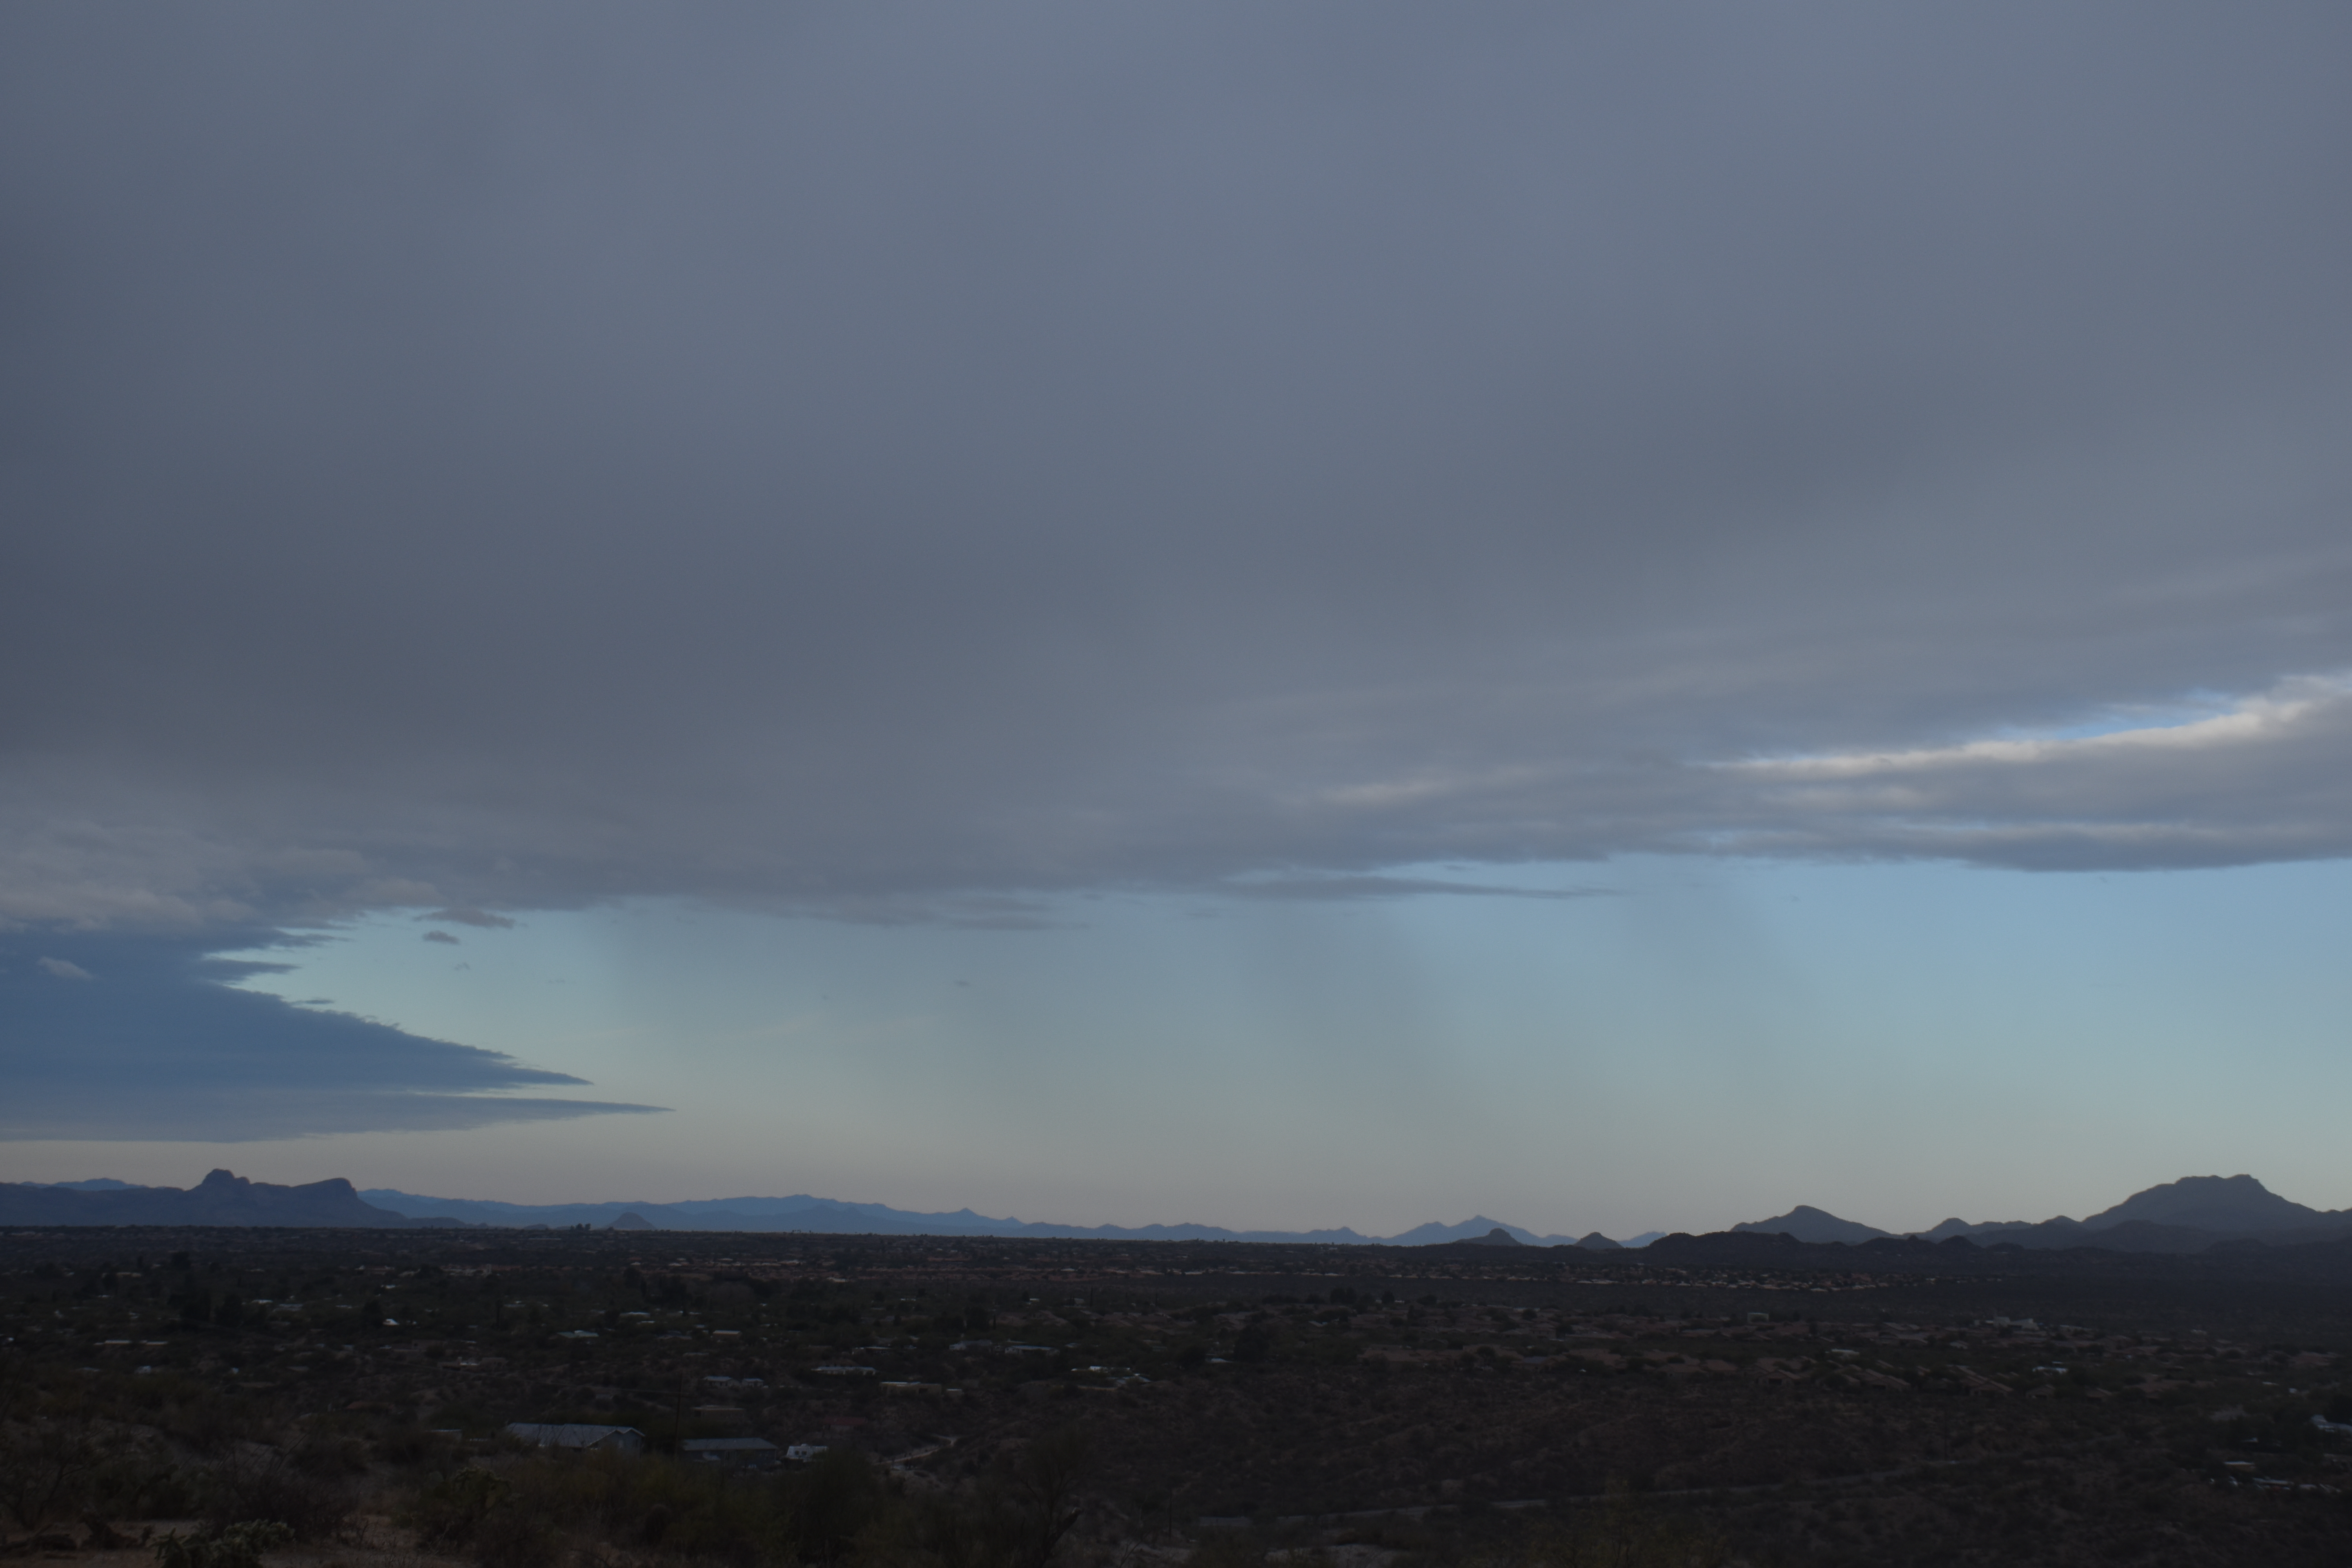
10:58 AM. Altostratus creates a pleasant gray sky.1:26 PM. Lower droplet clouds began to appear, high-based Stratocumulus. The globules are too large to be Altocumulus, though these were based at about 7,000 feet above Catalina, or a little above the height of Ms. Lemmon.1:26 PM. A UFO appears to be soaring toward Catalina with some kind with a trailing spider web. Other lenticular can be seen, this one was truly out of this world. But, from where? What world?1:41 PM. More lenticulars; more shades of gray.3:36 PM. Altostratus is now transitioning to Nimbostratus with lower bases as steady, but very light rain, moves in toward Twin Peaks. What you’re looking at here is mostly virga, and, as the relative humidity increases below virga bases, the virga is able to drop to lower elevations. The humidity is increasing due to gradually rising air that is accompanying an upper level trough. Got pretty wind about this time, too, before calming down. Not sure what that was from except maybe virga falling into very dry air ahead of the rain.3:42 PM. Classic look of Altostratus translucidus. “Opacus” (too thick to see the sun), just ahead. Those darkest areas near the sun are droplet clouds. Most of the scene is ice cloud.4:16 PM. Finally, as very light rain began to fall, we now see the most perfect view of Nimbostratus you’ll ever see. I hope you took plenty of shots of this scene cloud maven juniors! (Nimbostratus, the deep, deep cloud producing steady rain and snow is almost ALWAYS partly or totally obscured by lower Stratocumulus clouds so you can’t really see it. But, not here!
The weather ahead
Pretty much a sure-thing rain (we, unprofessionally forecast at least a 90-100% chance of measurable rain then) will move in late on the 16th or on the 17th. Should be a significant, vegetation-boosting rain, too–by that I mean at least a quarter of an inch–unlike this rain this morning. It looks,. too, like a second rain might move in a day or two after that one. Quite strong support in the ensembles (“spaghetti plots”) for that to happen, too. How great would that be? Very great, of course.
After that, the models are showing even more troughs affecting AZ, but the ensembles aren’t sure about it. Neither am I (CMP).
High cold ones that are headed this way in a curvilinear path. Image was made at 5 AM AST, annotation later.
That means that a deep Altostratus overcast will be in place by tomorrow with a load of virga and sprinkles, not really much rain since the bases will also be cold and…high. Top possible rain amount from these high cold ones is a tenth of an inch, but more likely will be traces. Chance of a trace in the area? Oh, about 99% IMO.
But that’s not our full rain destiny.
On the horizon, only a week from now, is the likelihood of a significant rain. Check the models and the spaghetti:
Valid at 5 PM AST, March 16th. You don’t need the precip prediction for this day when the 500 millibar pattern is like this, the core of the wind at that level south of Tucson. Its not a sufficient criterion for rain, but a necessary one in the cool half of the year. (Only about 5% of the rain in TUS falls outside of this criterion in the cool half of the year.
Here’s the rain prediction which I have not looked at until posting now to make the point you don’t need to look at it:
Where the model thinks it will have rained in the 6 h prior to 5PM AST on March 16th. I hope you’re happy now.Valid at 5 PM AST March 16th. Blueish lines of cold and rain (546 decameter geopotential height contours) way down the Cal coast, and somewhat bunched (confidence indicator) for a major trough to affect all of Arizona, keep the current greening underway.
Would say the chances of measurable rain from this “incoming” are at least 90%; i. e., virtually certain. (Note that “virtually certain” is not the same as 100% certain, but its damn close.)
Problems with hoster and connections to hoster continue–must wait seconds to see what I’ve typed, then have to go back and correct the gibberish. So, not doing much as a result.
But here are a couple of cloud shots from yesterday anyway:
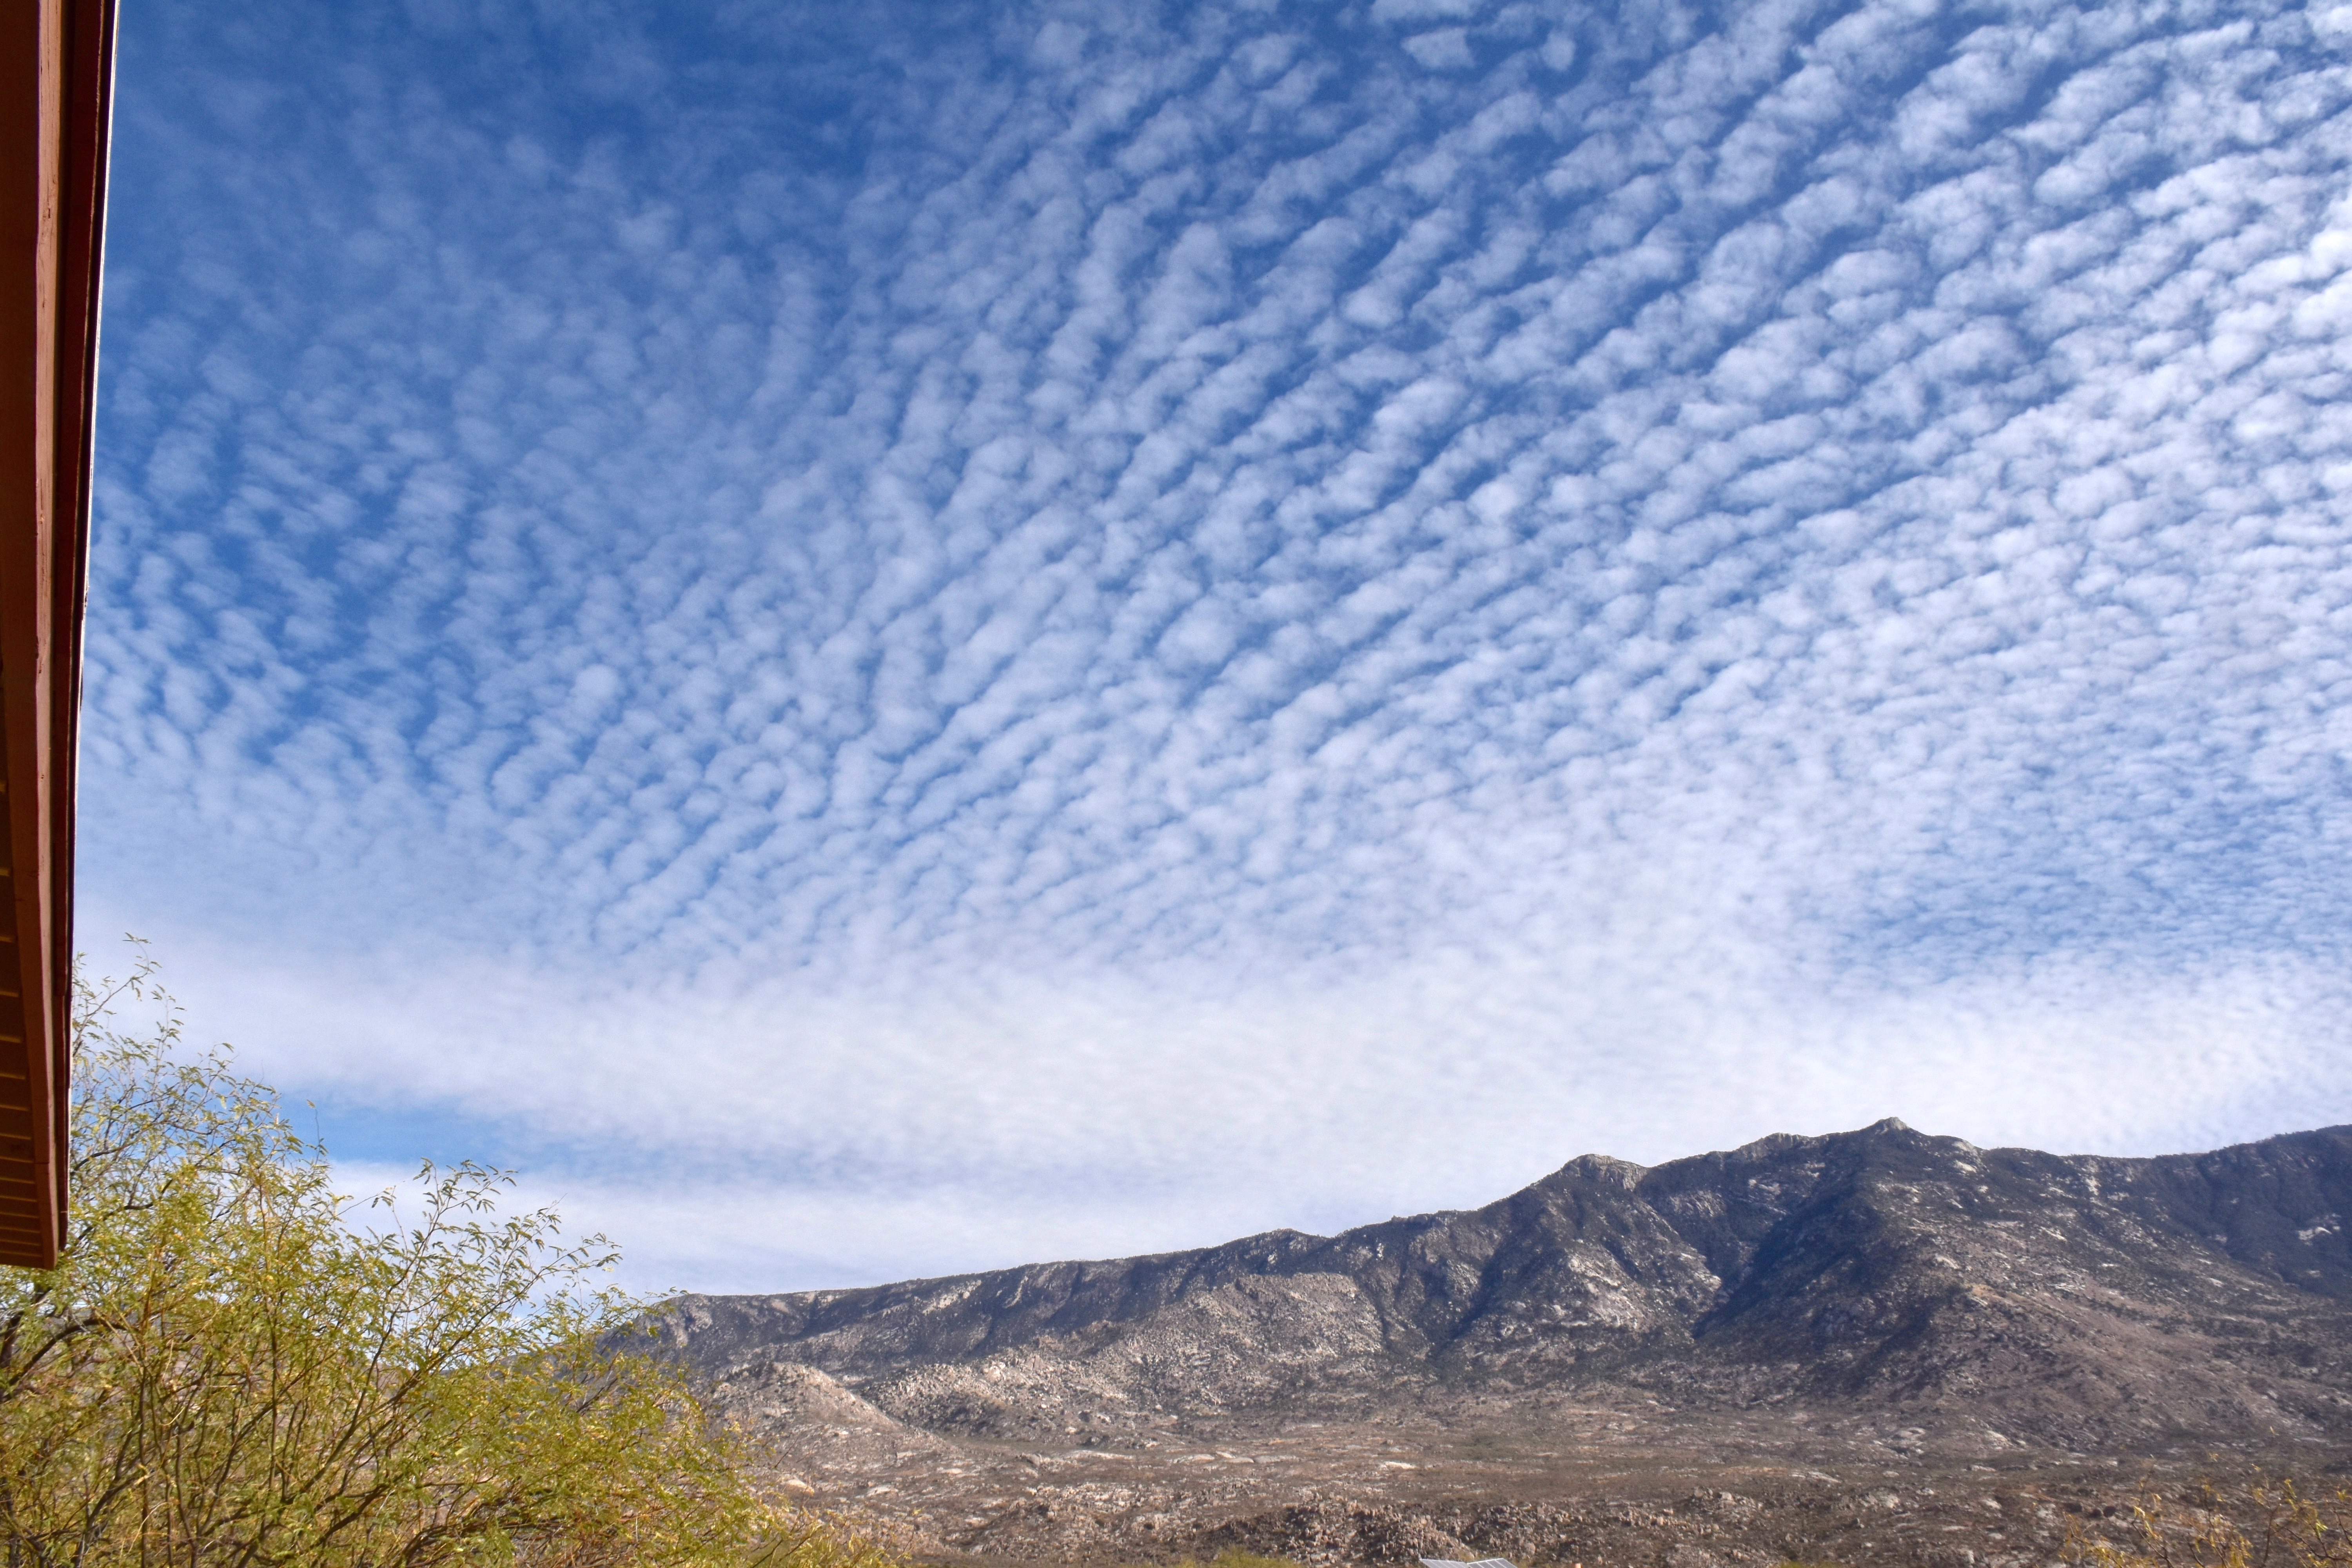
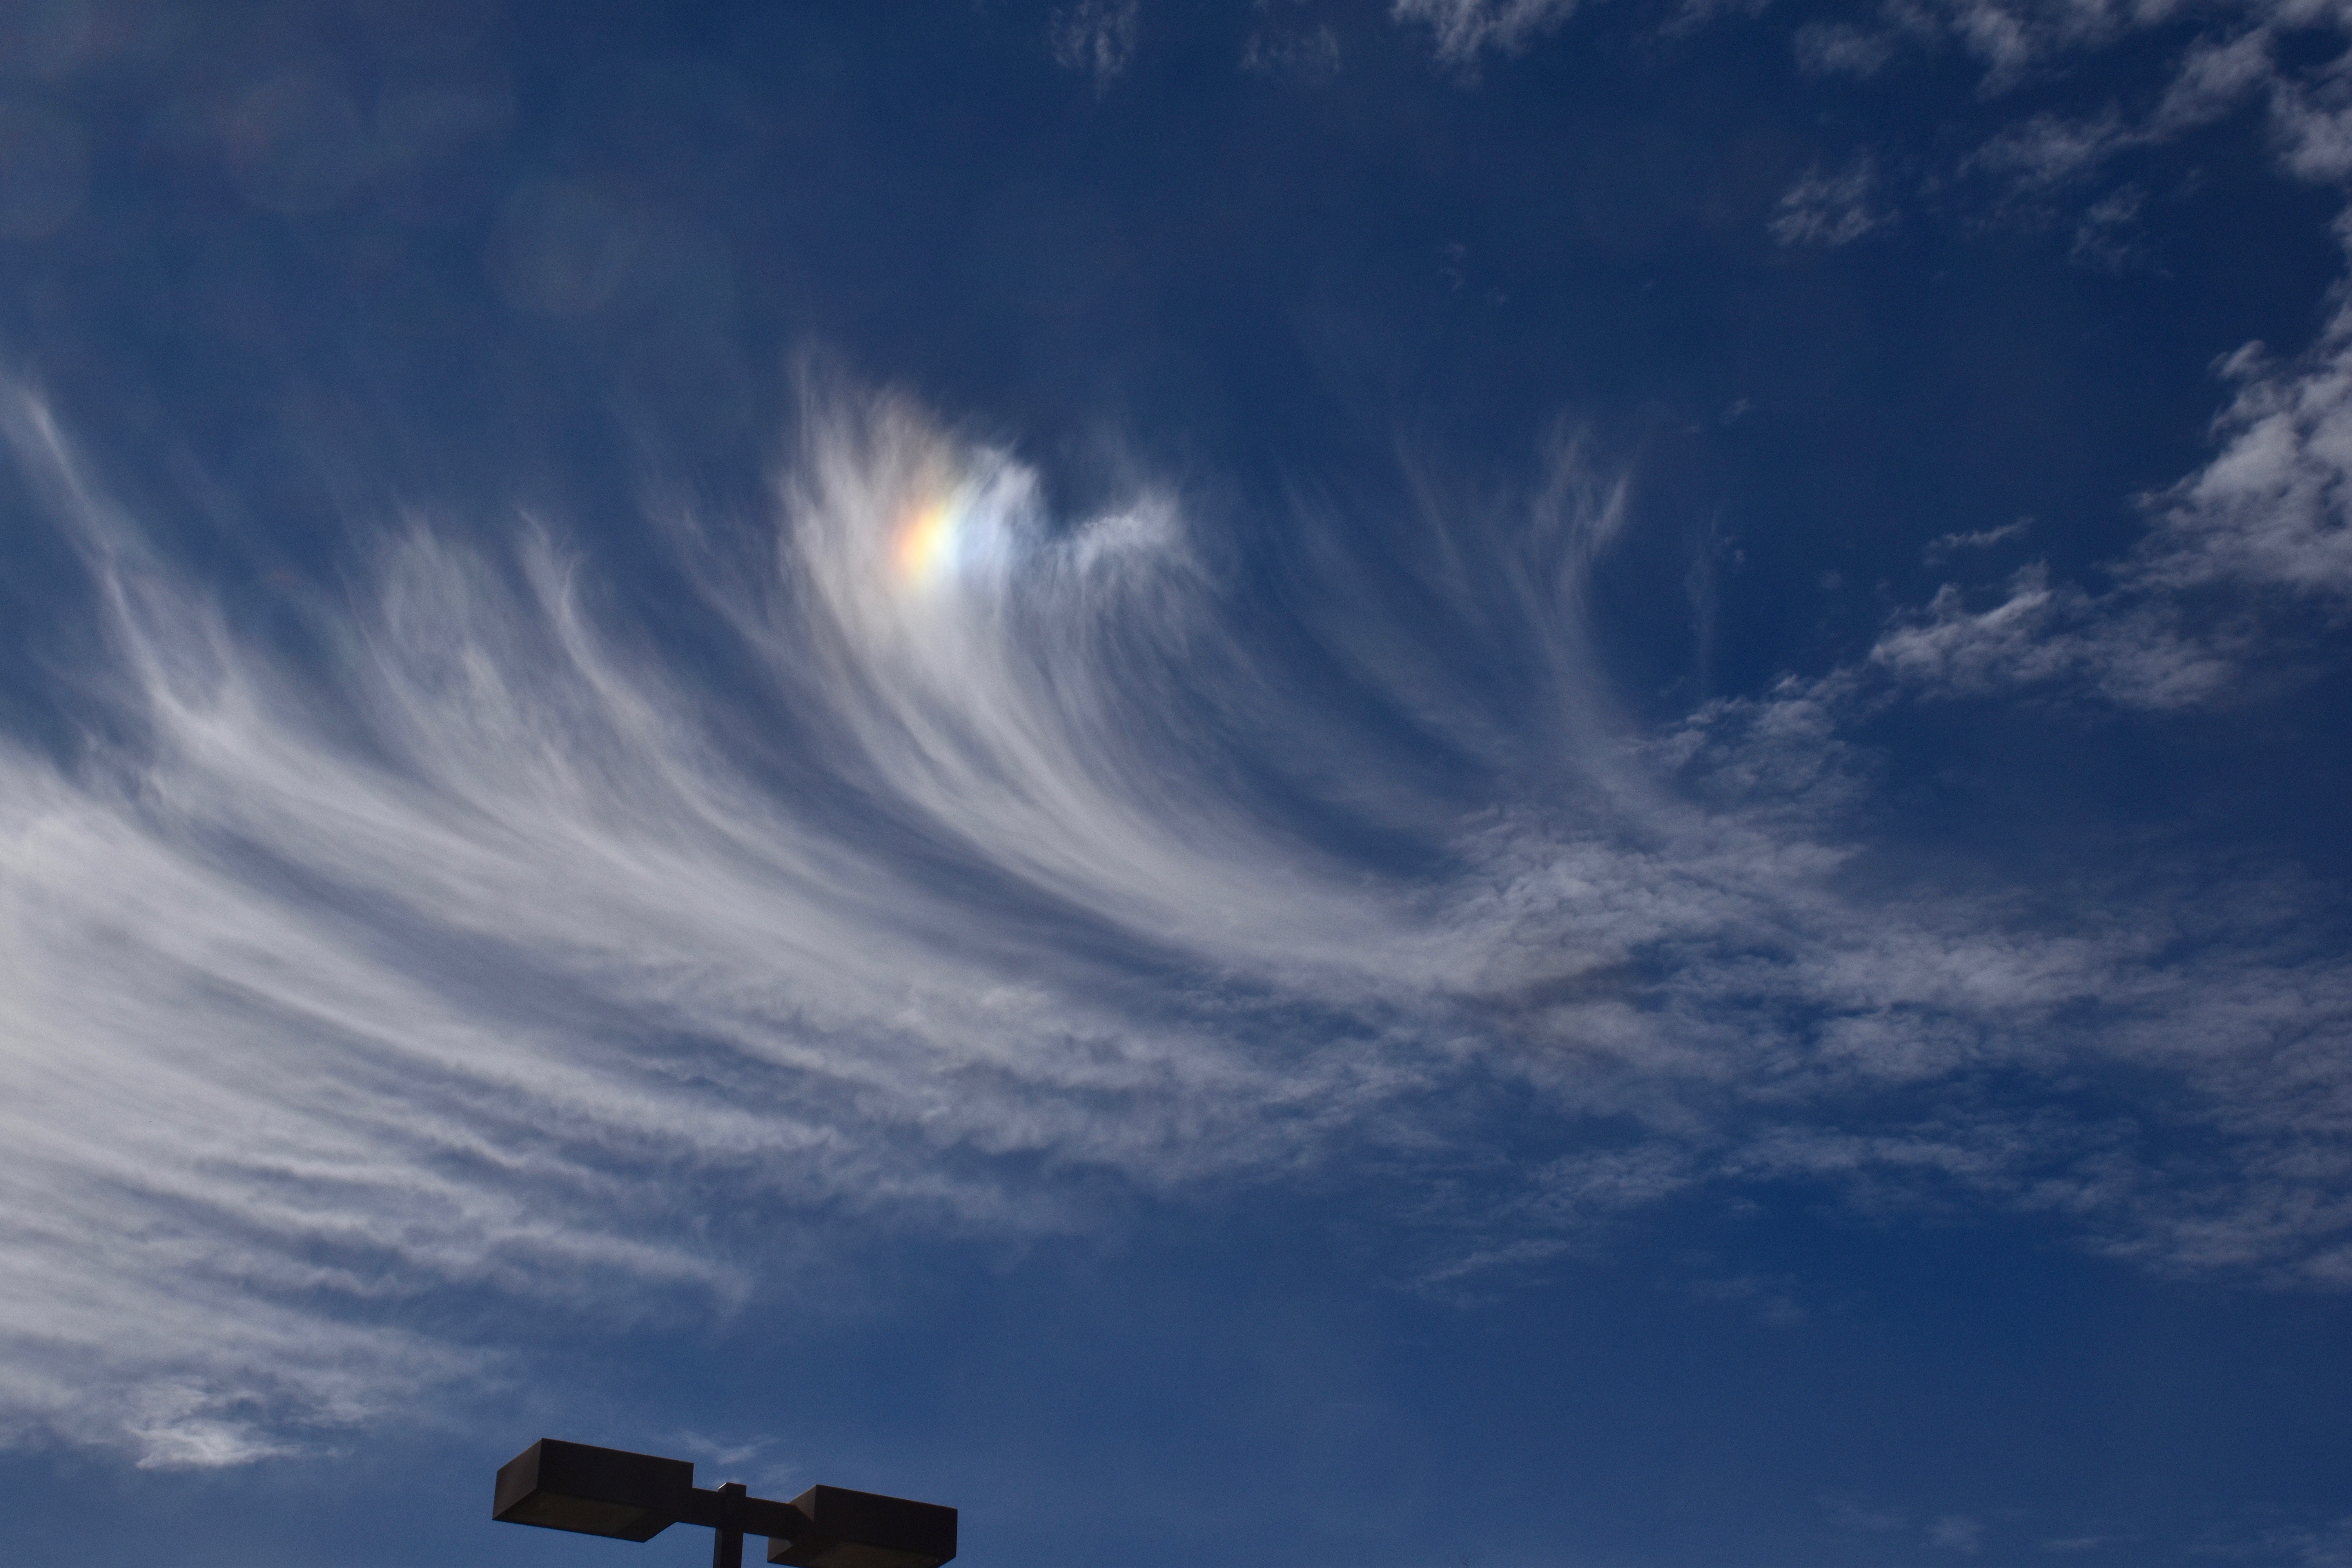
6:17 PM. Altocumulus perlucidus appearing to spread out, though likely a perspective tomfoolery. Thin Cirrostratus above.6:39 PM.
Addendum: Coupla of days ago saw the rare “Cumulo-cirrus” clouds, ones that appear to be Cumulus but are fakes, up at Cirrus-levels. You might call them Cirrus castellanus. I feel these are worth sharing so that the young cloud maven person doesn’t embarrass himself or herself when making a cloud call to friends and neighbors, as you would do. They occurred on March 7th between 11:30 AM and Noon. Can you tell, upon “zooming big” that these are mostly ice clouds? If droplets were present they were there for only a short time, thus (is that still a word?) indicating that these rag clouds were at very low temperatures.
Some sounding detective work below
The 5AM AST sounding for March 7th. The sliver of moist air at 16,000 feet above sea level is not deemed the source of those rag clouds.5 PM AST, March 7th sounding with writing on it.
Have cameras ready for interesting clouds today as yet more storms approach. Winds at 500 mb (around 18,000 feet above sea level) are forecast to approach 100 kts by tonight (oops, TOMORROW NIGHT! Egad). With winds like that, likely will be some nice lenticulars around to add to your collection. Oh, I already see one downstream of the Catalinas….
Maybe some photos later if the upload problem can be resolved.
Its not resolved…. But, trying to look at the bright side, while this ONE photo was uploading, I got some more coffee, read a book (Cadillac Desert, Marc Reisner, and got a good start on, Mythical Rivers by Melissa Sevigny–both highly recommended for cloud maven readers.
6:27 PM AST last evening, though after the brutally slow uploading speed to WP, maybe its not the same day as I started this upload anymore….
Some more on the upcoming rain and wind event in the next 24-36 h:
From this keyboard, 10% chance of less than a trace (pitiful forecast), in other words, a zero from this storm, and 10% chance of more than 0.40 inches. The average of those two, which helps center a forecast in the forecaster’s mind, great or small, would be, say, 0.21 inches.
But the wind max during this storm event will be the most “interesting” part of it: 10% chance of puffs less than 35 mph, 10% chance of more than 65 mph , in this forecaster’s opinion. The average of those would lead me to think that very momentary gusts will reach 50 mph (averaging those extremes to center a forecast). So, the wind in the next 24-36 h is really the most interesting thing to keep an eye on; stuff will blow around, shingle fragments likely to come off. This is NOT a NWS forecast.
The End
——————— 1“Puffs”: almost instantaneous blasts of a few seconds.
Blue, as in the 5520 meter height contour line as produced by a single run of the many NOAA GFS model re-runs with those little “perturbations” of the starting data. Below, our only hope for rain here in Catalina is if the model run with a 552 decameter height contour over eastern Pacific across southern California (see arrow) verifies. Its an outlier, a rogue, a voice in the wilderness, etc.
From the NOAA spaghetti factory based on the global data taken and perturbed at 5 PM AST last evening. The thin blue line to which the arrow points, would be a major, rain/snow producing trough. But since its an outlier from the other blue lines, representing the heart of the jet stream, its very unlikely to happen, even if it is produced by an actual model run for this date and time.
Some background and diversionary writing in excess; skip if busy
Now that we have more powerful computers, we can run the same model over and over again with very slightly different starting data and then see how the results diverge from one another in the days ahead. In the first few days to week of the model run, the various outputs are virtually the same because the starting conditions are tweaked so very slightly. This is chaos in action! And it makes sense because we measure everything perfectly in the atmosphere at the same instant. So, little errors abound in our starting data anyway.
Think of E. N. Lorenz, “Dr. Chaos”! In fact, he thought our existing atmosphere could shift into a pattern resulting in an ice age without any external forcing (oh, like an interstellar dust cloud coming by for a few thousand years, the sun dimming, etc.)
Pretty amazing thought when you think about it, which you just have.
Nobody really thinks that today, but he threw it out on the table in his seminole (haha) paper, “The Intransitive Atmosphere” back in 1967. He also wrote about that kind of thing in the 1968 American Meteorological Society Monograph, “The Causes of Climatic Change“, papers by 22 of the leading climate authorities of that time. (Based on a 1965 conference at the National Center for Atmospheric Research, located in “Potville”, CO (aka, Boulder-haha. But, they really do love their marijuana in Boulder…).
Strangely believe it, in a further diversion from current weather and a mea culpa downstream that maybe you won’t get to with a lot boring writing before it: not one paper in that AMS Monograph was about the climate effects of CO2! Talk about being asleep at the wheel! Wow.
Well, OK, you can’t blame them too much.
The earth’s temperature was slipping downward in those days, and while it was well-known that the effect of CO2 was to cause warming, it didn’t seem to be having enough effect to counter the cooling, and we were only just getting obs of CO2 from Mauna Loa. Sure, its kind of an embarrassing chapter of science, so your not gonna hear much about it from scientists; the monograph above is almost never cited, or course. We like to avoid mentioning embarrassing chapters.
I could name some others, in my specialty, like those cloud seeding experiments at Climax, CO, in the 1960s which looked so good, so complete, and fooled the National Academy of Sciences because it was really all “smoke and mirrors.” Or those in Israel in the 1960s and 1970s that fooled everyone for a long time, too, but, upon further review, were also “smoke and mirrors.” Yes, that’s right, there was a “consensus” of scientific opinion about the results of each of those cloud seeding experiments that for a time was wrong, as, to beat a dead horse, happened in the early 1970s concerning the prospect of “global cooling;” the preponderance of scientific thought was that an ice age was ahead (as indicated by a climate change conference at Brown University in 1972, the results of which were summarized in Weather and Climate Modification, 1974, Wiley-Interscience publishers, W. N. Hess, Ed. Hell, the earth was cooling, so it made sense at that time!
Pretty amazing when you think about it, which you just have.
We know better now. CMP, like most everybody else, is predicting warming dead ahead, only how much is in question.
Here, we address embarrassing chapters head on, if anyone is still reading, which I hope they are not. Check it out.
About 13 days ago, the NOAA spaghetti ensemble factory showed a result that strongly “IMI” (in my interpretation) indicated a vast weather change beginning at the end of January. Sure, it was WAY out beyond what we consider to be a reliable forecast window, and unprofessional to make a forecast that far in advance, that is, much beyond a week, but the signal, the bunching of lines was so great, I went for it anyway. I got excited and brought to your attention that a likely drought-interrupting weather change was to occur in 12-15 days from then, troughs would occupy the entire Southwest beginning at the end of January into the first week of February.
Its not gonna happen.
Cloud maven person was too confident in his interpretation of spaghetti back then, that a trough positioned in the SW was virtually in cement; it had to happen. I was so excited and so wrong, got carried away, like I did with Sharon so many decades ago, thinking we were surely going to be a couple. I was rongno then, too. Arthur Rongno…. Oh, well, we learn and sort of move on.
Oh, there could still be a major trough toward the 5-6th of February, but as the title imputes, we’re down to a single blue, a rogue contour produced by one of the many model runs repeating forecasts last evening with those little errors in starting conditions. the Lorenz model runs. 🙁 🙁 :{
“Rainy portent”; is there a better phrase for a desert than that? I don’t think so. See mini-discussion below, and below that, some soapboxing! Very excited today! Where are my pills?
Now, let us discuss the top 100 weather blogs:
Bob Maddox‘ superb site, representing Tucson, makes the list ! This note and info from pal and fellow weather fiend and fellow science investigator, Mark Albright1:
11) Cliff Mass Weather and Climate (U of Washington Huskies!)
28) Judith Curry, Climate Etc (once worked at U of Washington Huskies as a visiting grad student
30) RealClimate (from the Huskies)
33) Wasatch Weather Weenies, Jim Steenburgh (graduated from from the U of Washington Huskies!)
65) Mike Smith
70) Madweather – Bob Maddox (Tucson AZ) (Was grad student of mighty prof and neighbor, Bill Cotton, whose heard of the Huskies!
83) West Coast Weather – Michael Fagin”
Not sure if “we” (to distribute poor performance beyond a single author) even made the top 1000; the list doesn’t go that low (or high).
But, we’re not really a weather site, per se, to put a positive spin on a glum finding. We talk mostly clouds here. not so much weather. Contains sophomoric, droll, and tongue in cheek “humor”, too. Maybe Cloud Maven Person’s blogulations would make the top 1000 CLOUD sites!
The weather ahead and beyond ahead
Cool with passing rains every coupla to few days, maybe some snow with one of those events, as they continue into February. The first storm begins on January 20th, and then its one threat after another. This new “troughy” regime should bring the January rainfall total in Catalinaland over average of 1.60 inches (1978-2017). Currently, we’ve logged 1.10 inches in a NWS style 8-inch diameter gauge.
Looking for tiny green sprouts out of our desert soil now.
The End
(except for all the footnoted sci commentary below)
sci commentary and soapbox module——
1Mark Albright routinely calls attention to suspect temperature data that’s out there, and other questionable aspects of some climate statements2. He is widely well thought of for these conscientious efforts in bringing temperature errors to people’s attention3. Mark was former State Climatologist of Washington State, to be redundant, for many years. Was more or less fired for questioning claims of HUGE snowpack losses in the Pac NW between the late 1940s/50s (a cold era that started after a warm era in the 30s and 40s) and the late 1990s (a Niño-filled warm decade); to wit, it was a cherry-picked study, as we learned later via Stoelinga et al 2010 pdf, and by the mountainous snows that occurred immediately after that bogus claim was published in the Bull. Amer. Meteor. Soc.
Could snowpack go down gradually over the years in the Pac NW due to warming? Sure! But there was no need to cherry-pick data to create the appearance of an imminent calamity! It destroys credibility when objective investigators like Stoelinga, Mass, and Albright check into them. Michael Mann, of Penn State and “hockey stick” fame, also fueled the fires of skepticism and doubt needlessly by refusing to give the details (data and methodology) on how he created “The Stick” which eliminated such climate anomalies as the Medieval Warm Period and the Little Ice Age that followed. If you read Science magazine, they often refer to the MWP and LIA! What’s Up With That? It can’t be both,; didn’t happen but did happen????!!!!! Dammital.
“Fellow investigator”, CMP? Oh, yeah, baby! Your CMP likes questioning exaggerated cloud seeding reports after they’ve been published in peer-reviewed journals! Or checking into suspect cloud reports *(after all, he is the “Cloud Maven”) that are the foundations of seeding results. He’s even gone to foreign countries (well, one) to check out suspect cloud reports, help the people of that country understand their clouds.
While CMP has a number of peer-reviewed pubs that are critical of cloud seeding (nearly all co-authored with the late mighty Prof. Peter V. Hobbs), maybe today, as do so many good scientists and others, those critiques would just be in blogs? I dunno.
Journal editors have tremendous power over your getting in these days via who they give your manuscript to to review. (Well, that’s always been the case).
But today that power has grown enormously since they (a single editor or an editorial board) can refuse your manuscript on first sight (its “D. O. A.)” and not even send it out for peer-review! This is an intolerable situation since non-objective factors will certainly creep in to such a process. As an example of unwanted but valid science, Stoelinga et al took years to get into the J. of Climate.
Note to journal editors: Send the damn thing out! Let legitimate, even adversarial reviewers, determine the fate of a manuscript, with the stipulation that the author (s) have a chance to rebut adversarial reviews which will likely reject a manuscript prima facie. They’re the best ones!
And, no “pal reviews”! They’ve cost us so much in the early published cloud seeding claims here, and in Israel , believed to be accurate by our best scientists and national panels, but cost us and Israel tens of millions of dollars of worthless cloud seeding based on those ersatz published results.
2Some professors and students at the U of WA delete Mark’s e-mails on arrival; they prefer not to hear about discrepancies or other weather data that might cast doubt on today’s climate issues. As far as I know, only Prof. Cliff Mass has, from time to time, openly supported Mark’s findings putting him even more in the cross hairs of some of his fellow faculty members and especially some other climate scientists and students/post docs since he has often scrutinized and found wanting some gross claims on climate change. We are in a science era where questioning even the magnitude of the warming ahead, even if we believe its coming, is seen as untoward. Science is not as it should be!
3If you believe that, I also have some ocean front property in Nebraska I’d like to sell you.
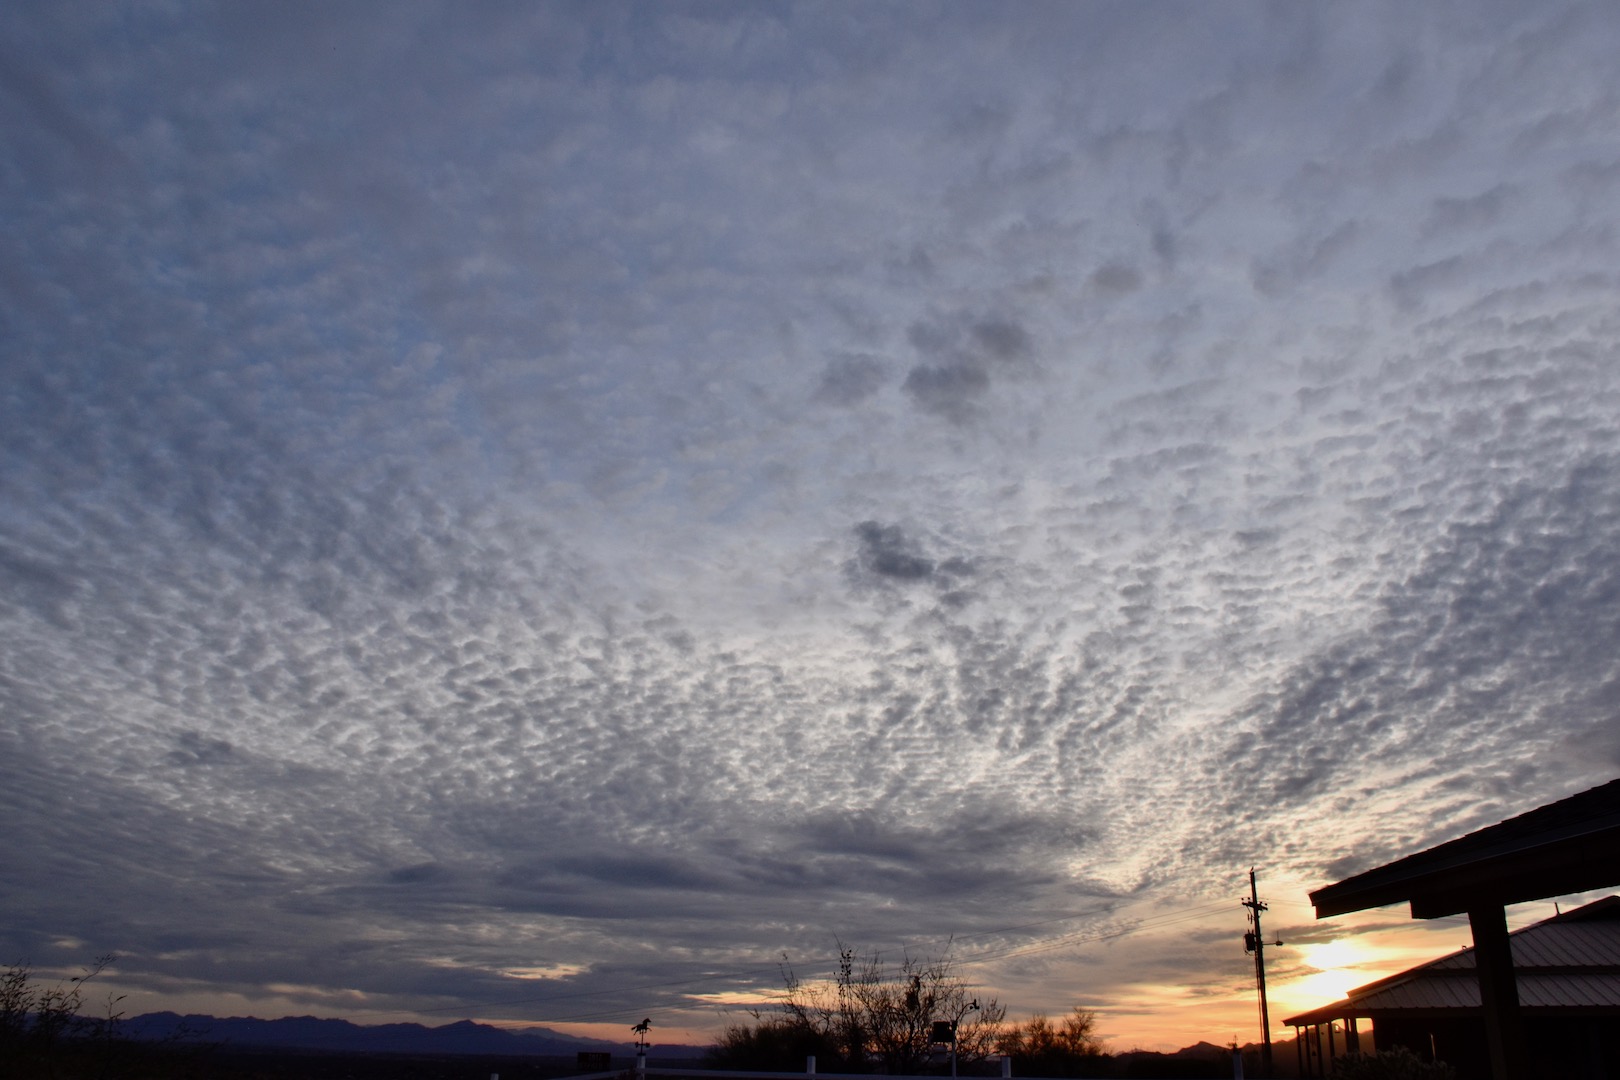
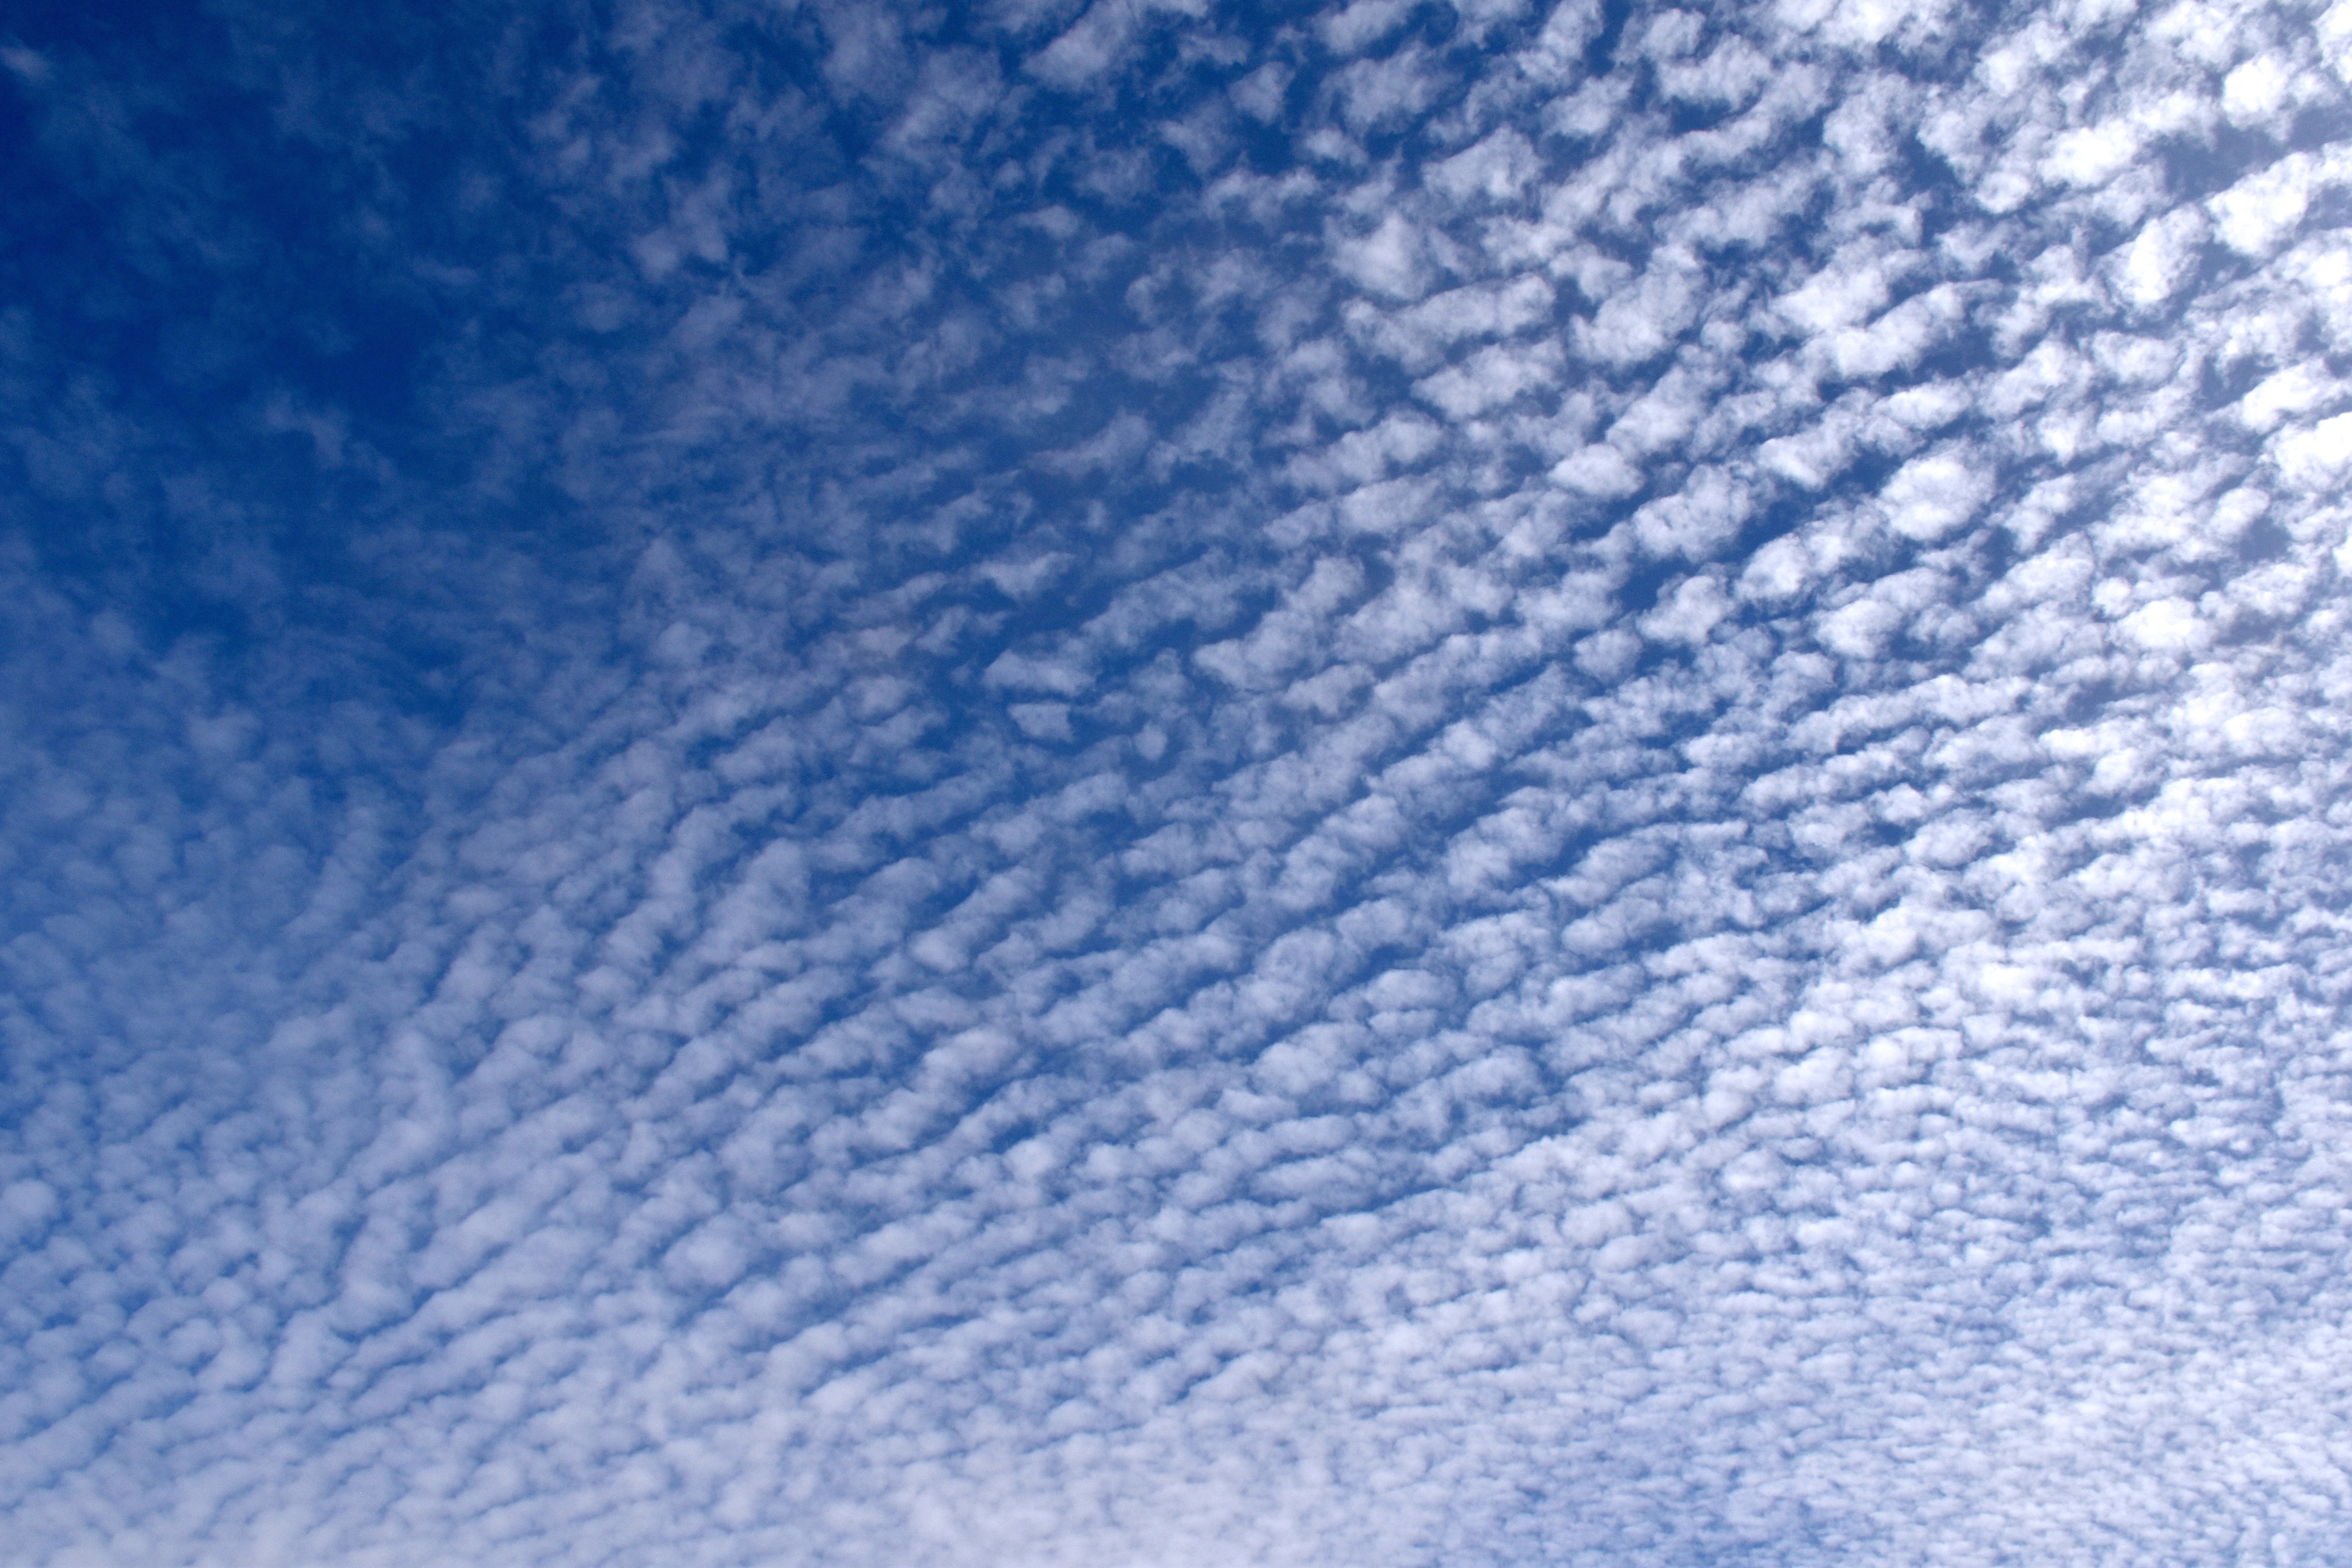
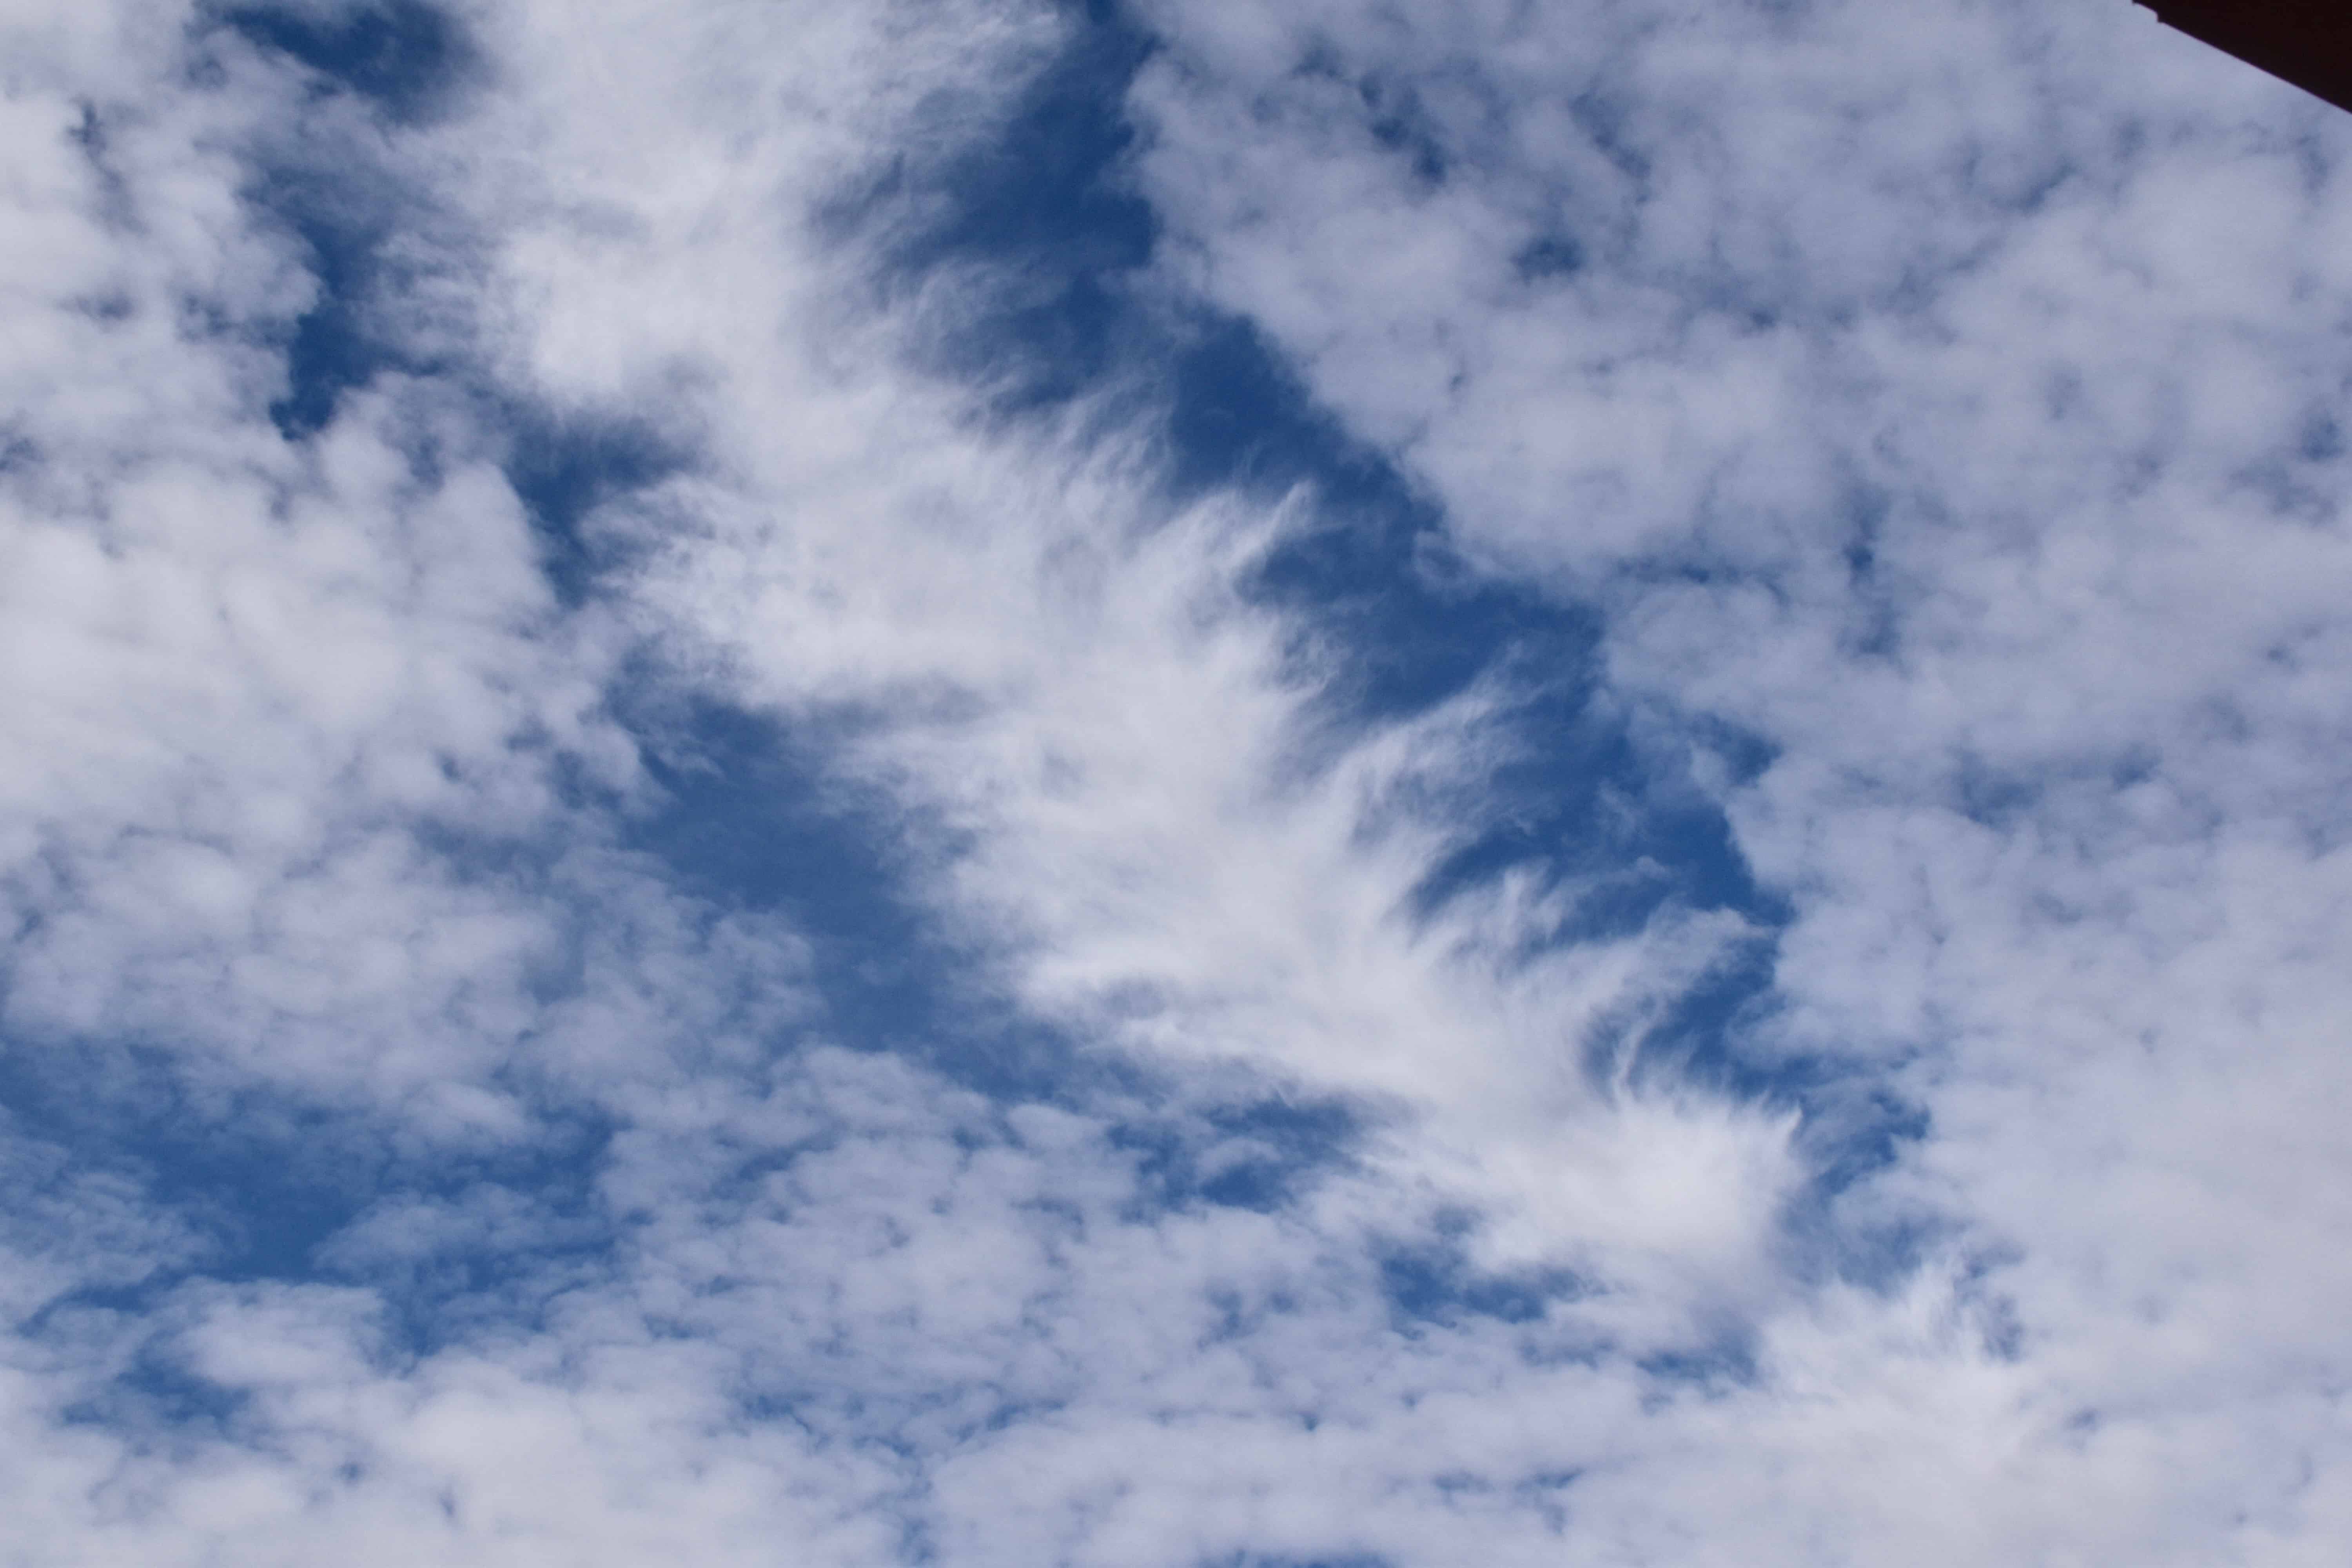
A swatch of Altocumulus perlucidus translucidus (sorry, that’s the way we talk around here) passed over Catalina early yesterday afternoon, each “unit” nearly perfectly evenly spaced with its fellow cloud element creating a brief period of cloud awe for those Catalinans (or is it, “Catalina-ites”? “Catalinians”? Who knows, who cares?). Here it is, in case you work indoors and missed it. It was truly a fabulous sighting!
1:16 PM.1:16 PM. Starting to take too many pictures of the same thing!1:16 PM.1:16 PM, of course. So pretty.
The afternoon was marked by a melange1 of middle clouds:
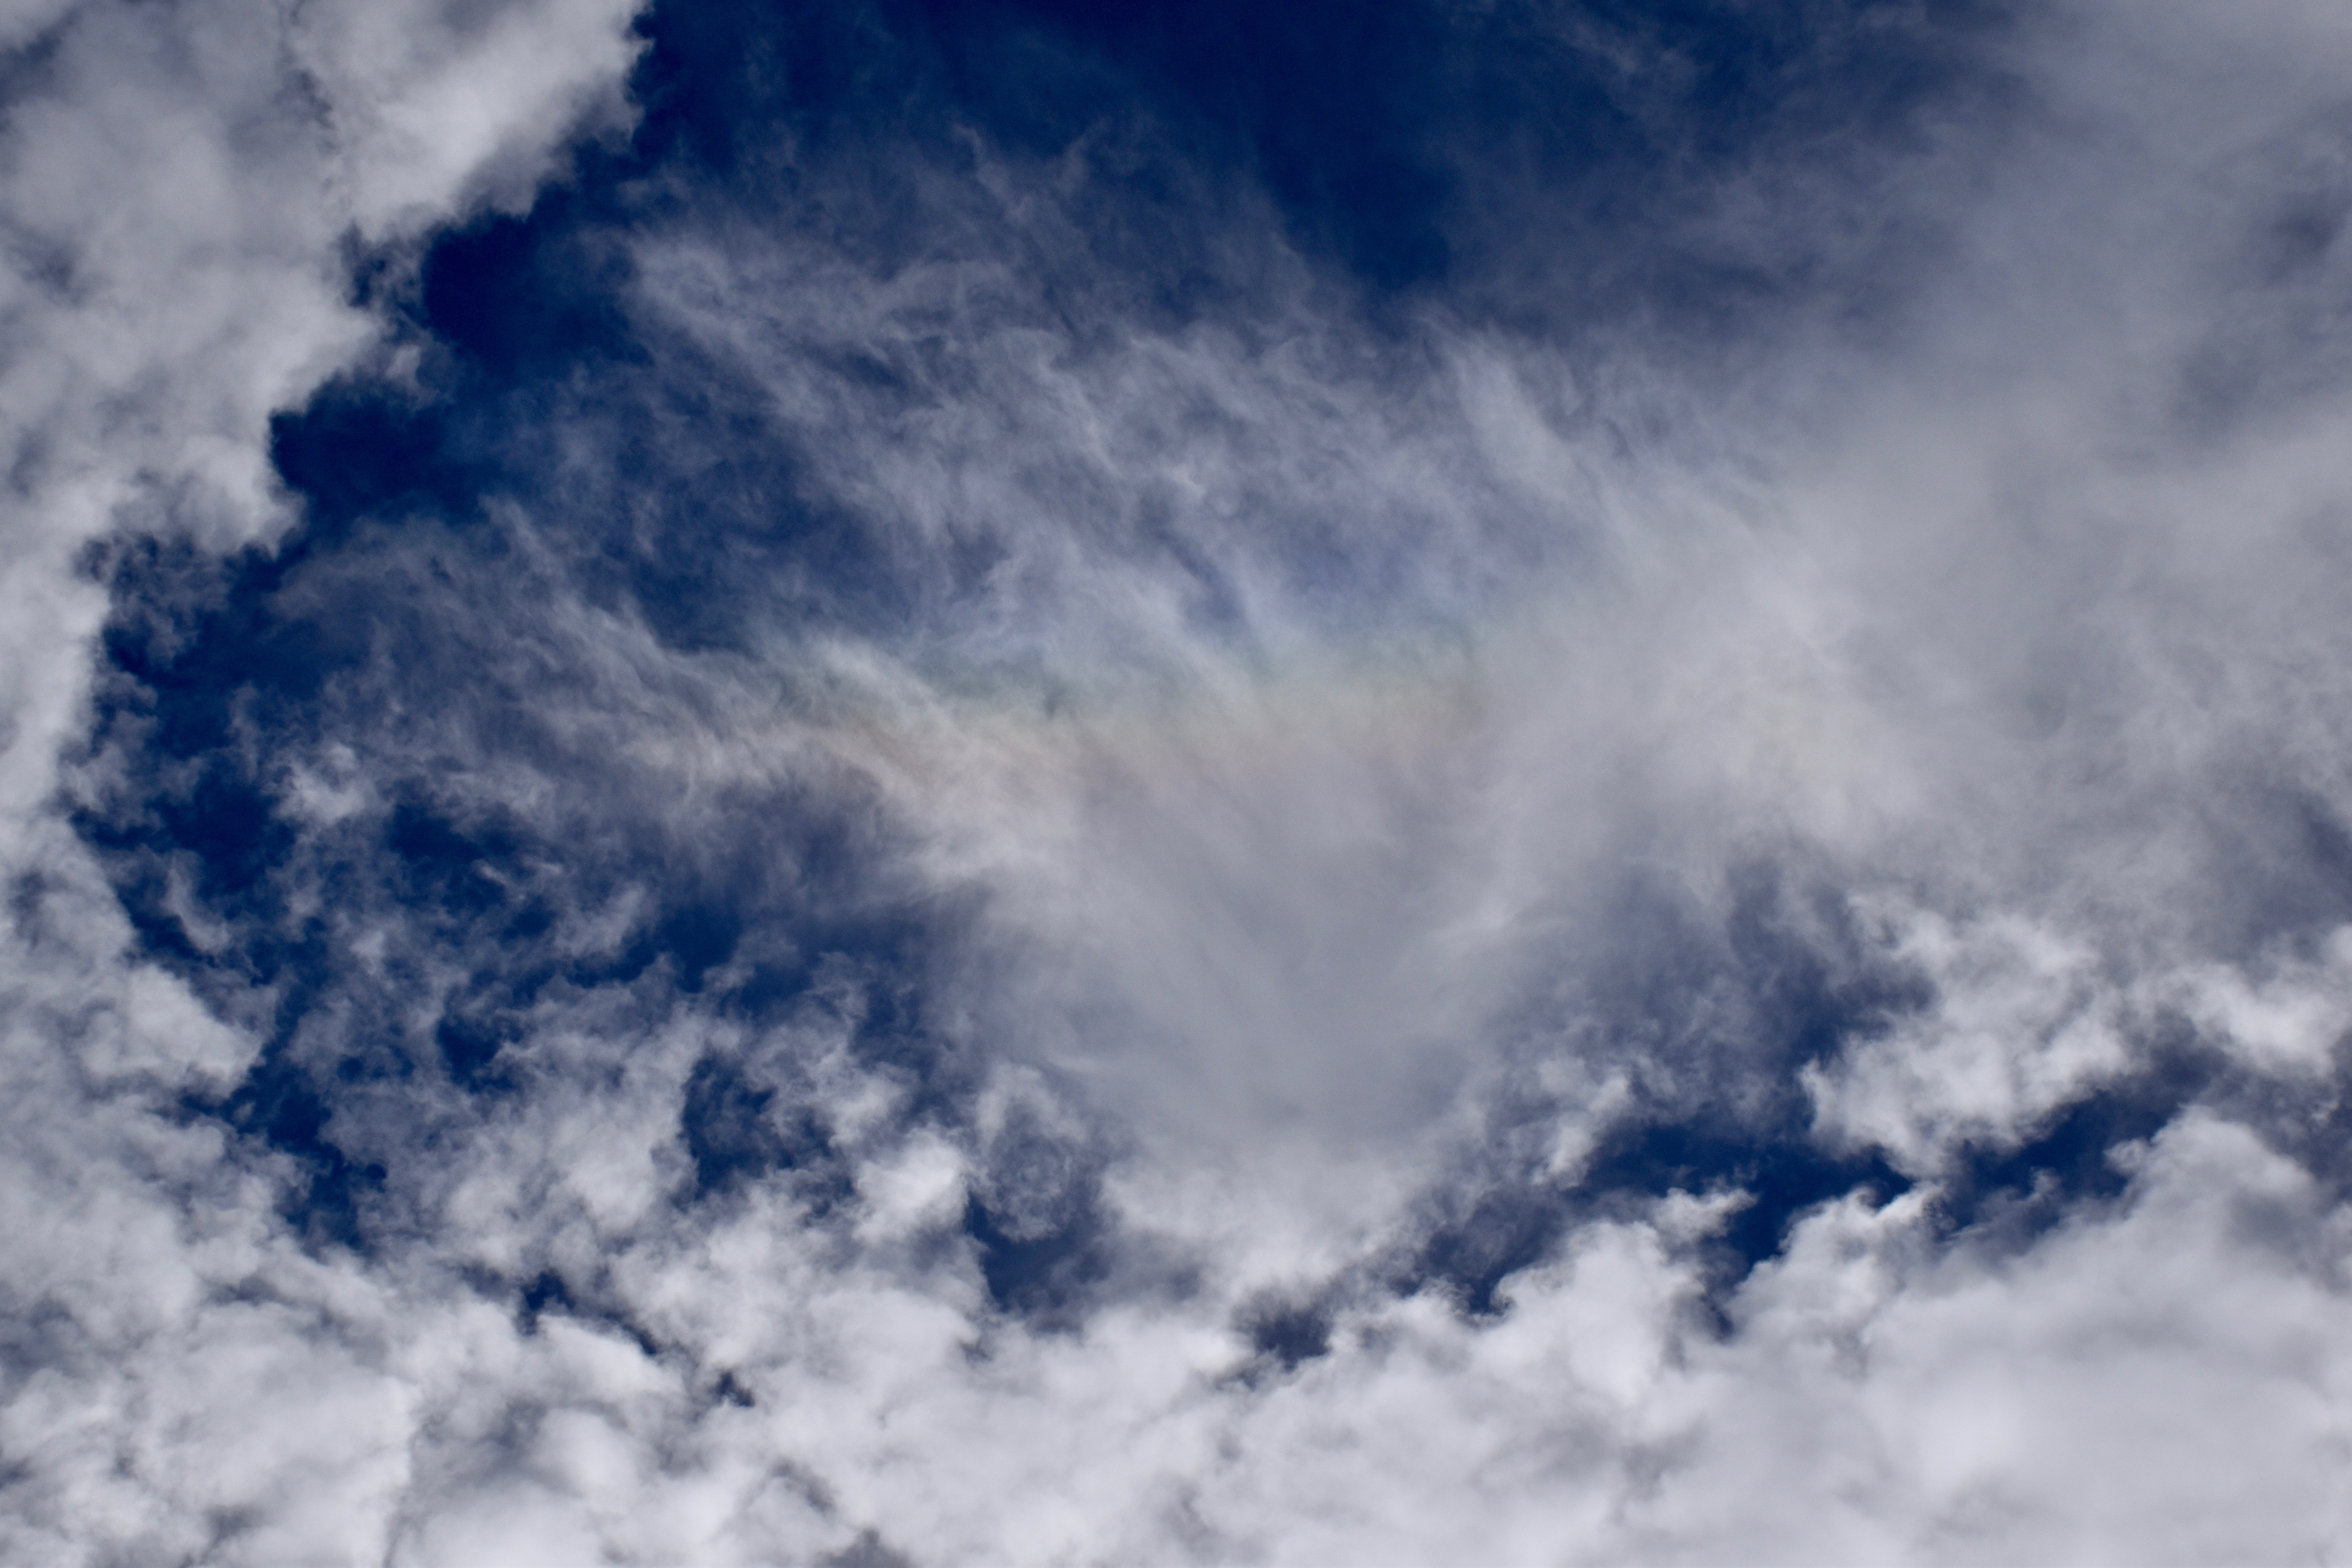
1:52 PM. Altocumulus opacus with a Cirrostratus above.3:11 PM. Some equestrians on horses (haha) went by the house. Sometimes we focus too much on just clouds here, and so we offer the reader who visits here an occasional relief from cloud fatigue.3:12 PM. Those equestrians were being shaded by a Altcumulus perlucidus and by an overcast of Cirrostratus. If you look real hard, you can see a faint halo. The Cirrostratus was thickening upwind as an upper level wave approached and was increasing the amount of rising air aloft over us. The Altocumulus clouds also thickened toward sunset. See below.5:07 PM. Heavy Altocumulus approached from the SW, keeping the sun from under-lighting the Altocumulus as it went down, so no flaming sunset last night. The Cirrostratus overcast continues. All in all, a fine day for Catalinians!
The weather just ahead
The local TEEVEE met men are, of course, pounding out the good news rain is just ahead for Catalina. Looks like, oh, 100% chance to CMP (Cloud Maven Person) starting after midnight Tuesday to Wednesday. How much?
This is a potent, but fast moving trough. Maybe will have only 2-4 h of rain with the passage of the cold front and its rainband. But, coming from the sub-tropics, should have a appreciable rain band with it.
I would expect rainrates to reach “moderate” as the heart of the band goes by for a coupla hours, anyway. Moderate rain is defined by the NWS as 0.1 to 0.3 inches per hour. So, only two hours of moderate rain should be at LEAST 0.2 inches, and most likely more.
We’re thinking here that there’s a 90% chance of more than 0.15 inches, and a 90% chance of less than 0.70 inches. So, averaging those two leads to a best estimate in CMP’s opinion of 0.425 inches! Wow. Nice.
Now, I will look at the U of AZ nested model and see what it thinks. Kind of game we play here, seeing how a seat of the pants forecast, made over a coupla minutes, measures up to a computer model with billions if not trillions of calculations:
Cumulative rainfall ending at 3 PM AST Wednesday afternoon. Catalina is in the GREEN, indicating that the Beowulf Supercluster thinks we’ll have over half an inch (Ms Mt. Lemmon, over an inch!) I am so happy!
The weather way ahead
After the nice rain just ahead, we have to get through the week-long dry spell before we move into a new stormy regime. First, a spaghetti depiction of the ridge after our nice storm:
Valid at 5 PM on the 14th. Huge ridge has stacked up along the West Coast, making it look like the drought will continue ad nauseum. You’ll be discouraged when the middle of January comes around (though by then, everyone will know this is a straw ridge, will collapse in almost hours from this time from the outputs made in real time then.)
Here’s what’s been exciting for a few days now, and below, from last evening’s global model output:
Let’s see what the actual and very latest model run from IPS Meteostar has for us:
From the 11 PM AST last evening global model output this big boy. Unlike so many prior troughs that were bogus this winter at this time ahead (two weeks), this one has spaghetti support and will be real!!! And, it won’t be the only one!!! I’m shouting again!!!
How much these coming rains can benefit our spring wildflower bloom and spring grasses I don’t know, but I sure hope they can resuscitate what otherwise will be a dismal spring.
Expecting a snow event during the “new regime” that takes over after mid-month, too. Be ready!
Yep, unless you were outside yesterday morning, you probably missed the few drops that fell. But fall they did, giving us officially a trace of rain for January! In case you don’t believe me, here is a shot of the incoming shafts of rain. OK, “veils” of rain.
8:22 AM. Rain reaches the ground from thick Altostratus/Altocumulus clouds.
Now, a historical forecasting criteria note after that paragraphical blog title, a criterion that still holds true:
In the 1950s and 1960s, the Los Angeles forecast office used the 564 decameter height on 500 mb weather maps (those made for about 18,000 feet above sea level) to delineate where the rain line was for incoming troughs. North of that, rain fell; south, no rain.
It was remarkable how well that worked.
Don’t know it that height criteria holds here in AZ, probably not, but the 500 wind max seems to be a good discriminator for TUS for rain; under or north of that max seems to be a necessary (though not sufficient) criteria in wintertime. (That wind max does not hold in Cal; rain often falls south of the 500 jet max; only east of the Sierras and coastal ranges does it hold.)
Lately, as winter gets colder, the NOAA spaghetti factory has recently lowered the red line heights to 564 dm in their 500 mb spaghetti plots, you can see that in 5 days from last night’s 00Z run, rain is virtually assured in southern Cal using that criterion, and we hope that rain gets here, too.
Check out where red lines are in the plot below. I’ve helped you to find red lines on this plot by annotating them with an arrow:
Valid at 5 PM AST. See red lines. See red lines move east from California.
But after that trough whooshes by like a Nike logo, in ten days (2nd plot), we’re doomed again to be in the midst of a long warm, dry spell:
Valid on January 14th, at 5 PM AST.
But what about after that next warm, dry spell? The weather way ahead
In a less professional comment than the usual ones posted here, reaching beyond the 10 day forecast limit, that domain of the models where things that are forecast beyond ten days often go to hell with just the next model run, these spaghetti plots foretell a collapse of that big fat, storm blockin’ ridge after our next warm, dry spell! It collapses into a muddle down, oh, I dunno, way down in subtropics somewhere. Yay! I can feel your happiness as I write this for you!
That ridge collapse means, first of all, that strong storms will blast Cal with needed flooding (well, big rains, anyway), and its likely that those Cal blastin’ storms will reach into all of Arizona providing a much needed hiatus in our drought, that is, will bring appreciable rains right here into Catalina as well. You can see if I have made this up by looking at the whole sequence here, keeping an eye on where those red lines are foretold to be.
So, that’s it, that’s my take on the longer term weather pattern:
“A Change Gonna Come,” as so eloquently sung by the master, Sam Cooke, when that 500 mb criterion was being used in LA, and apropos here because a change is gonna come, not that long from now. (Warning: The historical video scenes with Sam’s heartfelt tune will bring tears I just learned… Everyone should see it. Yep, we’ve been through a lot since he sang that song….)
Will keep you up to date every so often if it looks like my take, cribbed from the spaghetti plots is going to be correct in that drought bustin’ part I’ve described beyond ten days. In the event this “take” goes bad, it will, of course, not mentioned again. May have to fall back on writing about aircraft ice production in supercooled clouds to distract you.
I use that expression not only to draw attention to myself since my name is Art, or, “Artie boy” to mom, but also because I had a role in bringing this phenomenon to the attention of the scientific community; that is, that an aircraft could glaciate portions of clouds at temperatures as high as -8°C. This in a peer-reviewed article so controversial it was rejected twice by journal reviewers before “getting in “(pdf here)! Some background on why this happened is found in a footer way down below….
Its common knowledge today that an aircraft can produce in essence a contrail in clouds at temperatures down to about -10°C and must be avoided when researchers are sampling the same cloud over and over at below freezing temperatures.
Back to the beginning:
The day began well enough with a nice sunrise over the Catalinas:
7:28 AM. Really cold Altocumulus perlucidus lurks over the Catalinas. The sounding suggests that this layer was at -26̂°C, and yet no ice or virga is present. This is not unusual. Ice tends to form more readily when the droplets in clouds are larger–these were likely tiny, 10-15 microns in diameter, and, being a layer high in the atmosphere, not connected to the ground, meant there would be a dearth of ice-forming substances like dirt, well, kaolin mineral particles.8:01 AM. Well, OK, for the really sharp-eyed cloud maven juniors, yes there was a trace of ice here and there in those clouds.
Here’s the early morning National Weather Service balloon sounding from the U of AZ:
This sounding was launched about 3:30 AM AST yesterday morning. During the day, the bottom of the Altocumulus clouds lowered and got a little warmer, but still plenty cold for aircraft ice production.
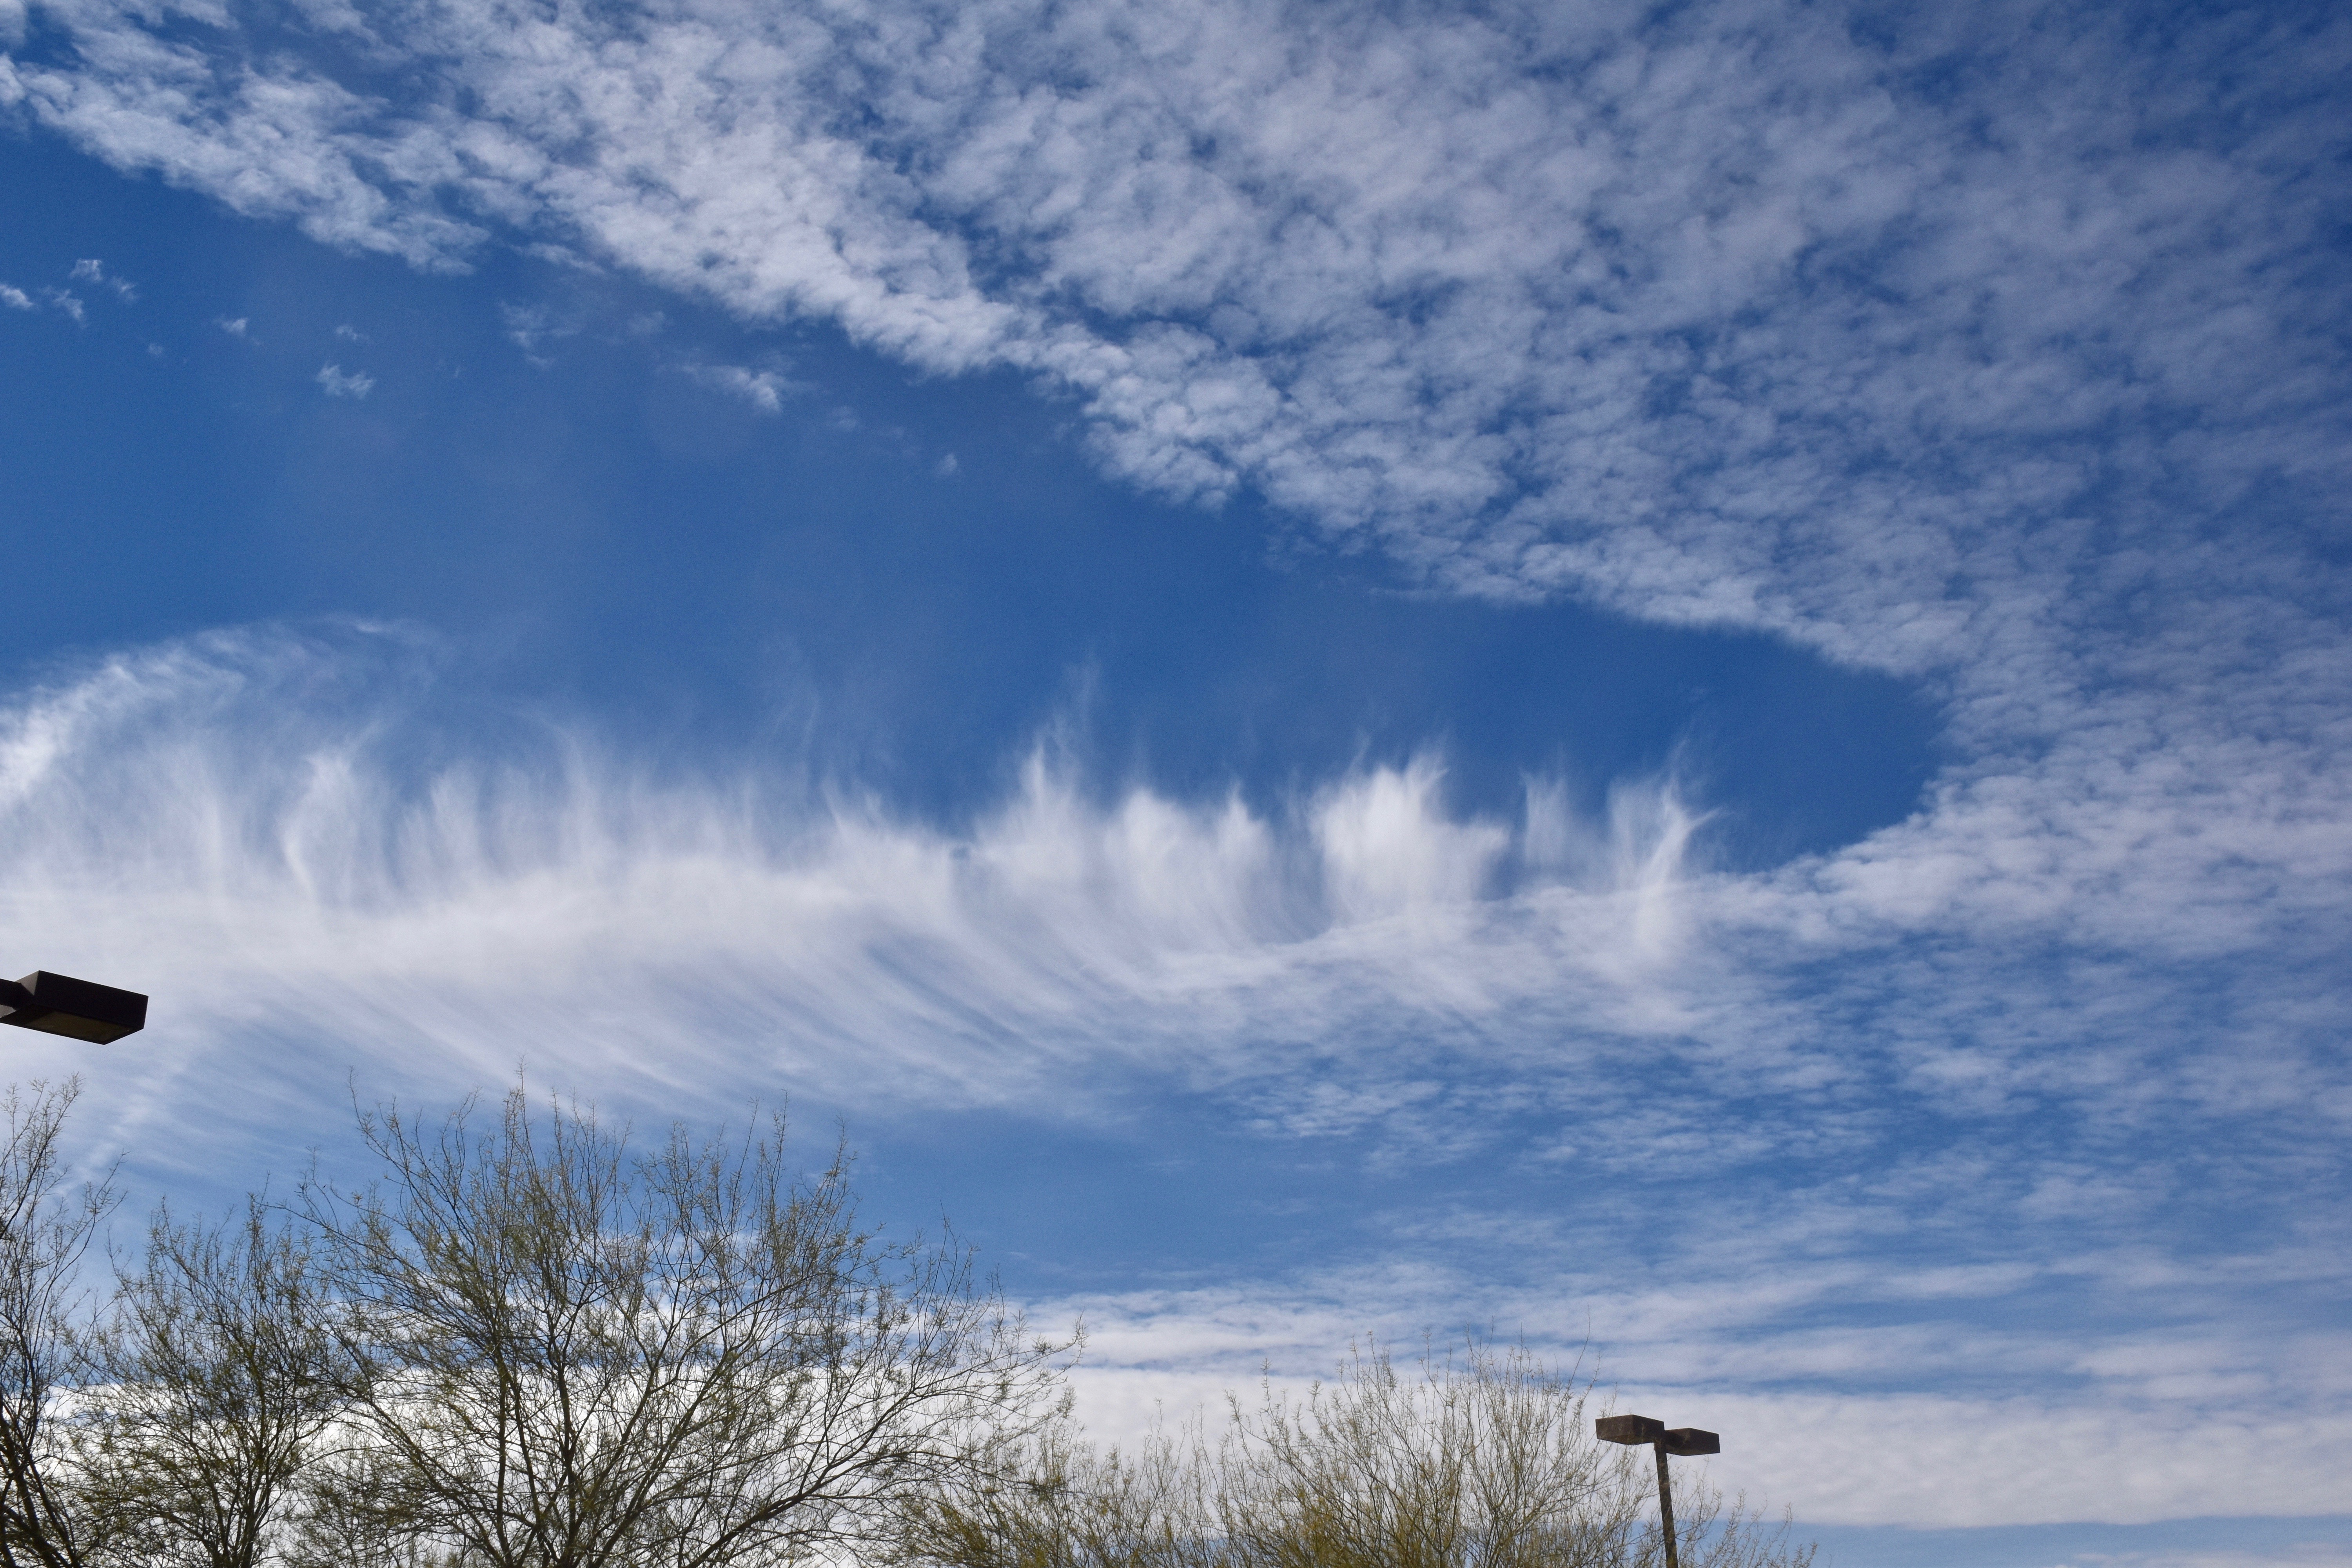
Then, as the Altocumulus layer filled in from the west, the aircraft effects roared to life. An example from yesterday, one that passed right overhead of little Catalina!
10:01 AM. A parch of aircraft-induced ice in this Altocumulus perlucidus translucidus composed of supercooled droplets otherwise, is about to pass overhead of Catalina.
10:08 AM. High temperature contrails rip through a Altocumulus perlucidud translucidus layer up around -25°C.10:10 AM. Looking for some optical fireworks here, such as a tangential arc (halo curving the wrong way), but only a hint of one showed up. Can you see it?11:23 AM. Another clearing with ice below it is seen just SW of Catalina from the parking lot of Basha’s where I went to get some cottage cheese.11:33 AM. Sun dog (parhelia) lights up in the ice patch above after I came out of Basha’s with some cottage cheese. Note to writers; little, seemingly irrelevant details like what you bought in a supermarket makes your writing come alive for the reader.1:21 PM. There’s another couple! They were just everywhere yesterday!3:52 PM. Later as the moist layer deepened and lowered further, there was ice aplenty, but it was impossible IMO to tell whether it was au natural or aircraft-induced. Surely, some was due to aircraft penetrations of supercooled clouds. However, when the air is rising enough, a hole or ice canal may not appear since droplets can reform rapidly.3:52 PM. Looking more to the west where the long trails of ice are more visible.4:14 PM. I feel asserting here. I assert that this one is from an aircraft, but with droplet backfill that prevented a hole from forming. Looks like “phony” virga to me, and, of course, to you, too, as a certified member of the cloud maven society.5:21 PM. Interestingly nearly all virga disappeared about this time, certainly nothing extraordinary that led to the suspicion of aircraft induced ice. The sounding suggests that the higher temperatures that the Altocumulus layer was at may have been the reason. See below…The U of AZ balloon sounding launched at 3:30 PM suggests the bases of the Altocu have dropped down to about 18,000 feet above sea level, 15,000 feet or so above Catalina, and are much warmer, and thicker than when the day started as we could see.
The weather ahead
More interesting middle and high clouds, probably a great sunset/sunrise or three, but no rain, just virga. The present mass of middle clouds passing over has some virga and sprinkles, but that’s about it from this episode. No real support yet for a change in our dry, warmer than normal weather regime in spaghetti plots though one trough a week or so out is forecast to bring a little rain.
The End
Some background on “APIPs”
This phenomenon had been shot by photographers for decades, yep, DECADES, BUT, it was believed (apparently) by those doing cloud research, that it only happened at very low temperatures such as those when the normal contrails we see occur (at temperatures lower than -35°C), viz., it was ignored.
Another factor was that all of the rare photos of this phenomenon, dubbed “Aircraft Produced Ice Particles” (APIPs, by yours truly, though not the greatest name) appeared in lay or quasi-lay publications and were likely missed by those with big Ph. Ds. who only read technical journals. An example of this was on the cover of the Bulletin of the American Meteorological Society in 1968, a cover shot which drew the greatest amount of reader comments that the journal had ever seen! They went on for a couple of months, some suggesting that the ice and hole in cloud was due to a meteorite!
Also, it was a rare case indeed when the photographer could report the temperature at which it occurred.
Honestly, I gave up on the chance of rain overnight into this morning at sunset yesterday due to the absolutely clear skies. And, like you, woke up to not one cloud within a 100 miles! How could this be, given the synoptic situation? Started slicing apples for some humble pie, but then, when looking at a radar and cloud loop (this one from IPS MeteoStar) saw that lower clouds had magically erupted to our west before midnight, and by the time they got here in the early morning hours, had little showers coming out of them!
I did not park my own dusty car out from the carport, either. I thought I would at LEAST see a pile of clouds on Ms. Lemmon, too, this morning! Sure wrong there. Here are a couple of images from what has to be considered a tiny weather miracle:
Chances of rain increasing (imagine!), for just over a week from now as actual model outputs begin reflecting what spaghetti (the many outputs) was indicating, i.e., a big upper trough in the West-Great Basin area. At the time that spaghetti was indicating that, the actual model outputs were not, indicating that they were outliers.
Check this out from last night. Since this model output is more in agreement with that crazy spaghetti plot, it inherently has more credibility, and is likely not an outlier model run. That what the NOAA spaghetti factory is used for, getting a handle on those runs that might be wild, and those that are more likely to verify.
Its valid on the morning of May 8th and shows a trough coming out of the Pacific ahead of the one from the Pac NW, shown at this time over northern Cal. The hope here would be that the one from the SW would have a generous amount of sub-tropical clouds with rain in them.
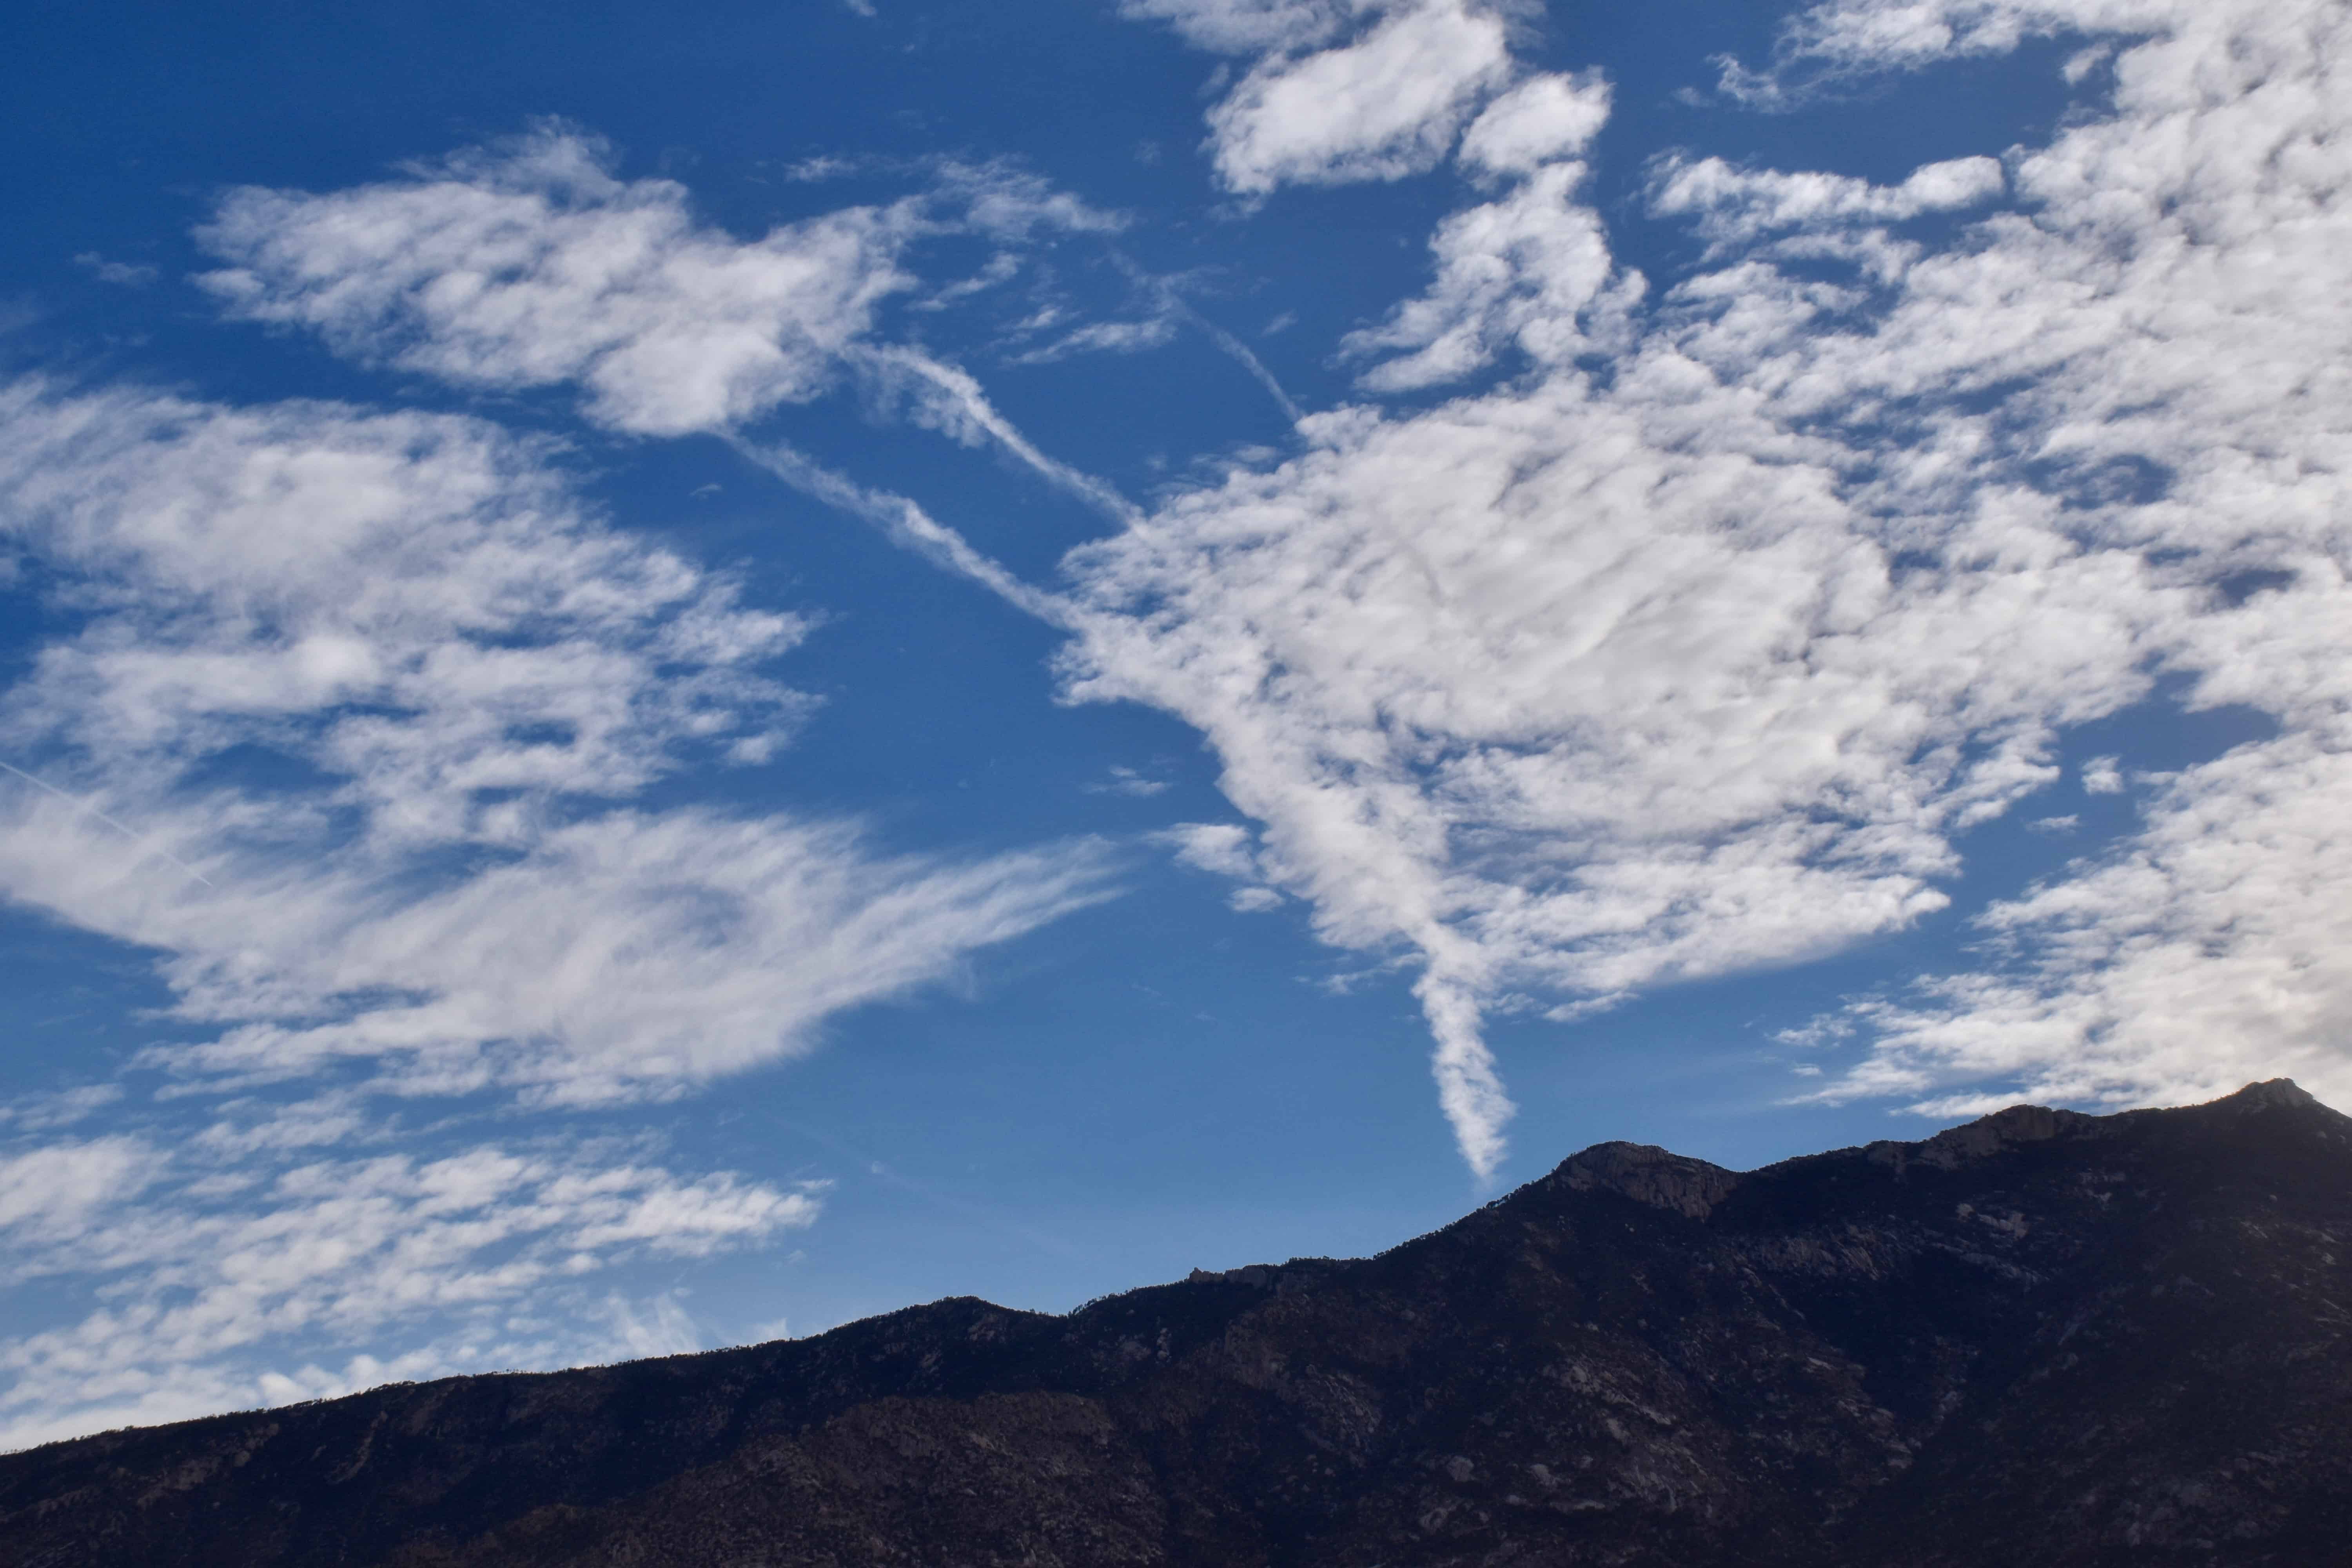
6:04 AM, 28 April. About the only lenticular seen. Oh, well, there were a few weak ones off to the north, but that was it. CIrrostratus is the higher cloud, too thin to be Altostratus.
Cloud shots will be posted later this morning of the next day….. (i didn’t get to is as I had planned)
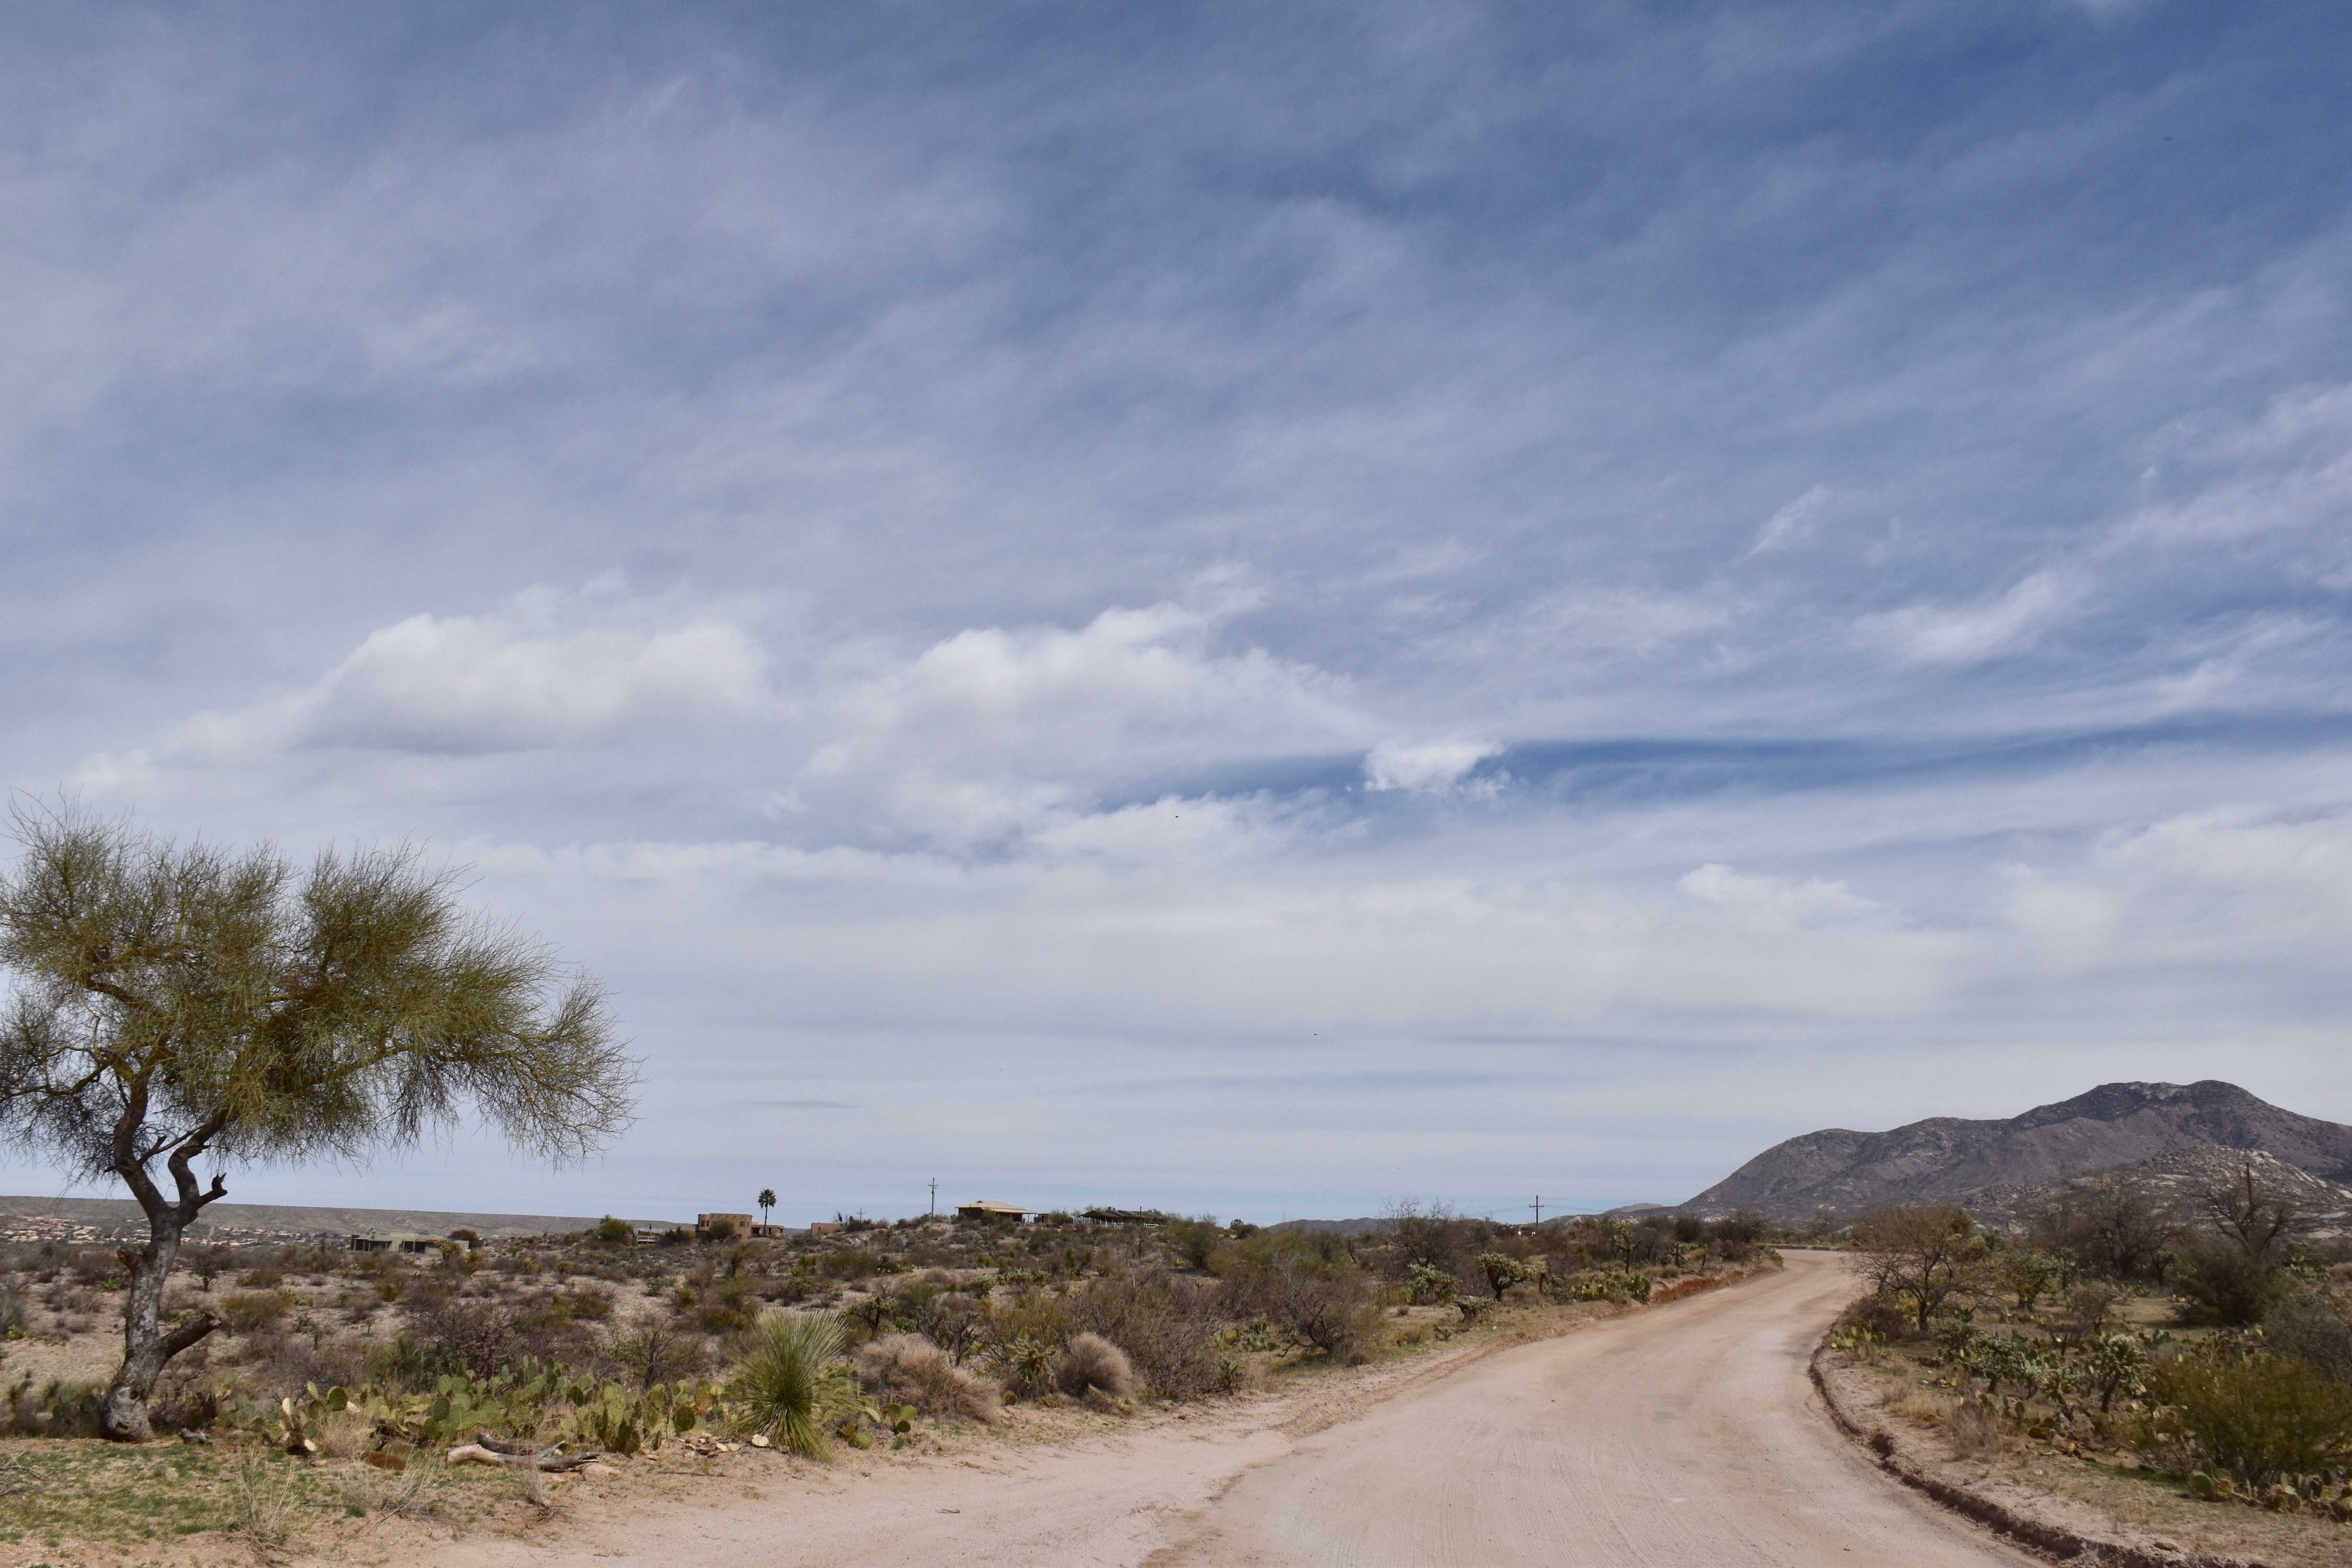
12:52 PM, April 28. There can hardly be a better shot of Stratocumulus. While it looks dark, it was partly because of the Cirrostratus or Altostratus overcast; it was that thick, not thick enough to reach temperatures where ice would form in it, and rain would come out. And no rain did, and soon this whole overcast was gone, as was the higher Cirrostratus that shadowed it.4:09 PM. No ice came out of these clouds, but they did allow those beautiful sunny highlights on our Catalina Mountains.4:40 PM. Its remarkable how after weeks and weeks of no rain that so much of our mountains and desert vegetation remains as green as it is.
Yesterday afternoon, the 29th. Here’s what shallow, icy clouds look like, reflecting the unusually cold air above us.
4:44 PM, April 29th.5:43 AM this morning. In an unusually timely post, here’s a leftover ice puff from yesterday over there beyond Charouleau Gap. You’d be guessing, if you cared, that the tops of both of these icy clouds was colder than about -20° C (4°F) since there seems to be so much ice.
The End
PS: Chance of rain still holding for the 8th. See below for new depiction of big “cutoff” vortex over AZ from last evening’s model run:
Haven’t had much to say, brain pretty empty again after the big review of the NAS 2003 review which really needed reviewing and commenting on real bad….
(More “late homework” in the offing.)
———————-
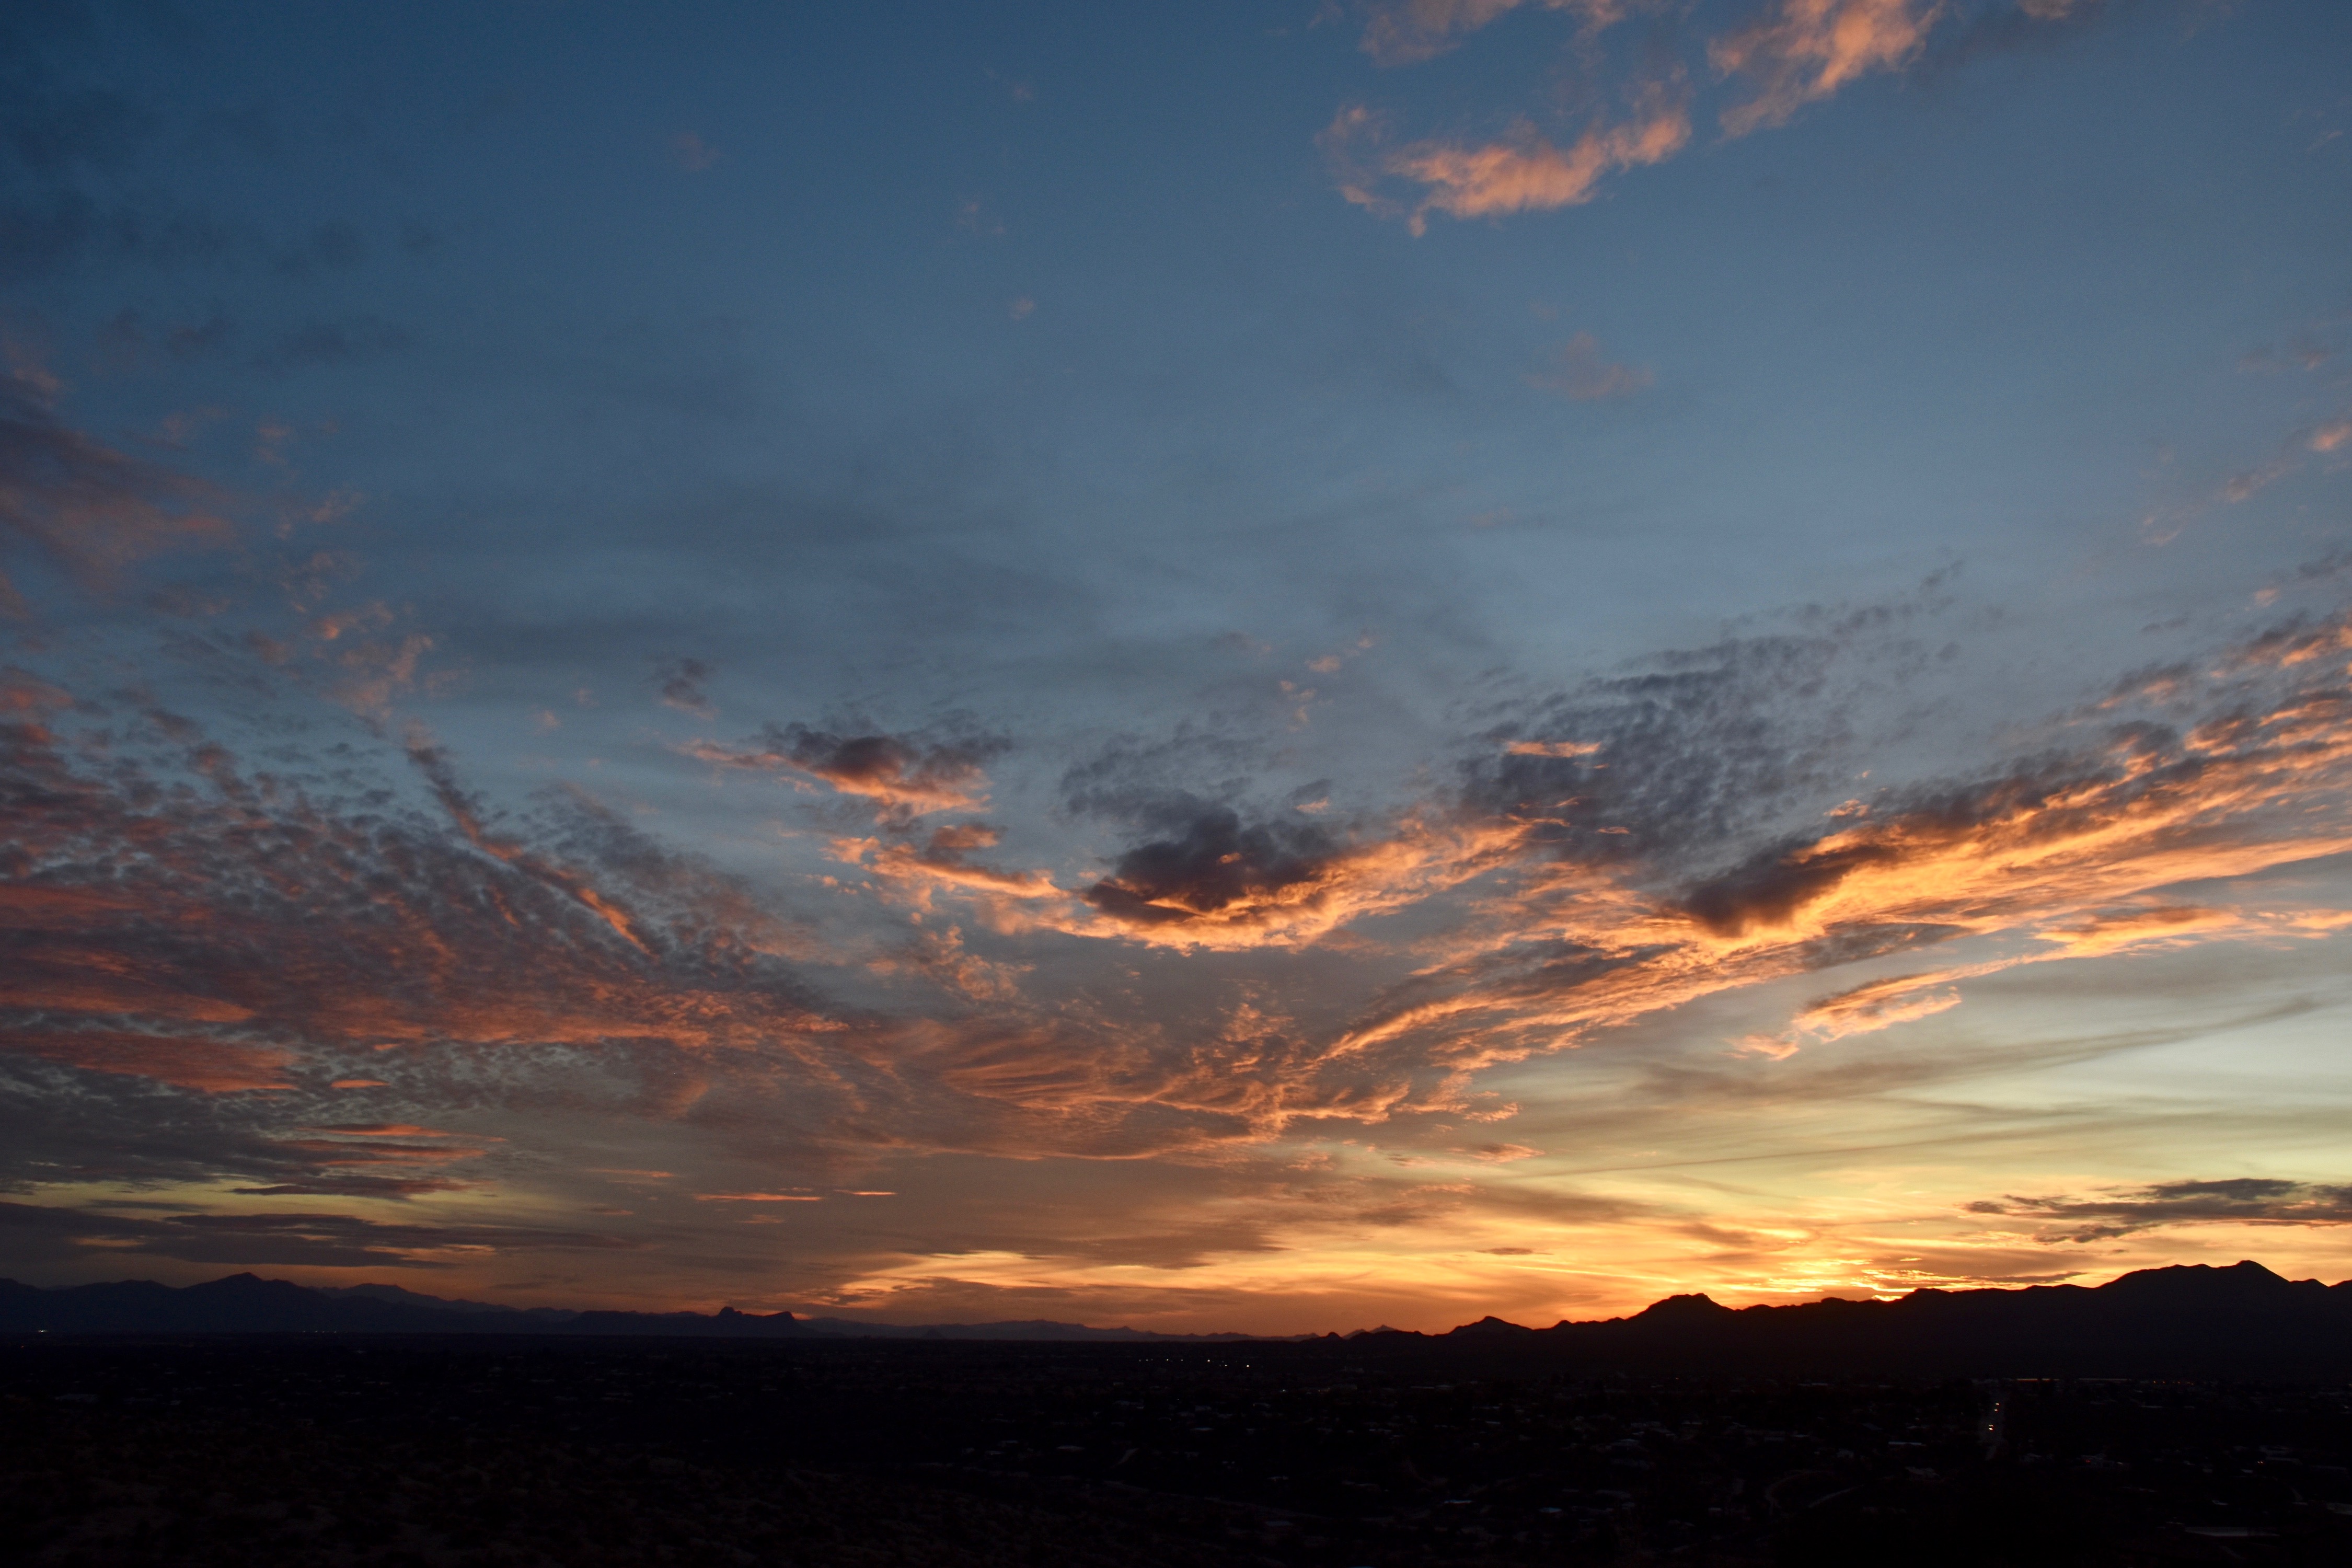
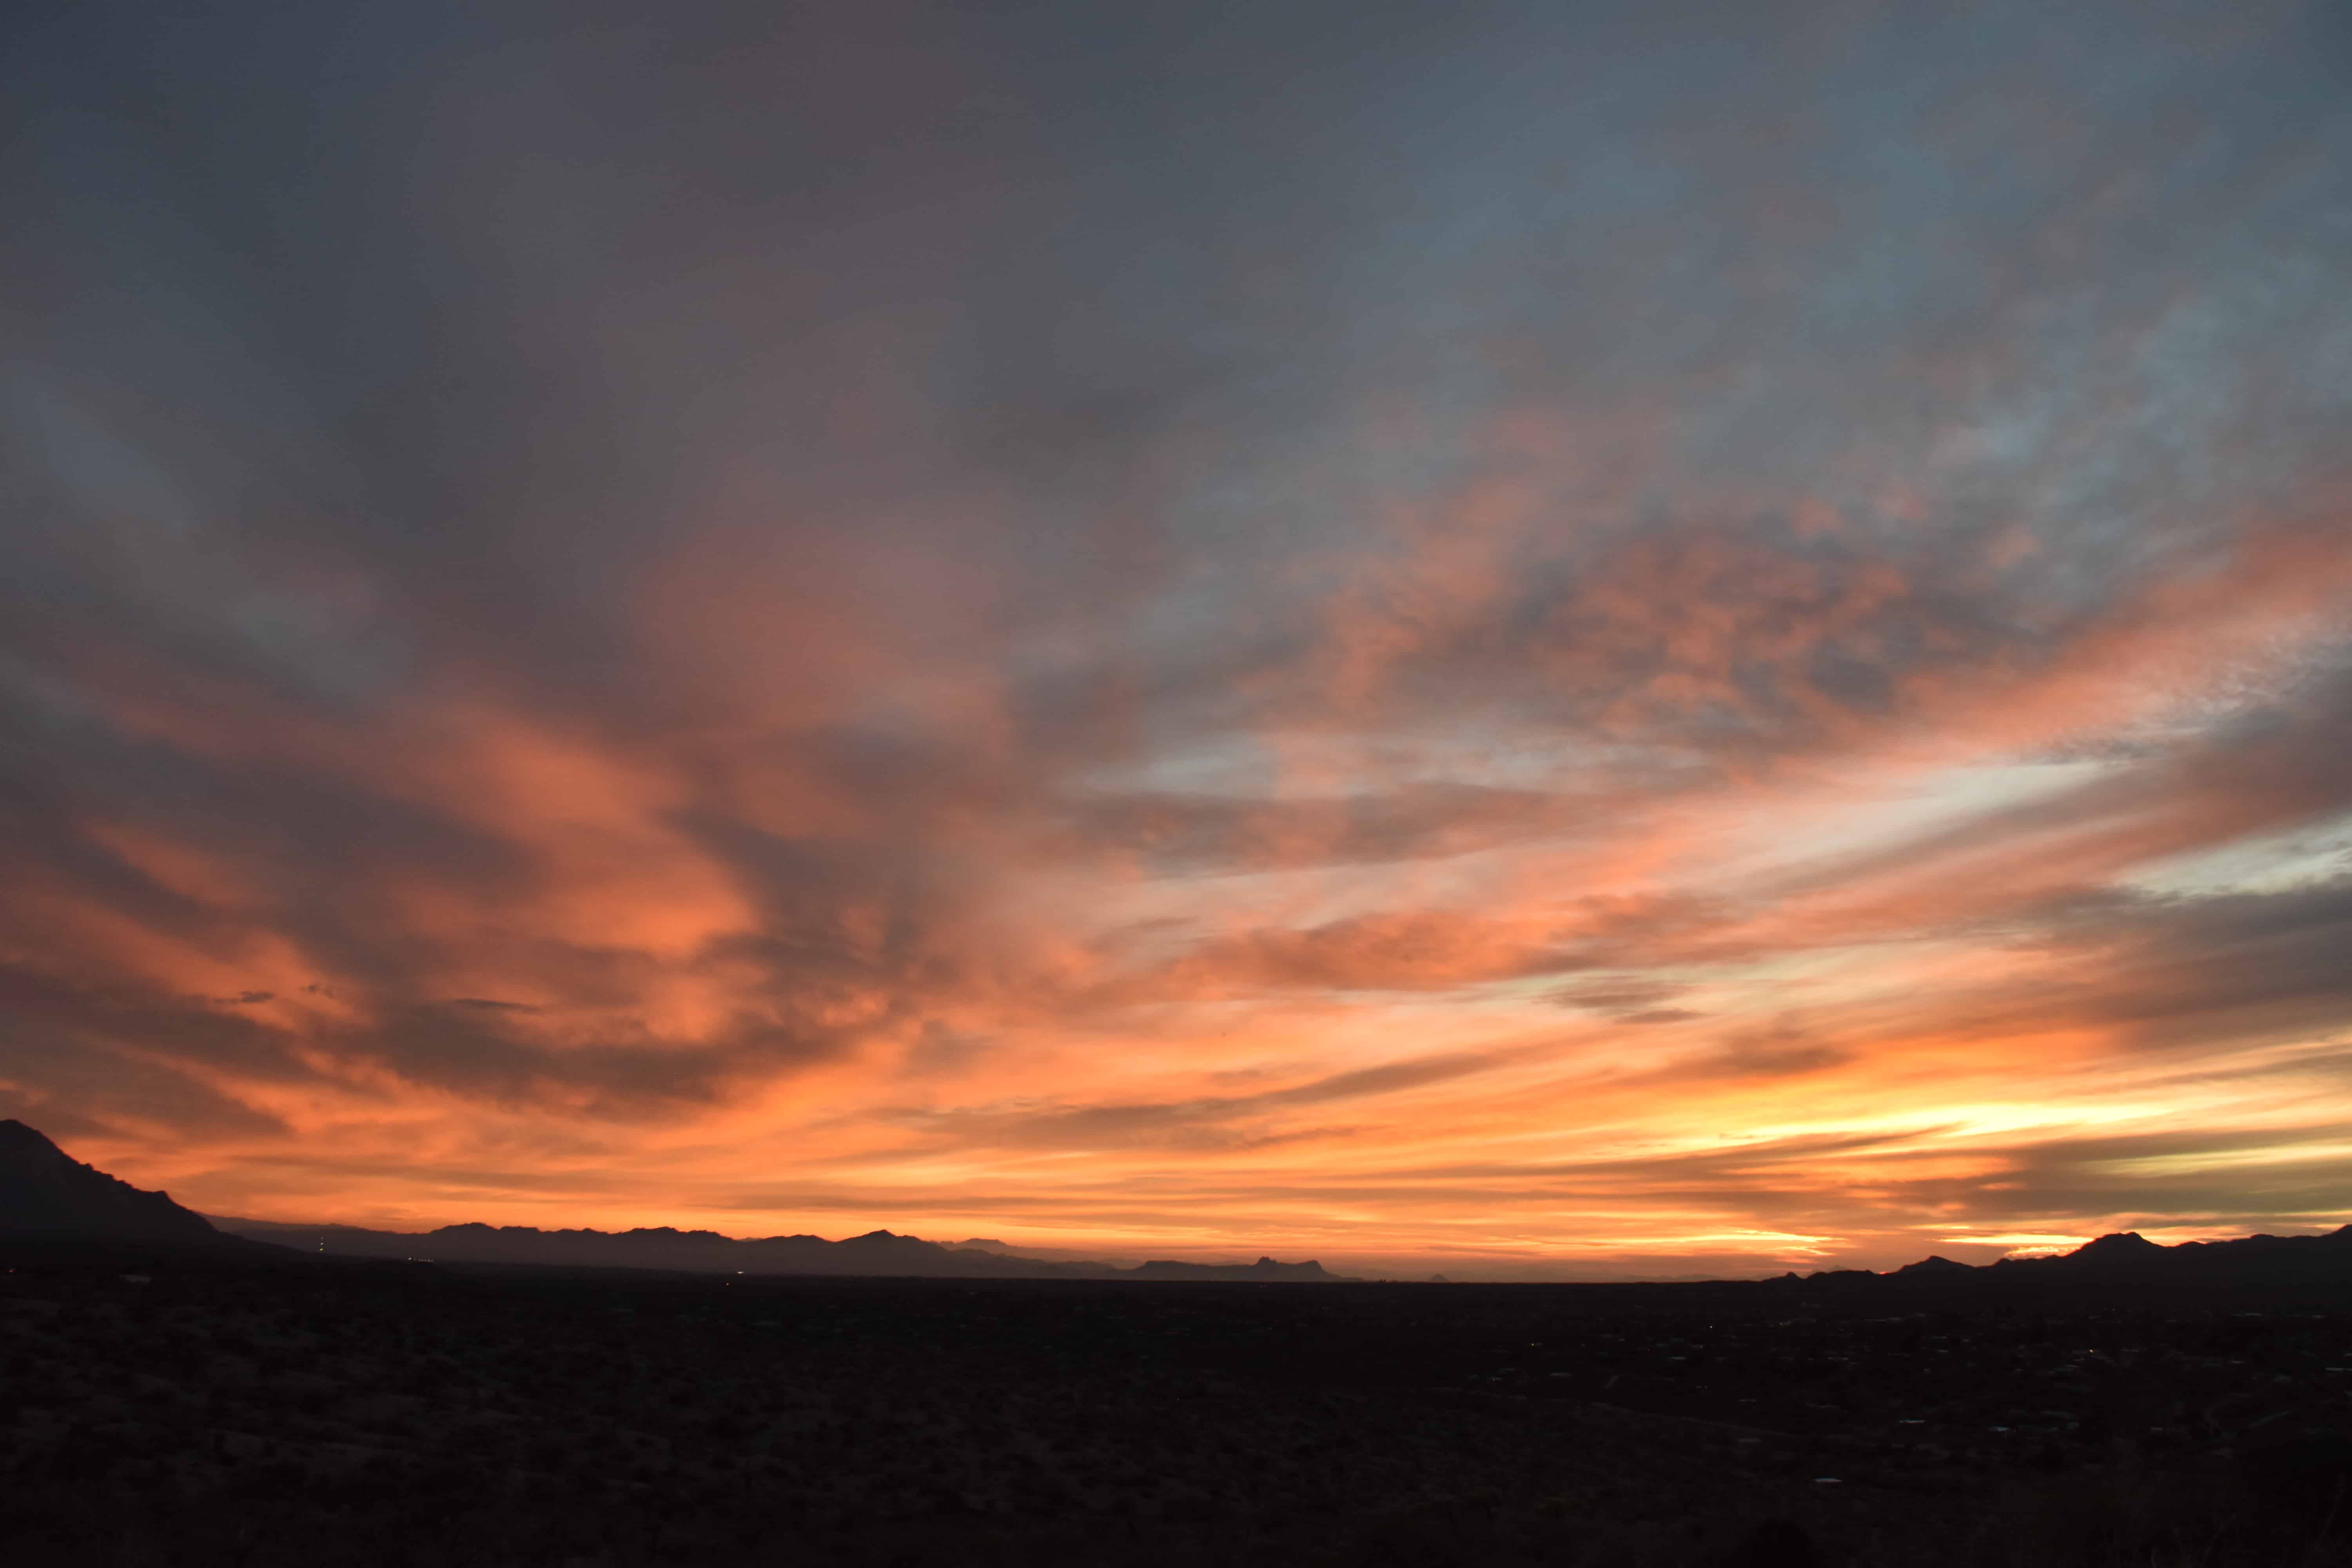
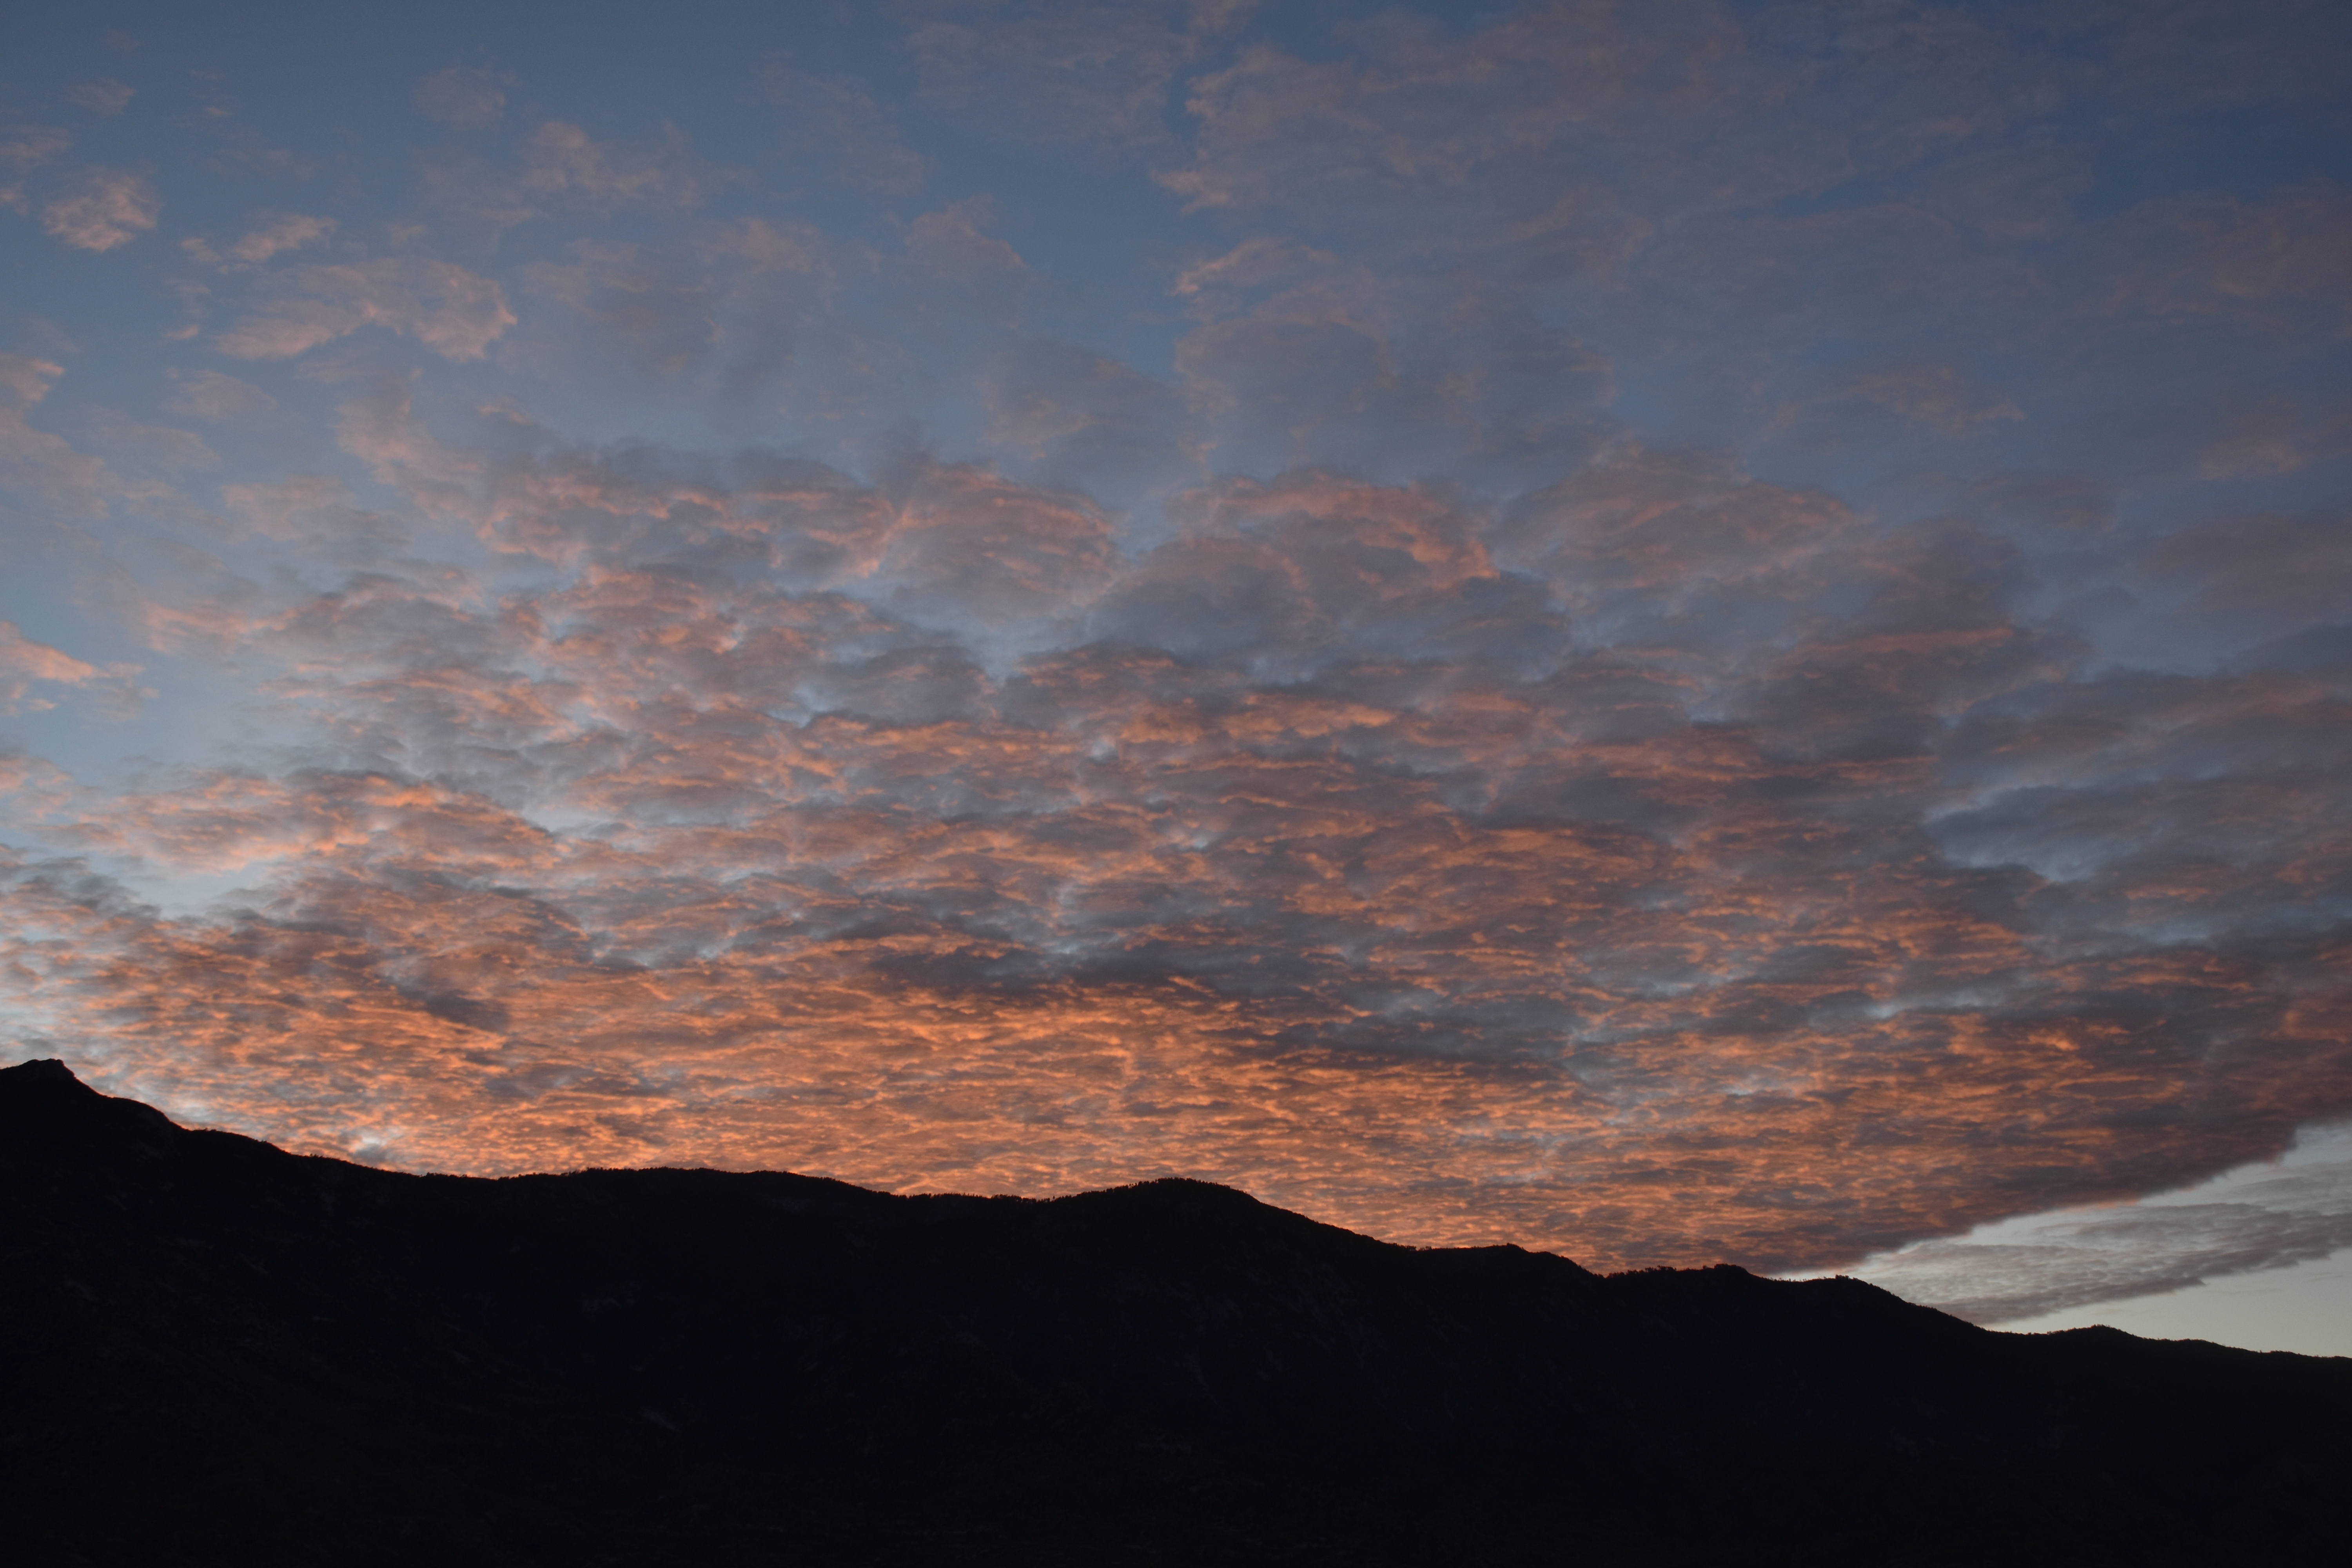
Nice sunset last night; we have had a series of pretty nice ones over the past few days.
April 26th. Sunrise over the Charouleau Gap.Orangy mountains highlighted by a gap in the Altostratus layer that allowed the setting sun to shine through.7:04 PM. There was some turreting in this line of Altostratus that passed over, and because of those deeper tops, indicating stronger, if still slight updrafts, larger snow particles developed and produced this line of heavier virga underneath it.7:10 PM.A contrail that’s more than about ten minutes old, now, after the new Int. Cloud Atlas has been released, termed, Cirrus anthrogenitus, maybe castellanus in this case, too.
From IPS MeteoStar, this interesting map for tomorrow morning.
The orangy colors denote the strongest winds in “Jetty Jetstream”, and as you know, the colder, low clouds, ones capable of reaching the temperatures where ice forms, are contained within that ring of strongest winds at this level (500 mb). So, while the models I have looked at so far have no rain here, I think there’s a pretty good chance of a rogue shower tomorrow morning anyway. At least there should be some nice Stratocumulus/Cumulus tomorrow and some will have ice in them. As you know, it’ll be awful windy today, too, maybe 40 mph or so in brief gusts here in The Heights of Sutherland.
Also will be looking for some nice lenticulars since “Jetty” will be right over us, but a little toward the warm side where lenticulars mostly occur.
Map valid for tomorrow morning at 5 AM AST.
In the meantime, spaghetti suggests a big trough in our area again about nine days from now. The later ACTUAL model outputs don’t show much of anything. What’s up with that? I’m hanging with spaghetti that later model runs will indicate a strong trough, and at LEAST another pulse of cooler air, and another minor chance of rain as we are going to see today and especially tomorrow as when become within the “ring of winds” aloft. Didn’t Johnny Cash sing something about that? Maybe it was Wall of Voodoo…
Below, some spaghetti for you showing a big trough over Arizona and the Great Basin which is not much reflected in the actual models, as noted. But, just watch my friend, how those model outputs will change to reflect a bigger trough about this time!