No, this is not about Bonanza, the TEEVEE show, “Hoss”, or any of those ranching people, though that might be more interesting than a blog about clouds, gray ones. First of all, the word, “bonanza” would be capitalized (its not on my view of this edit, FYI) if this was a blog about it. Second, there was no “Bonanza” episode about Stratocumulus and drizzle, another clue.
Your cloud diary, for those of you still reading this blog:
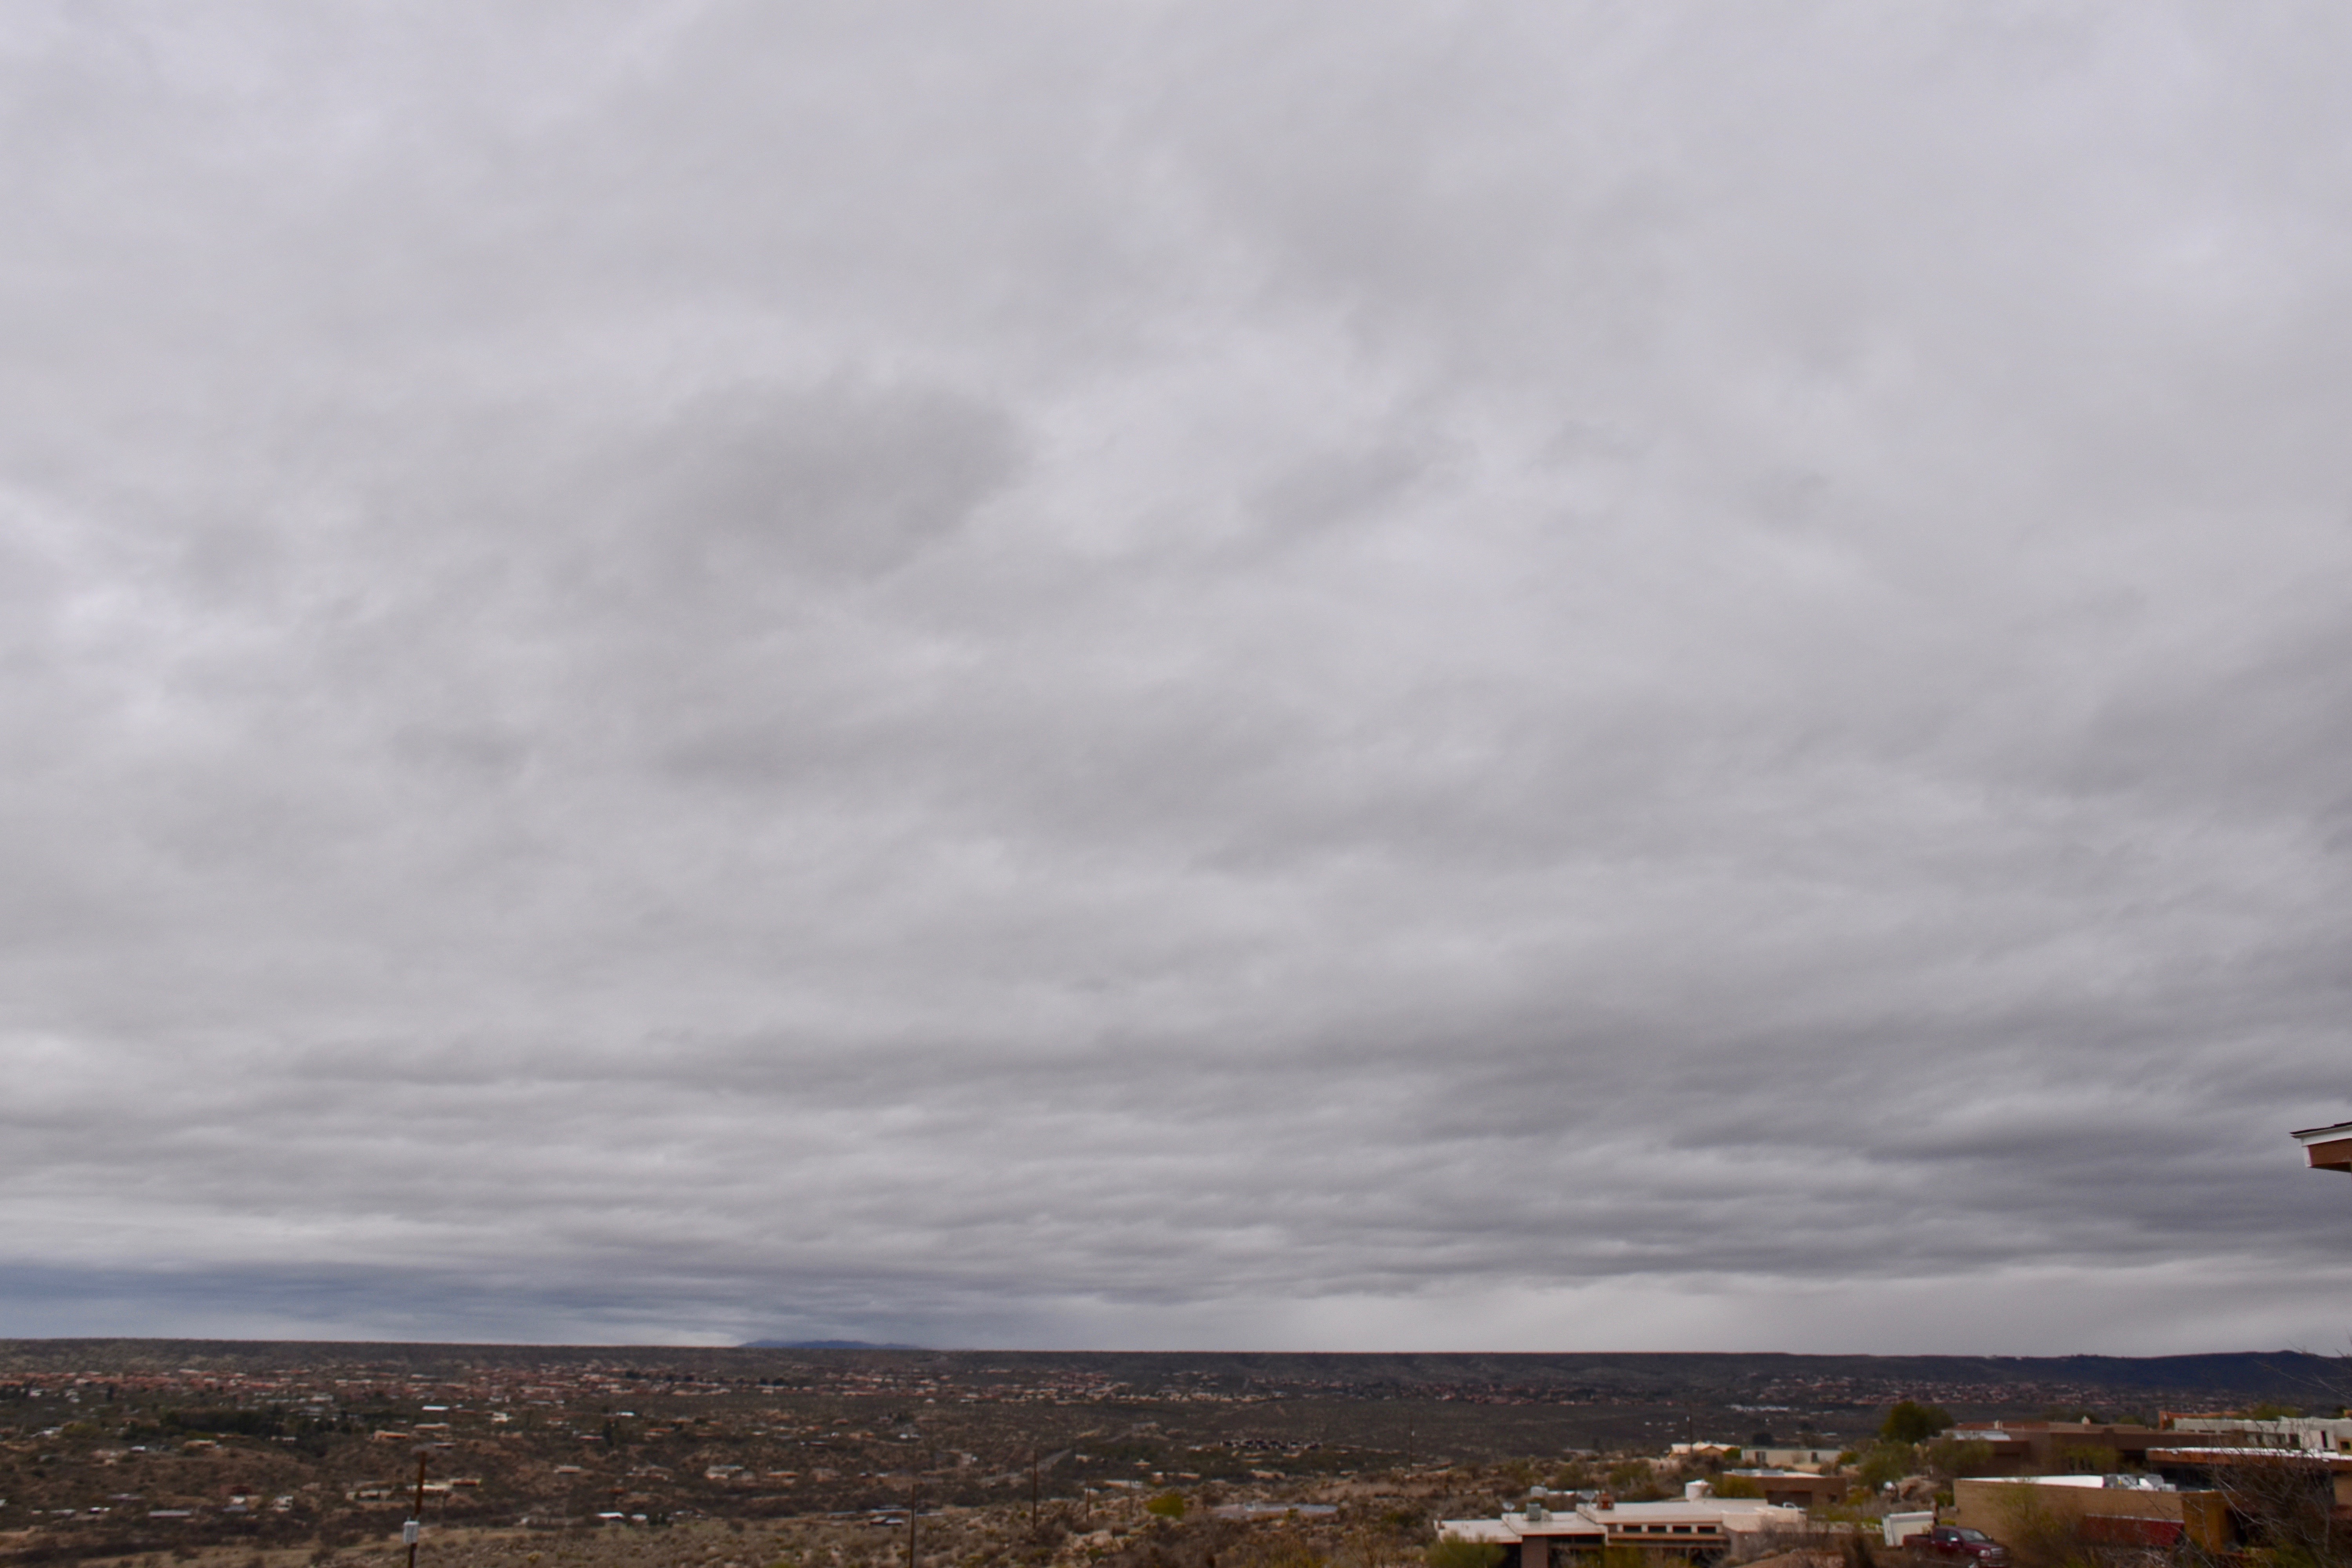
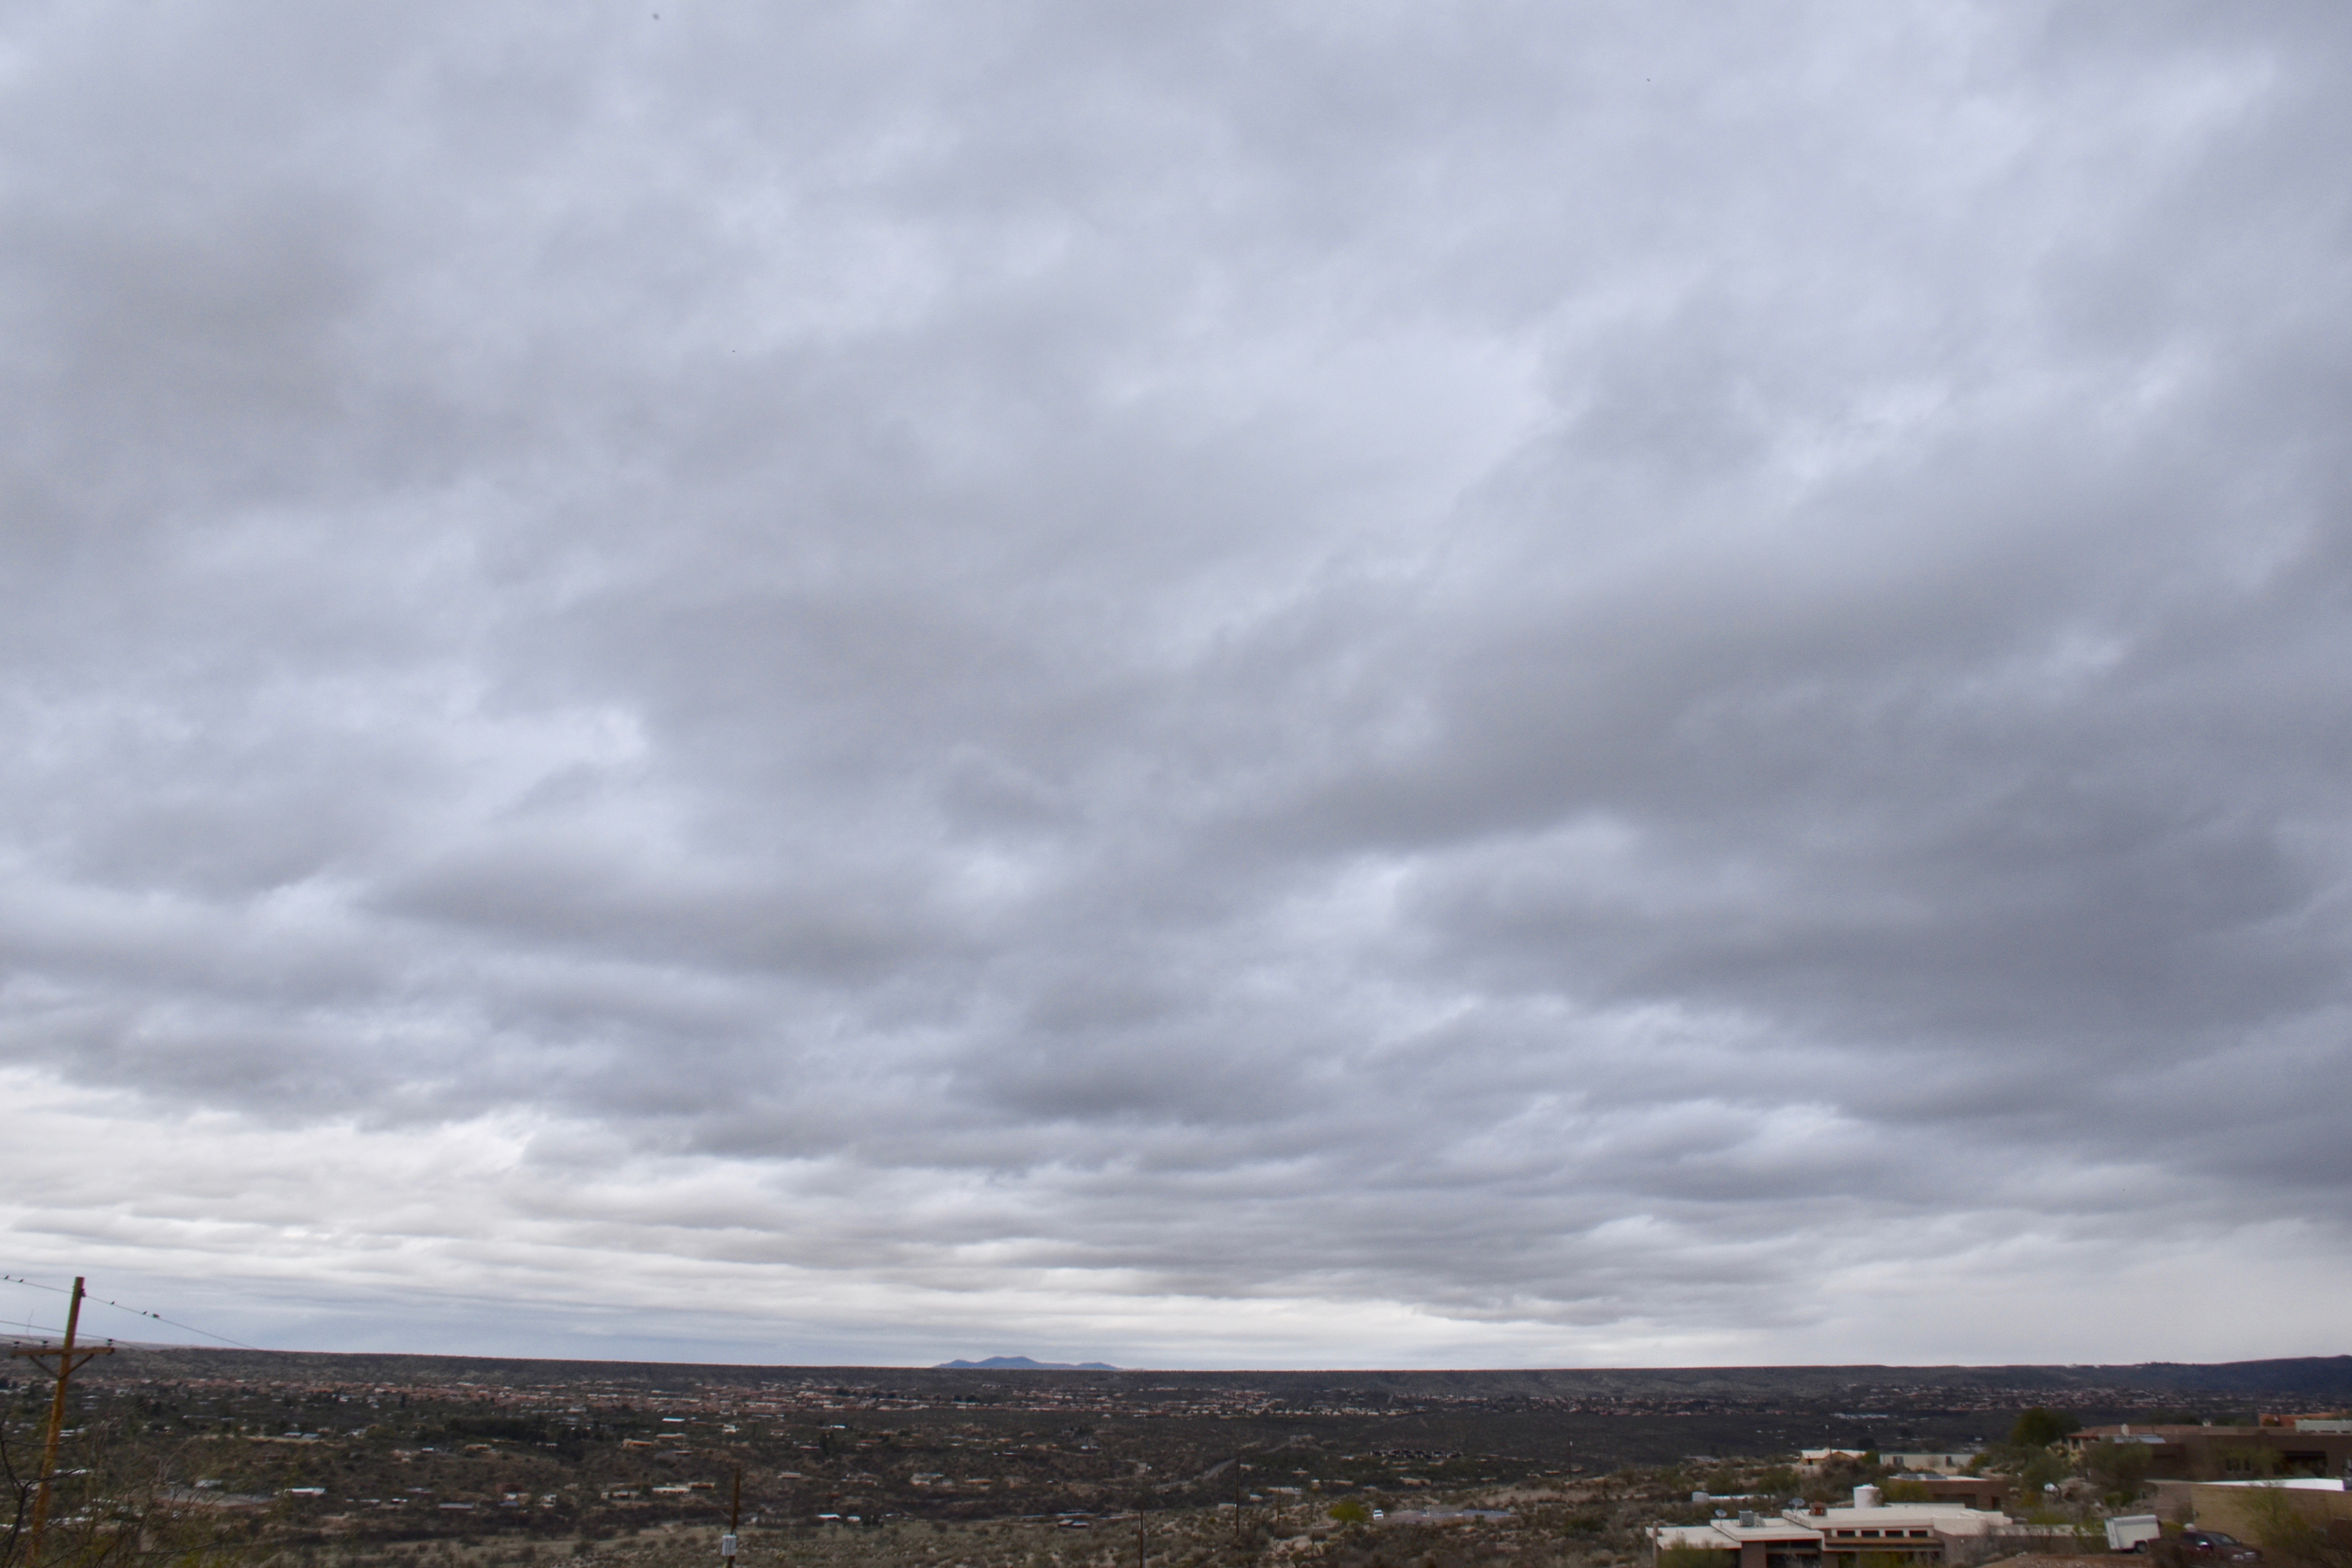
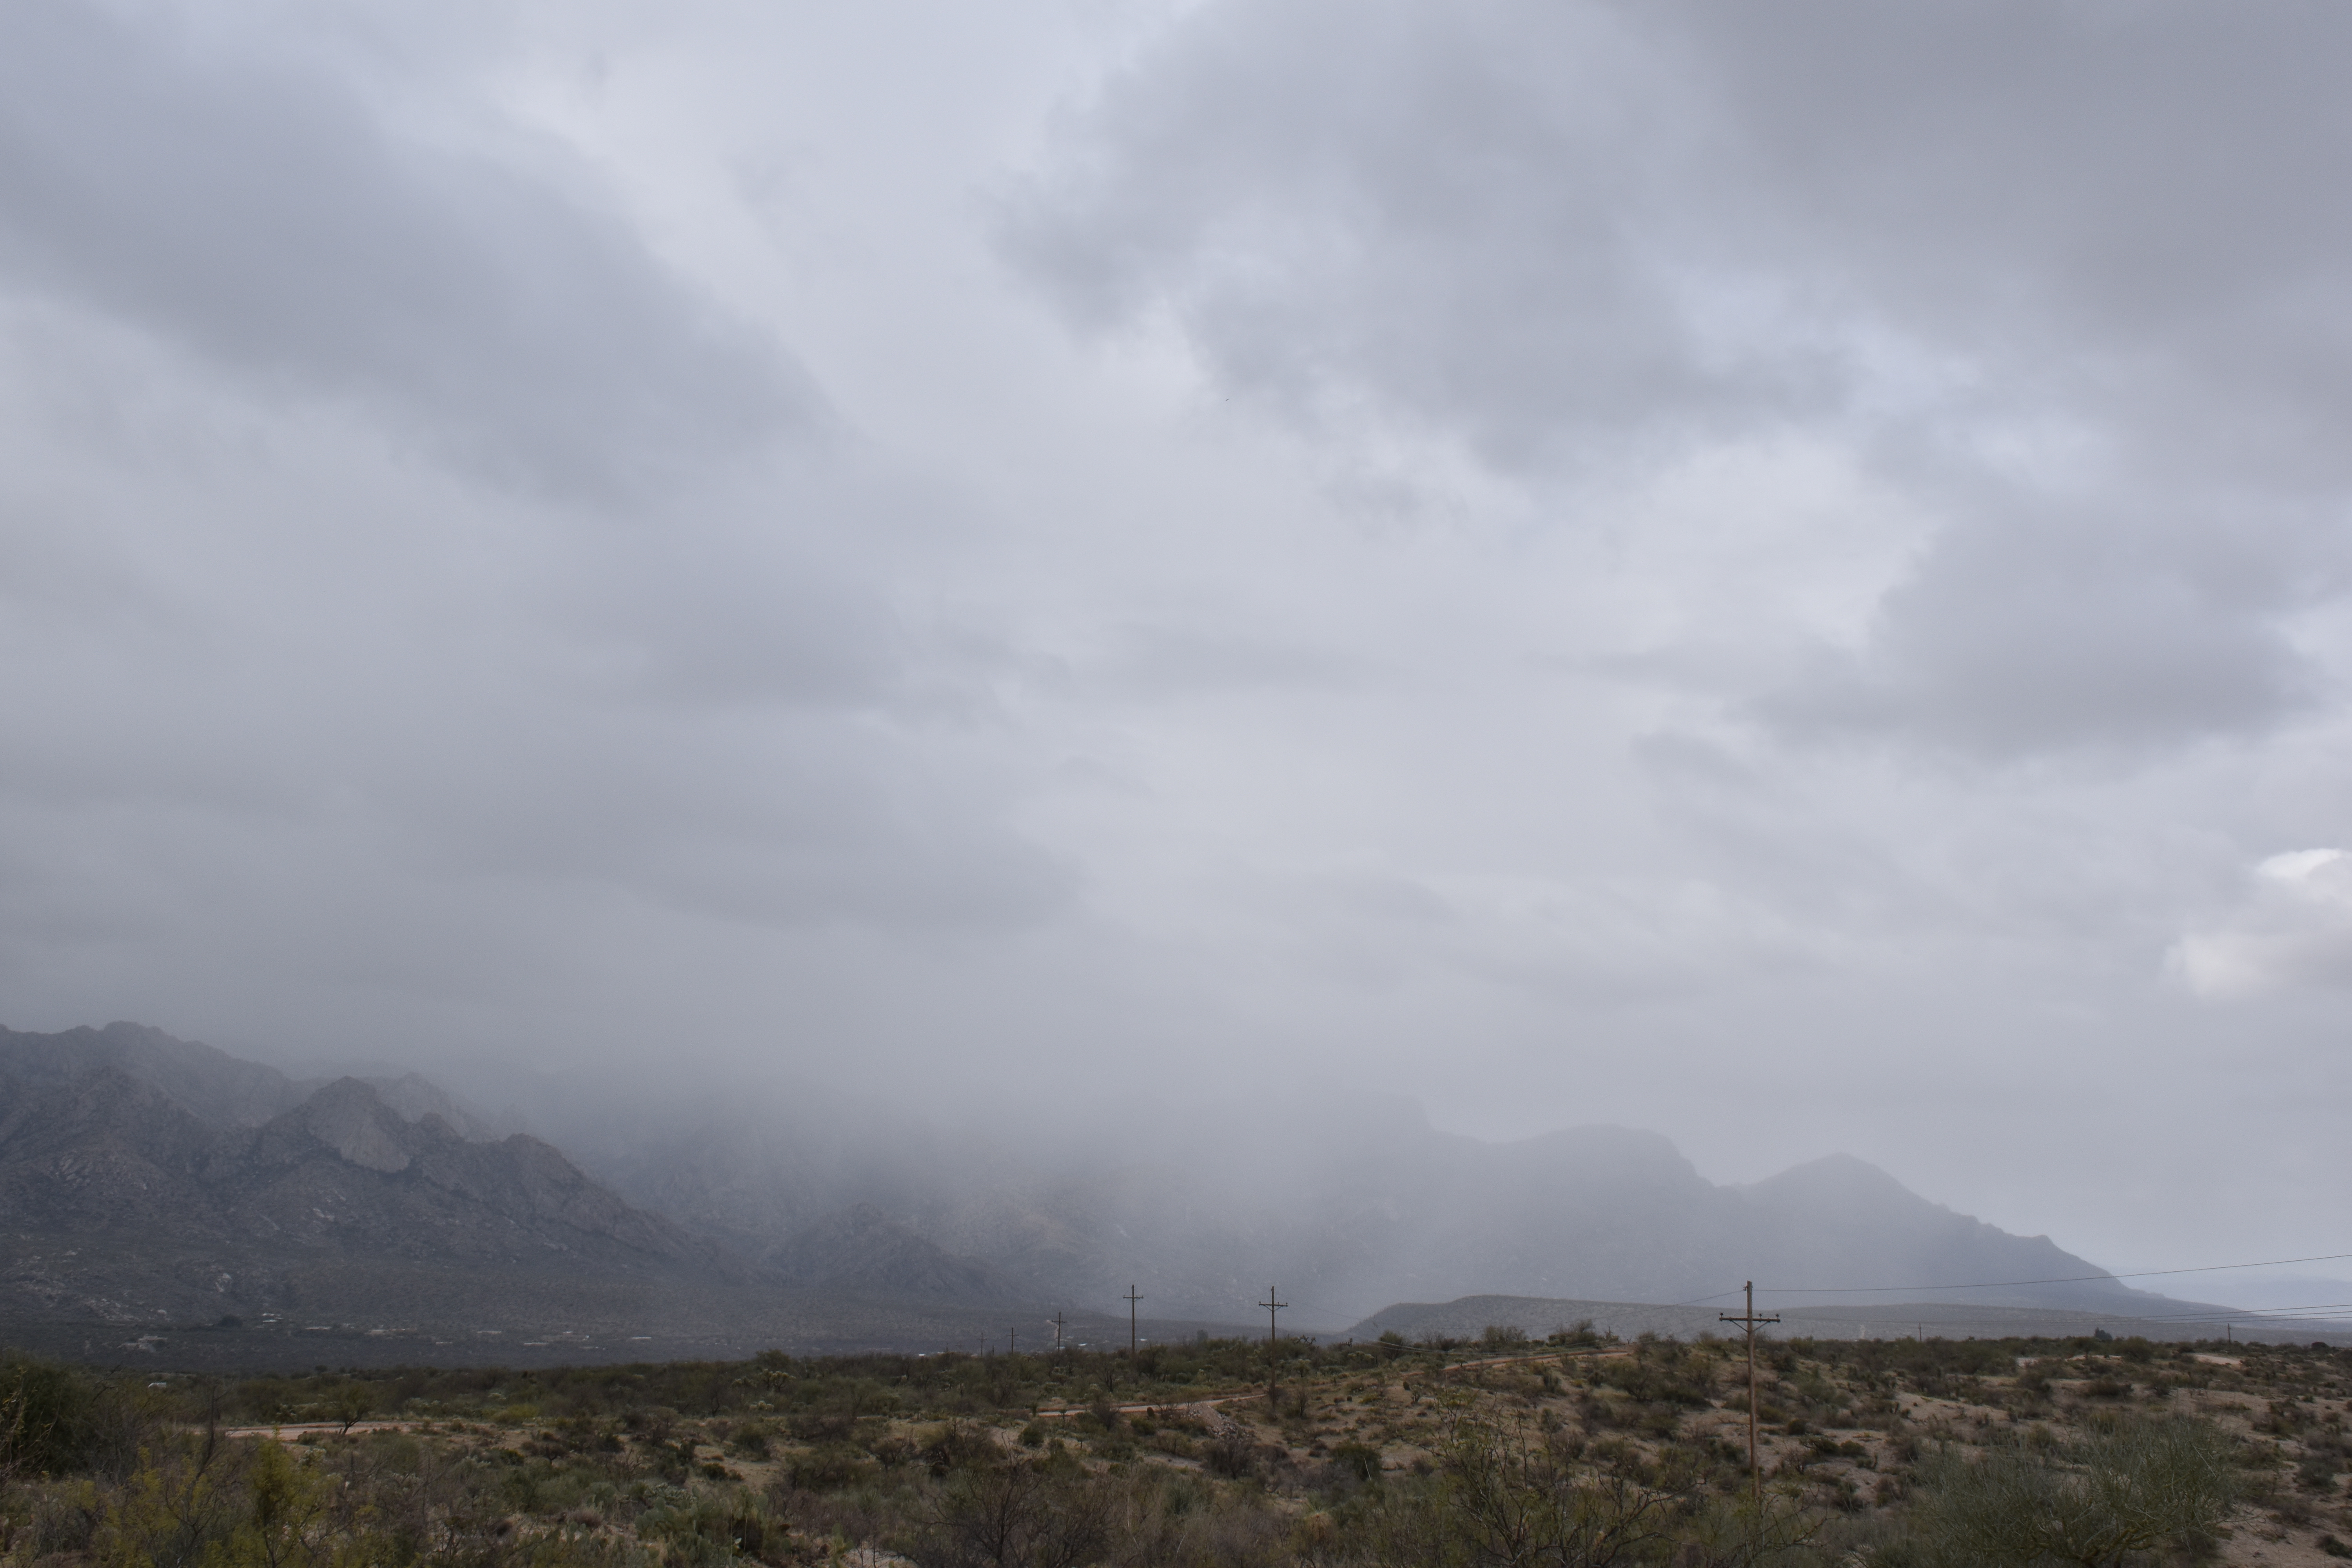
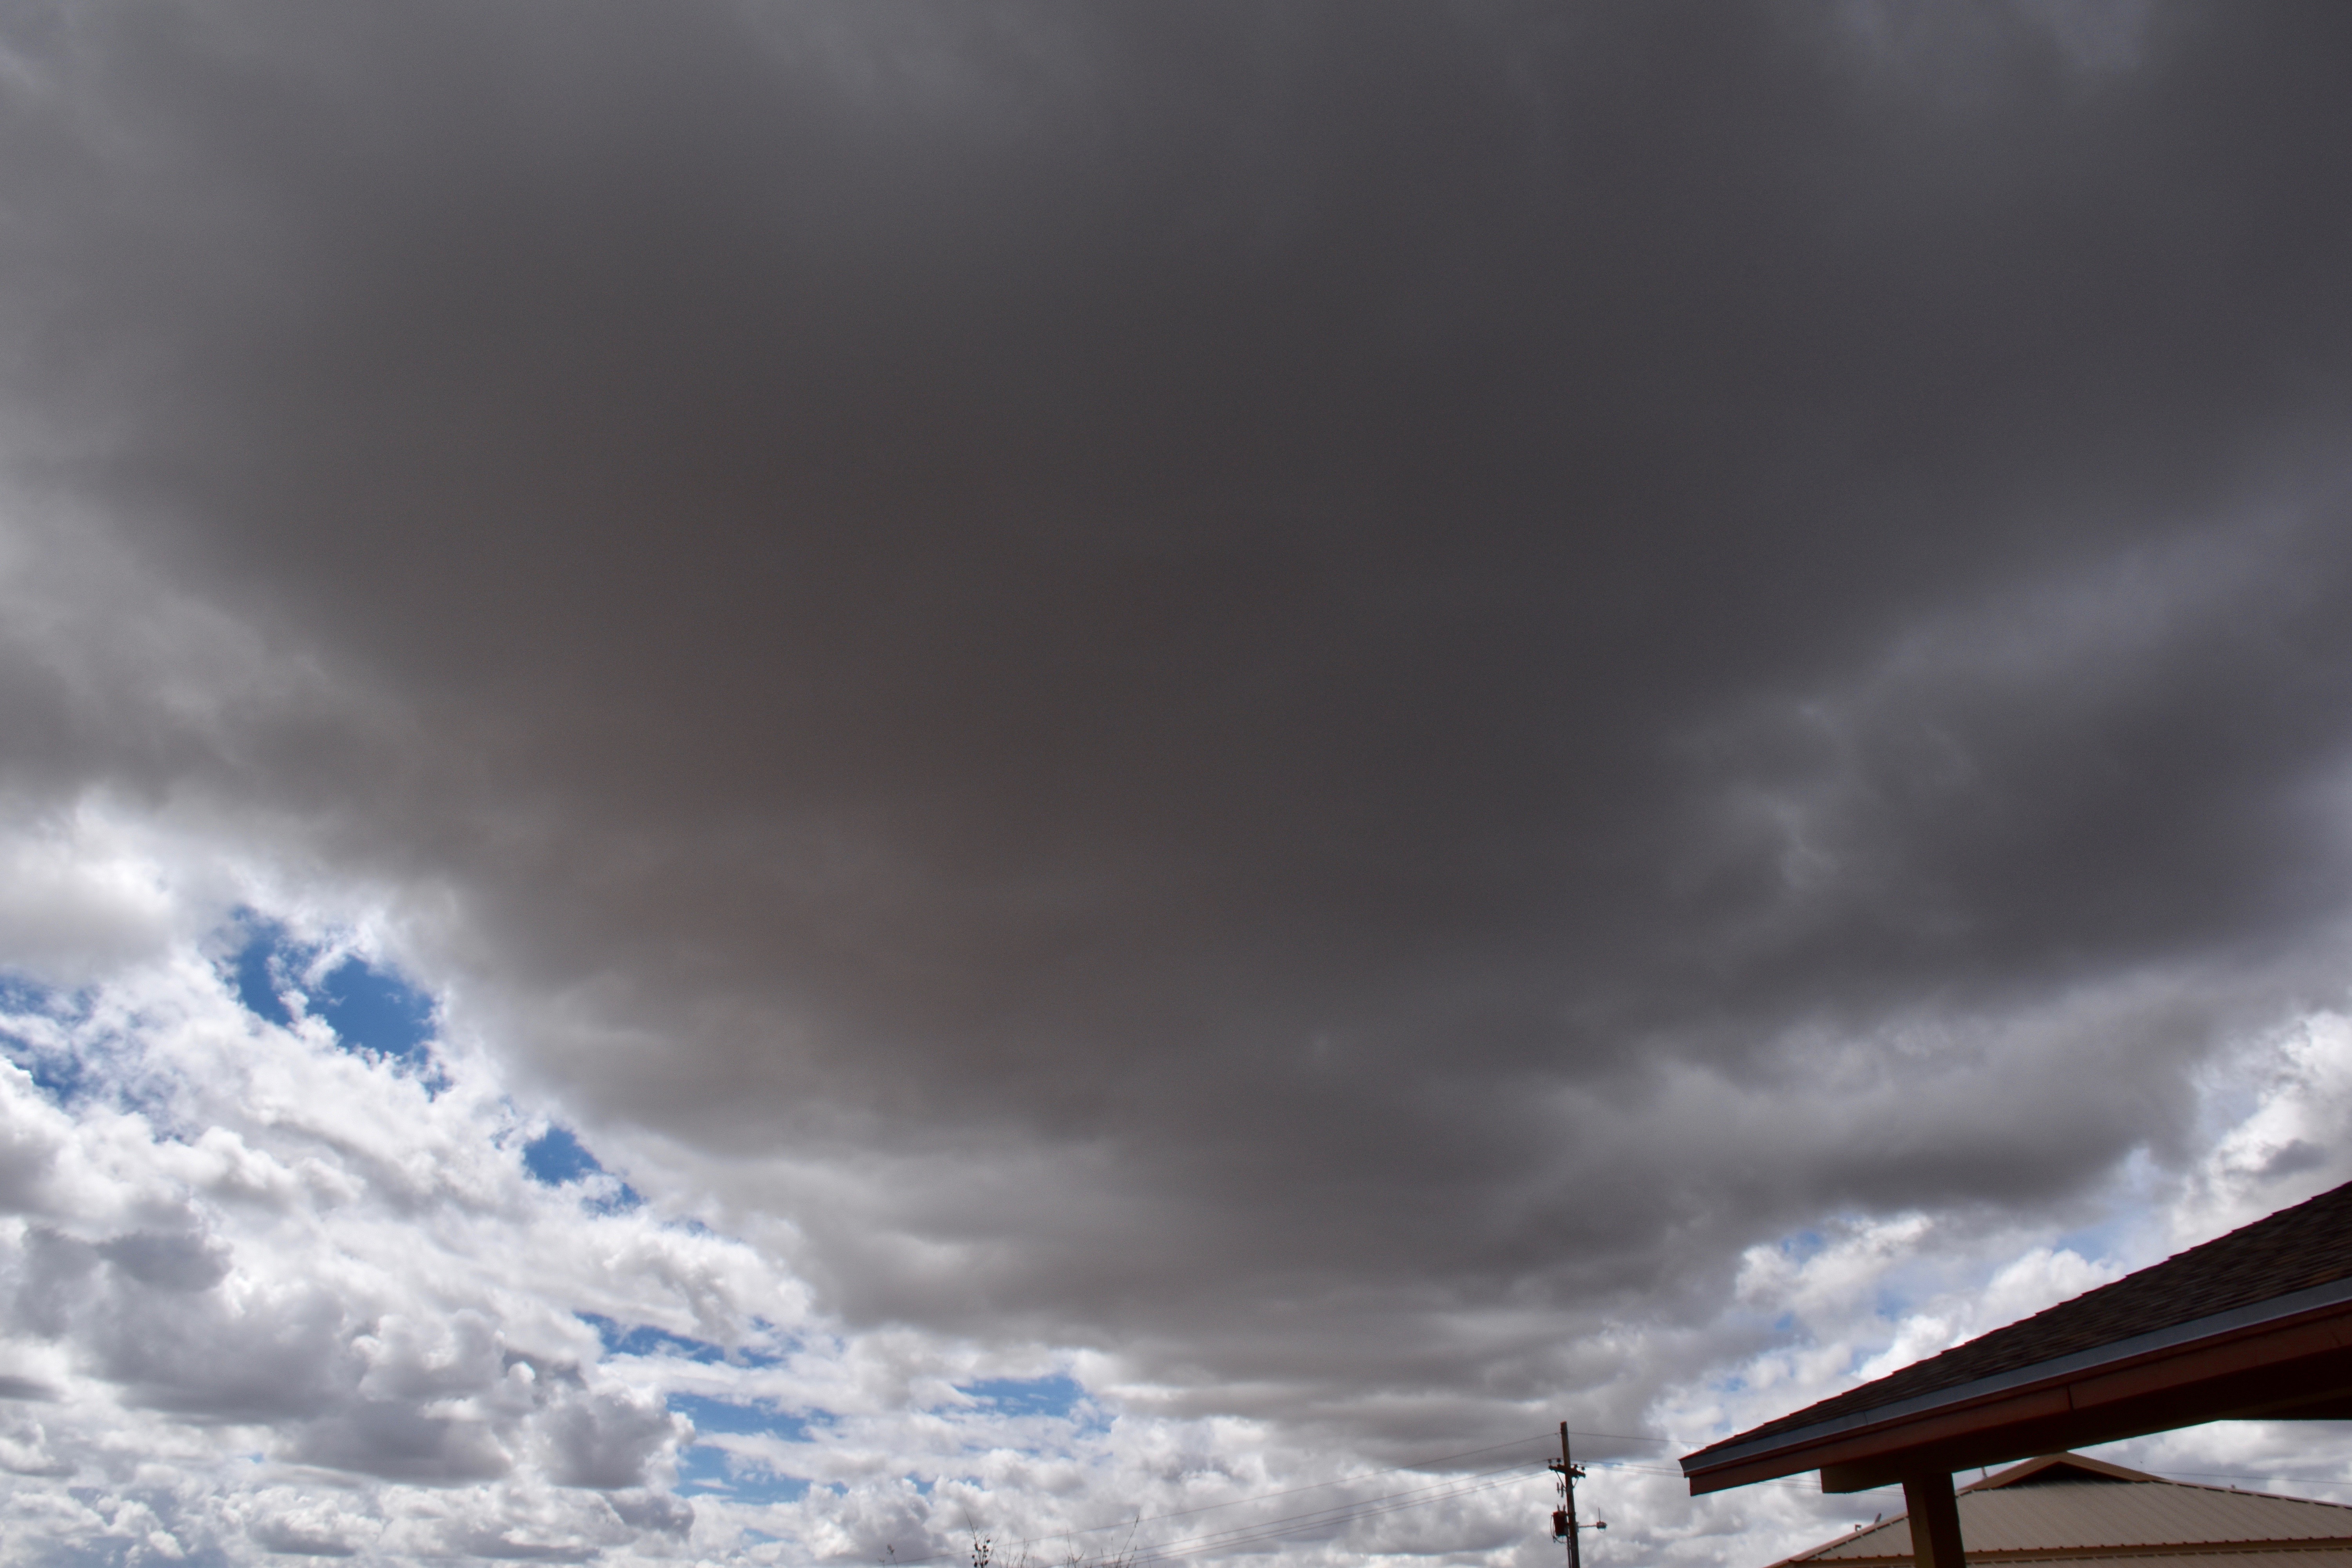
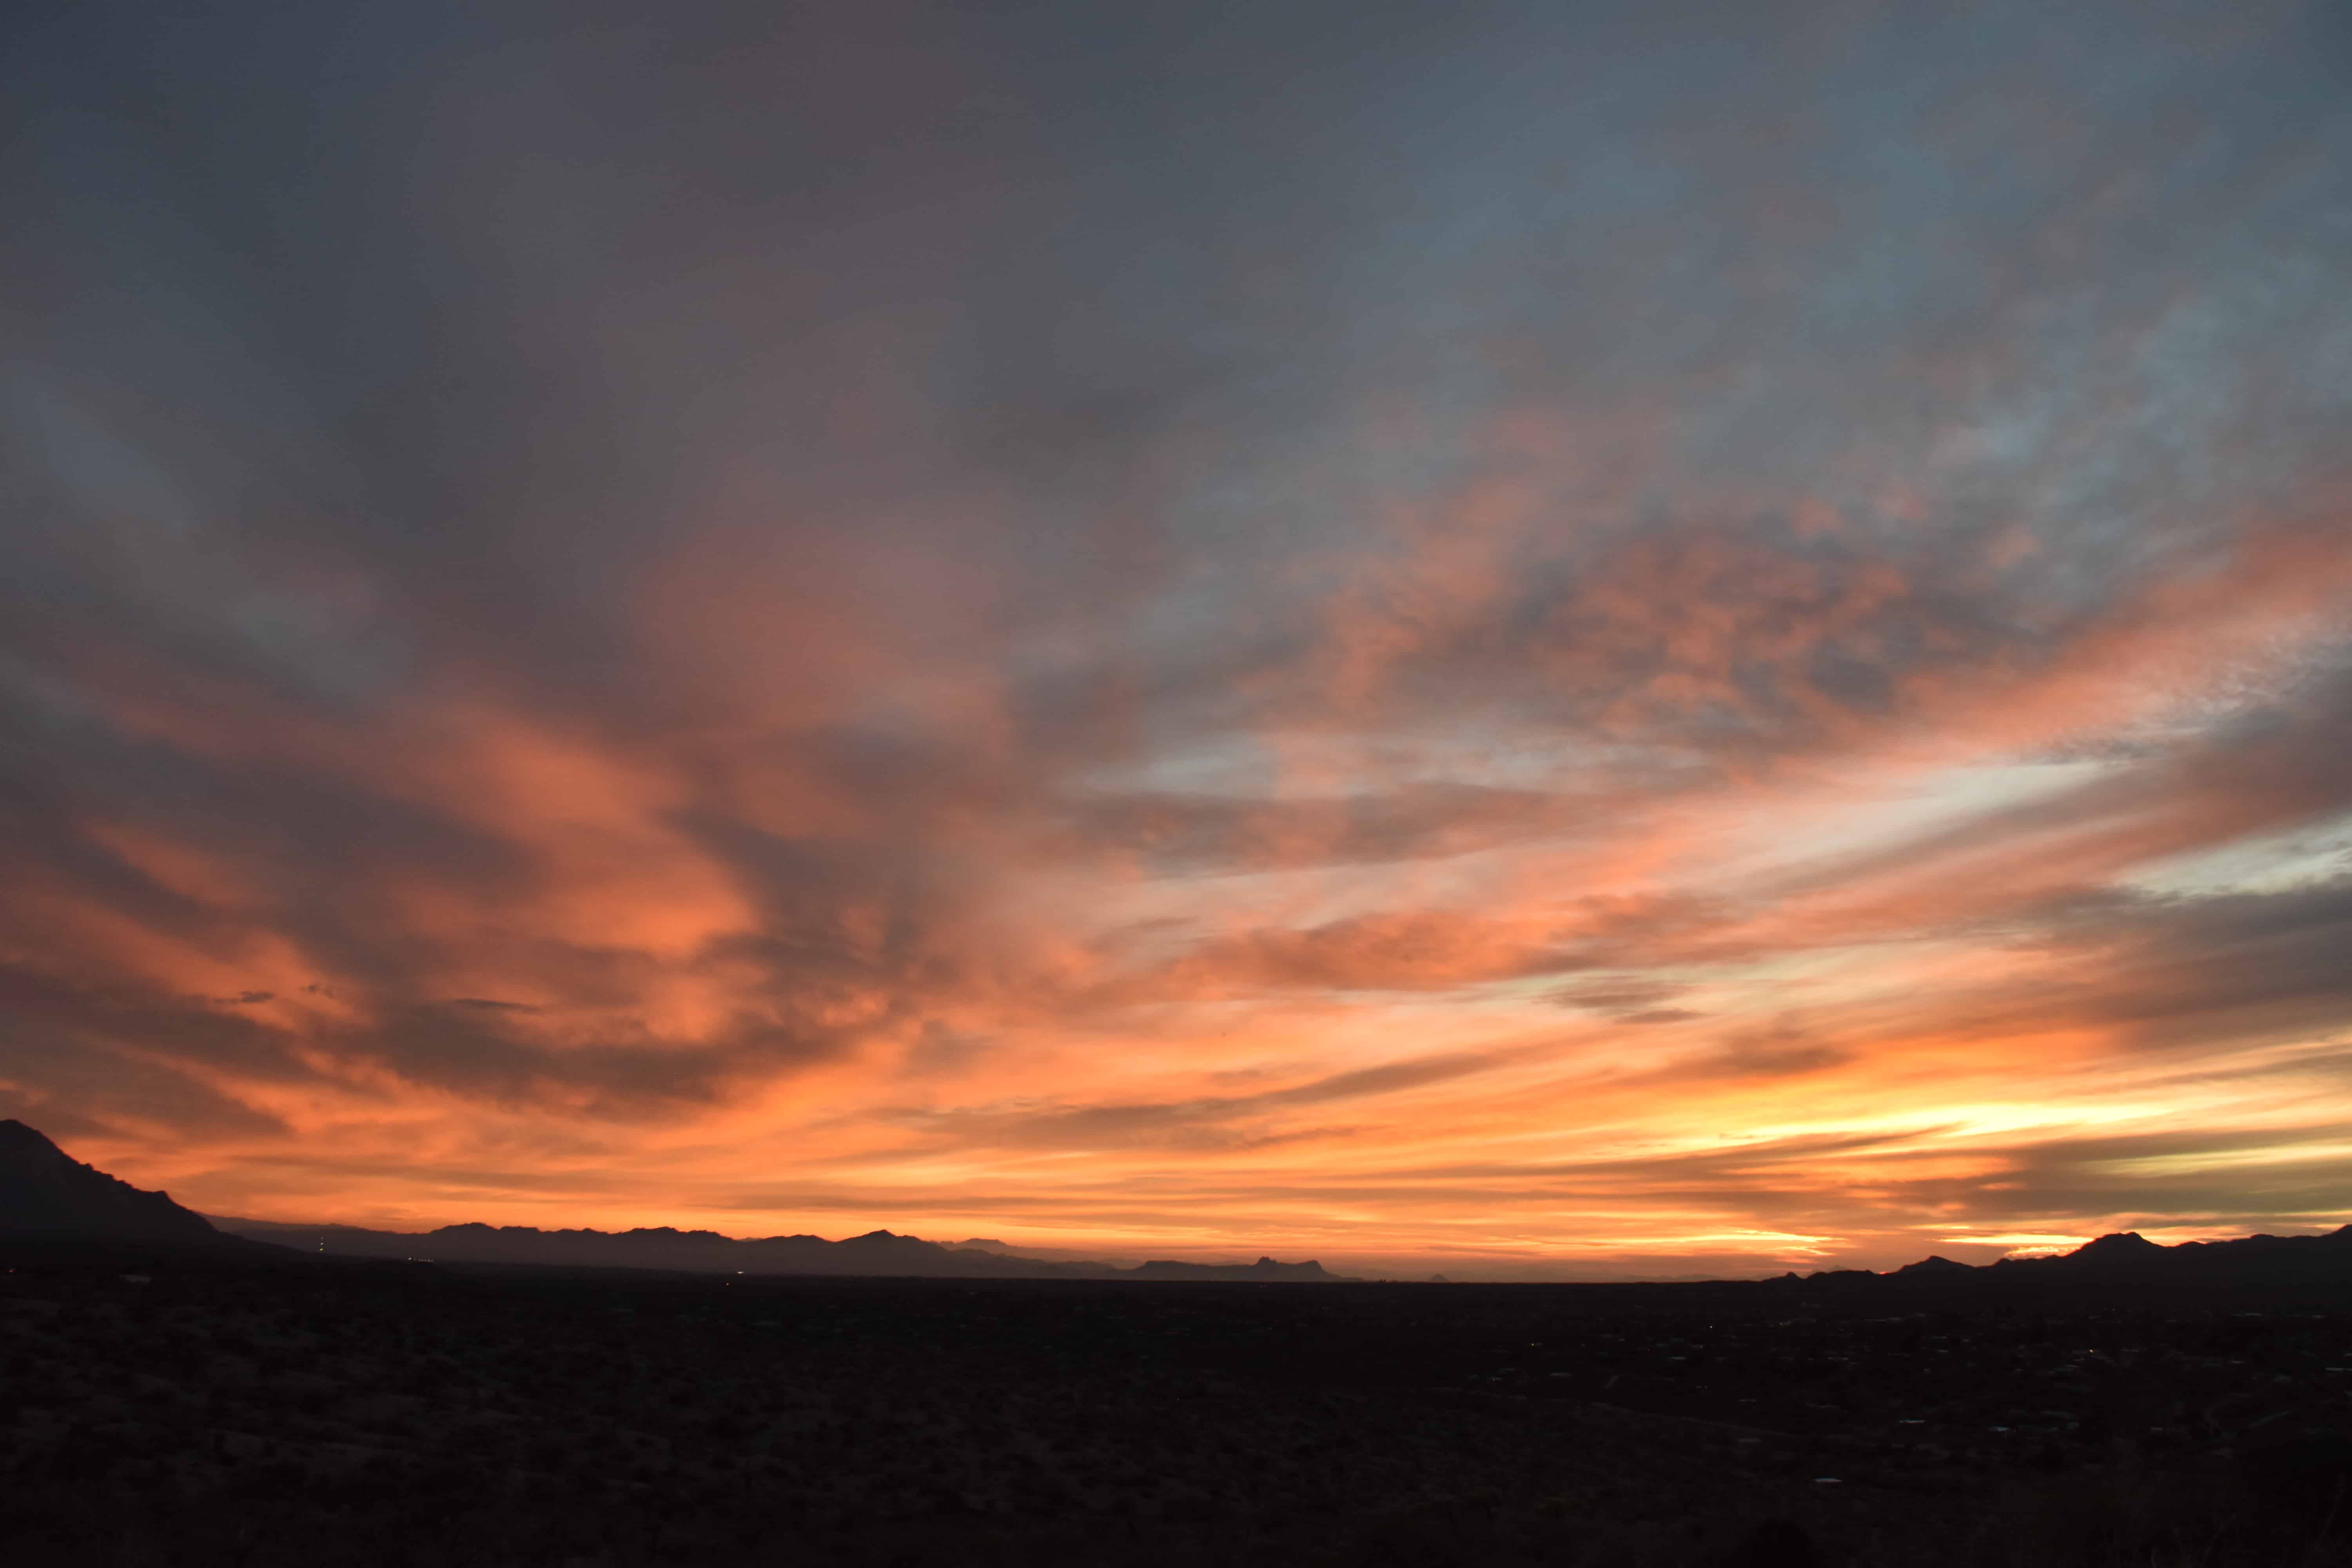
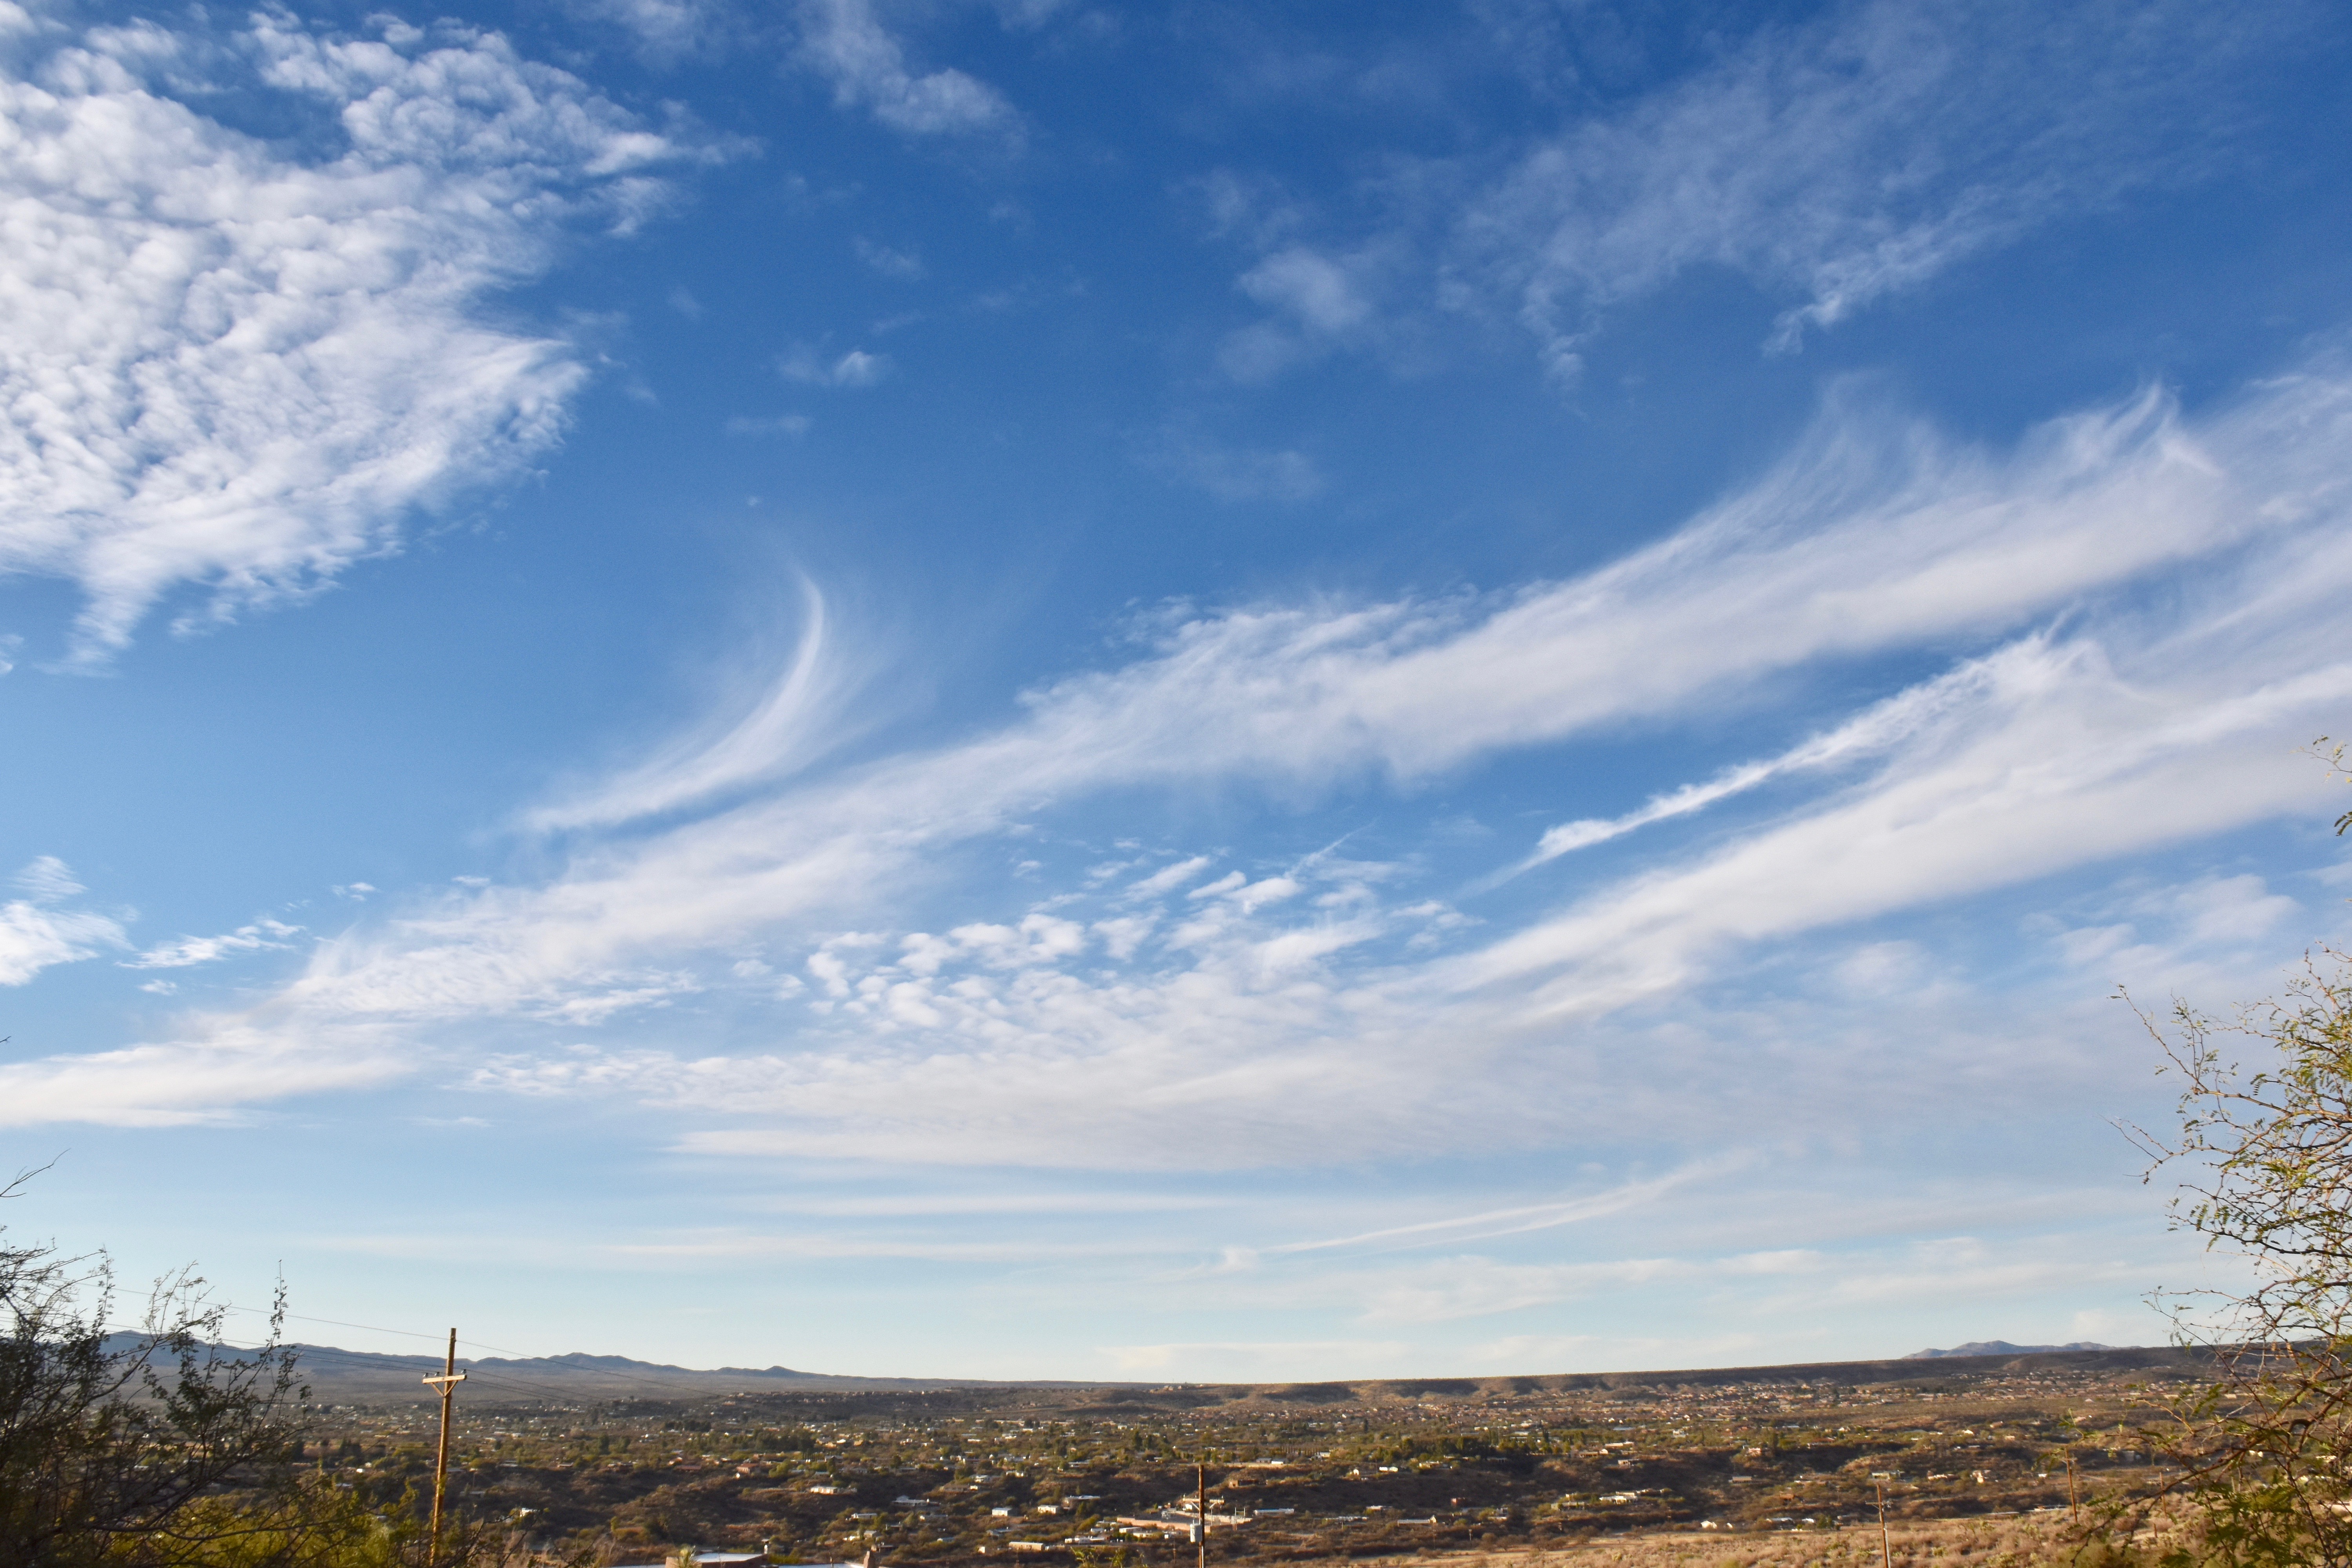
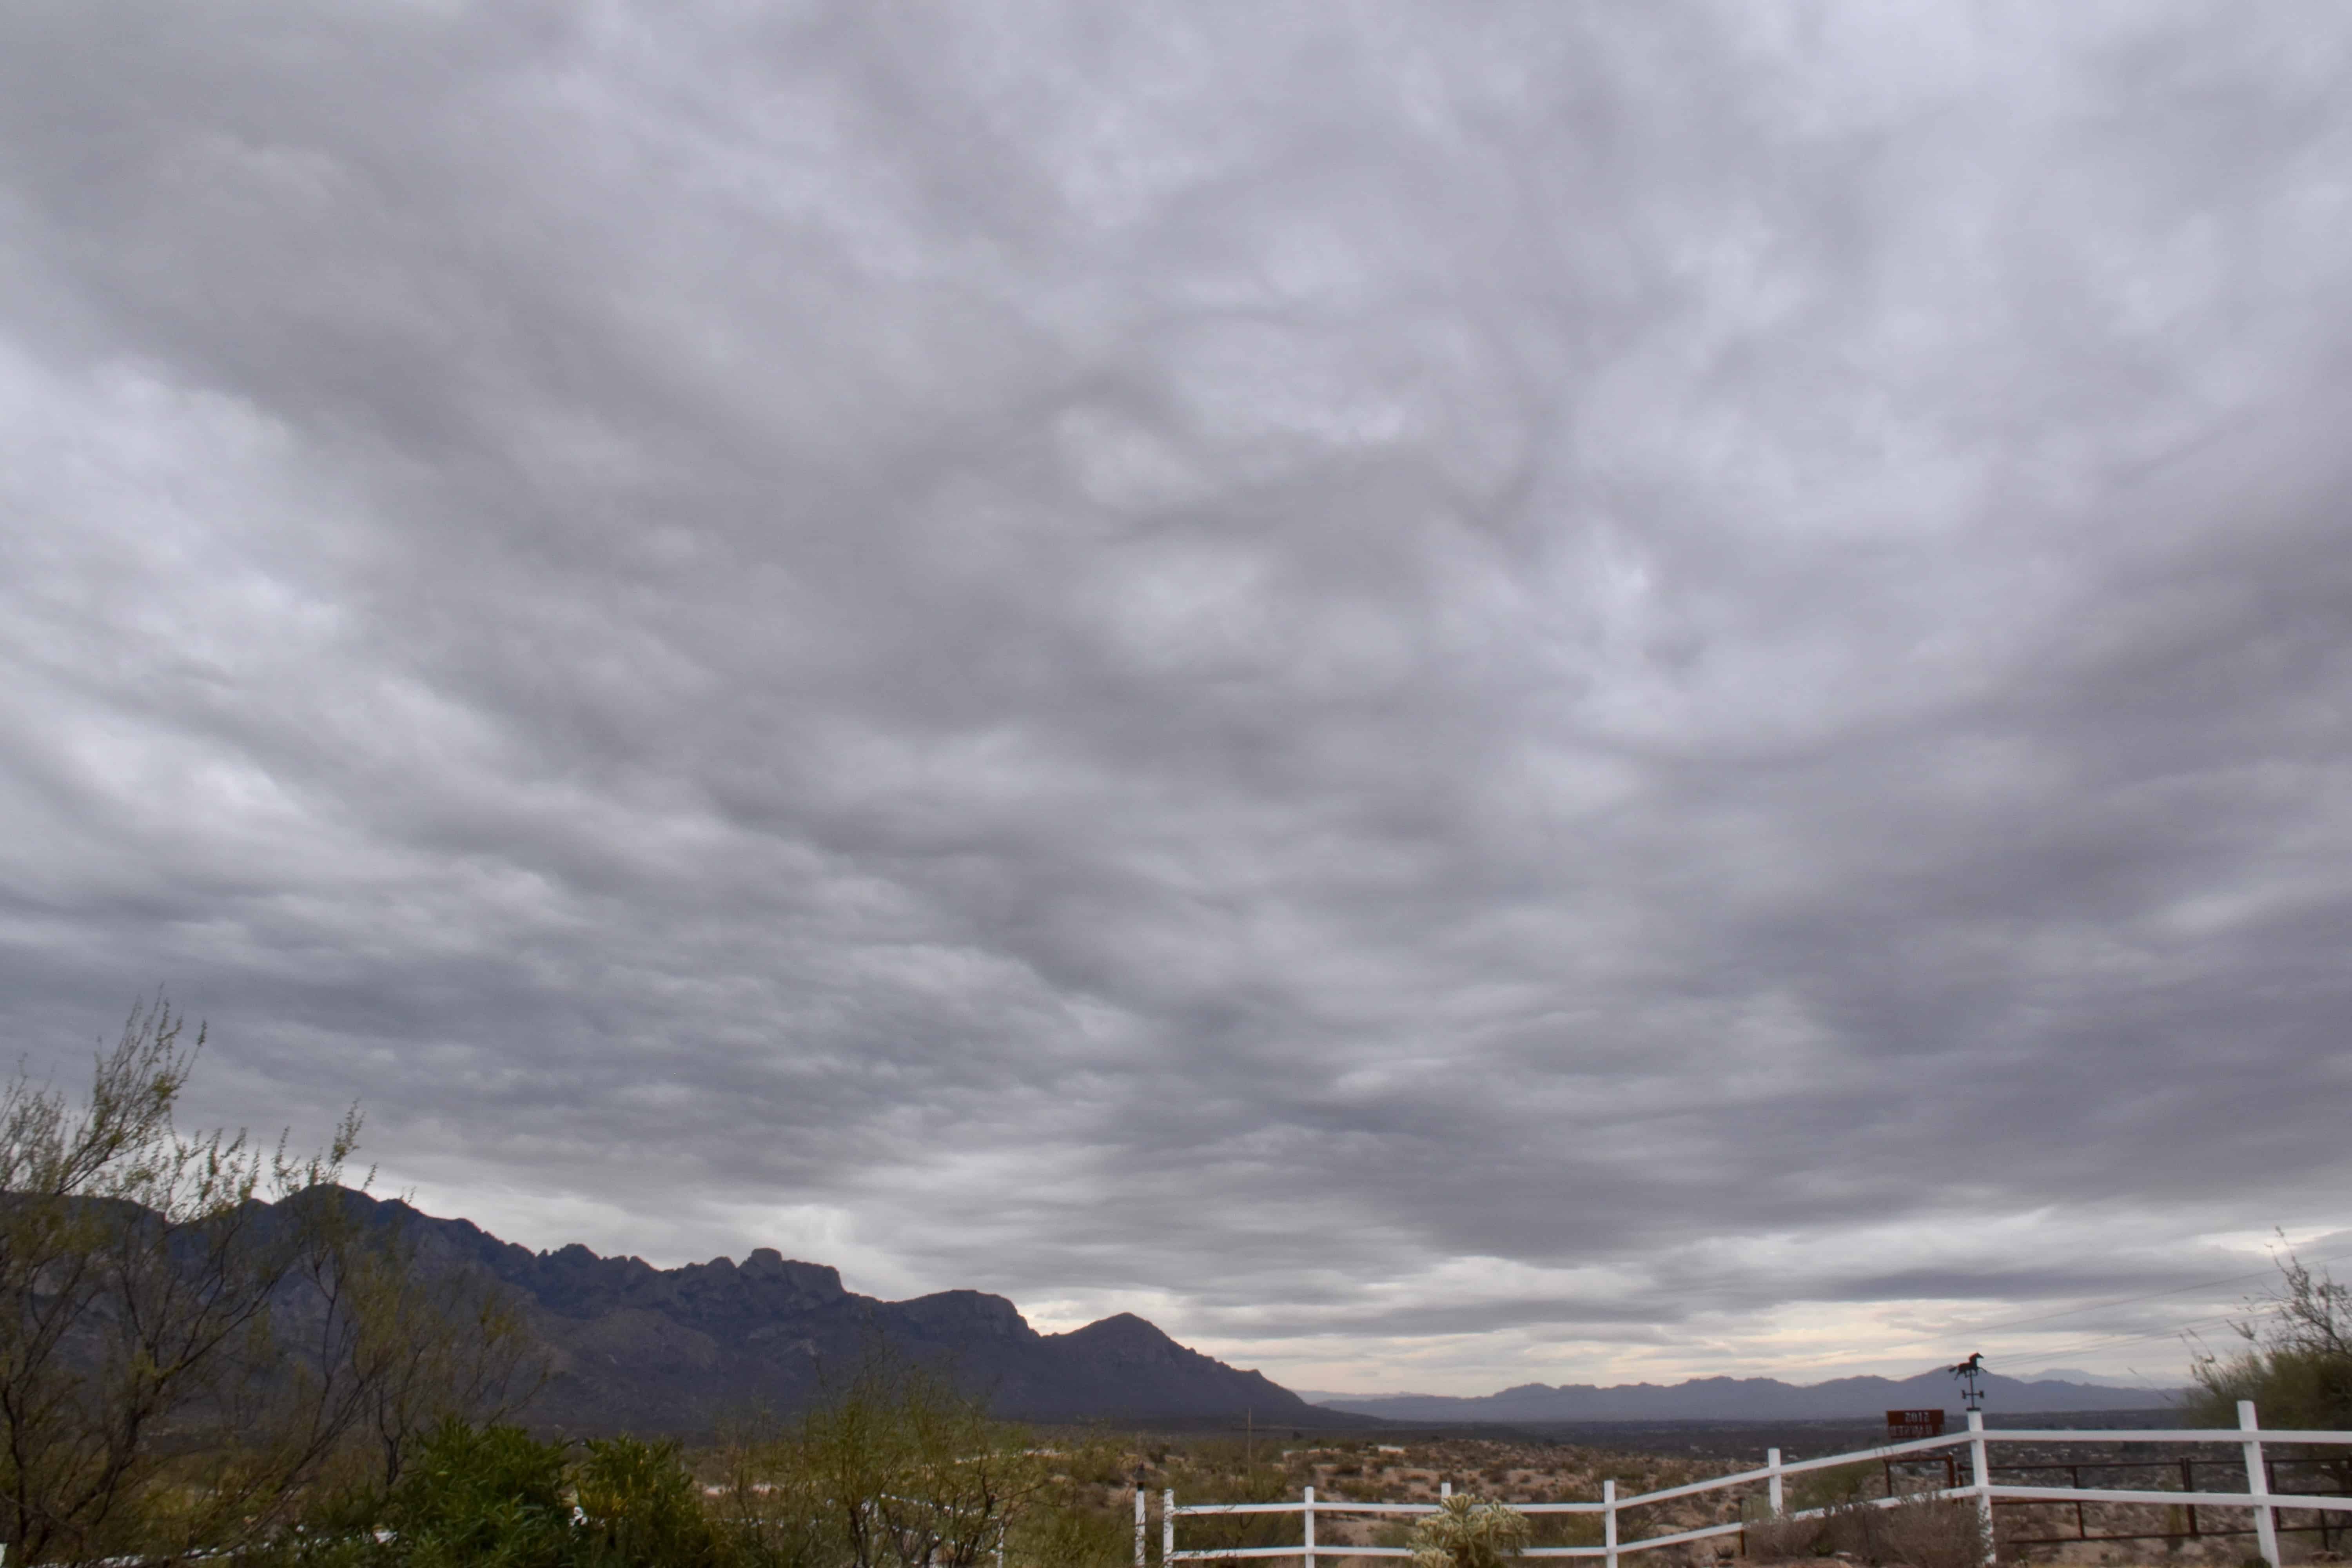
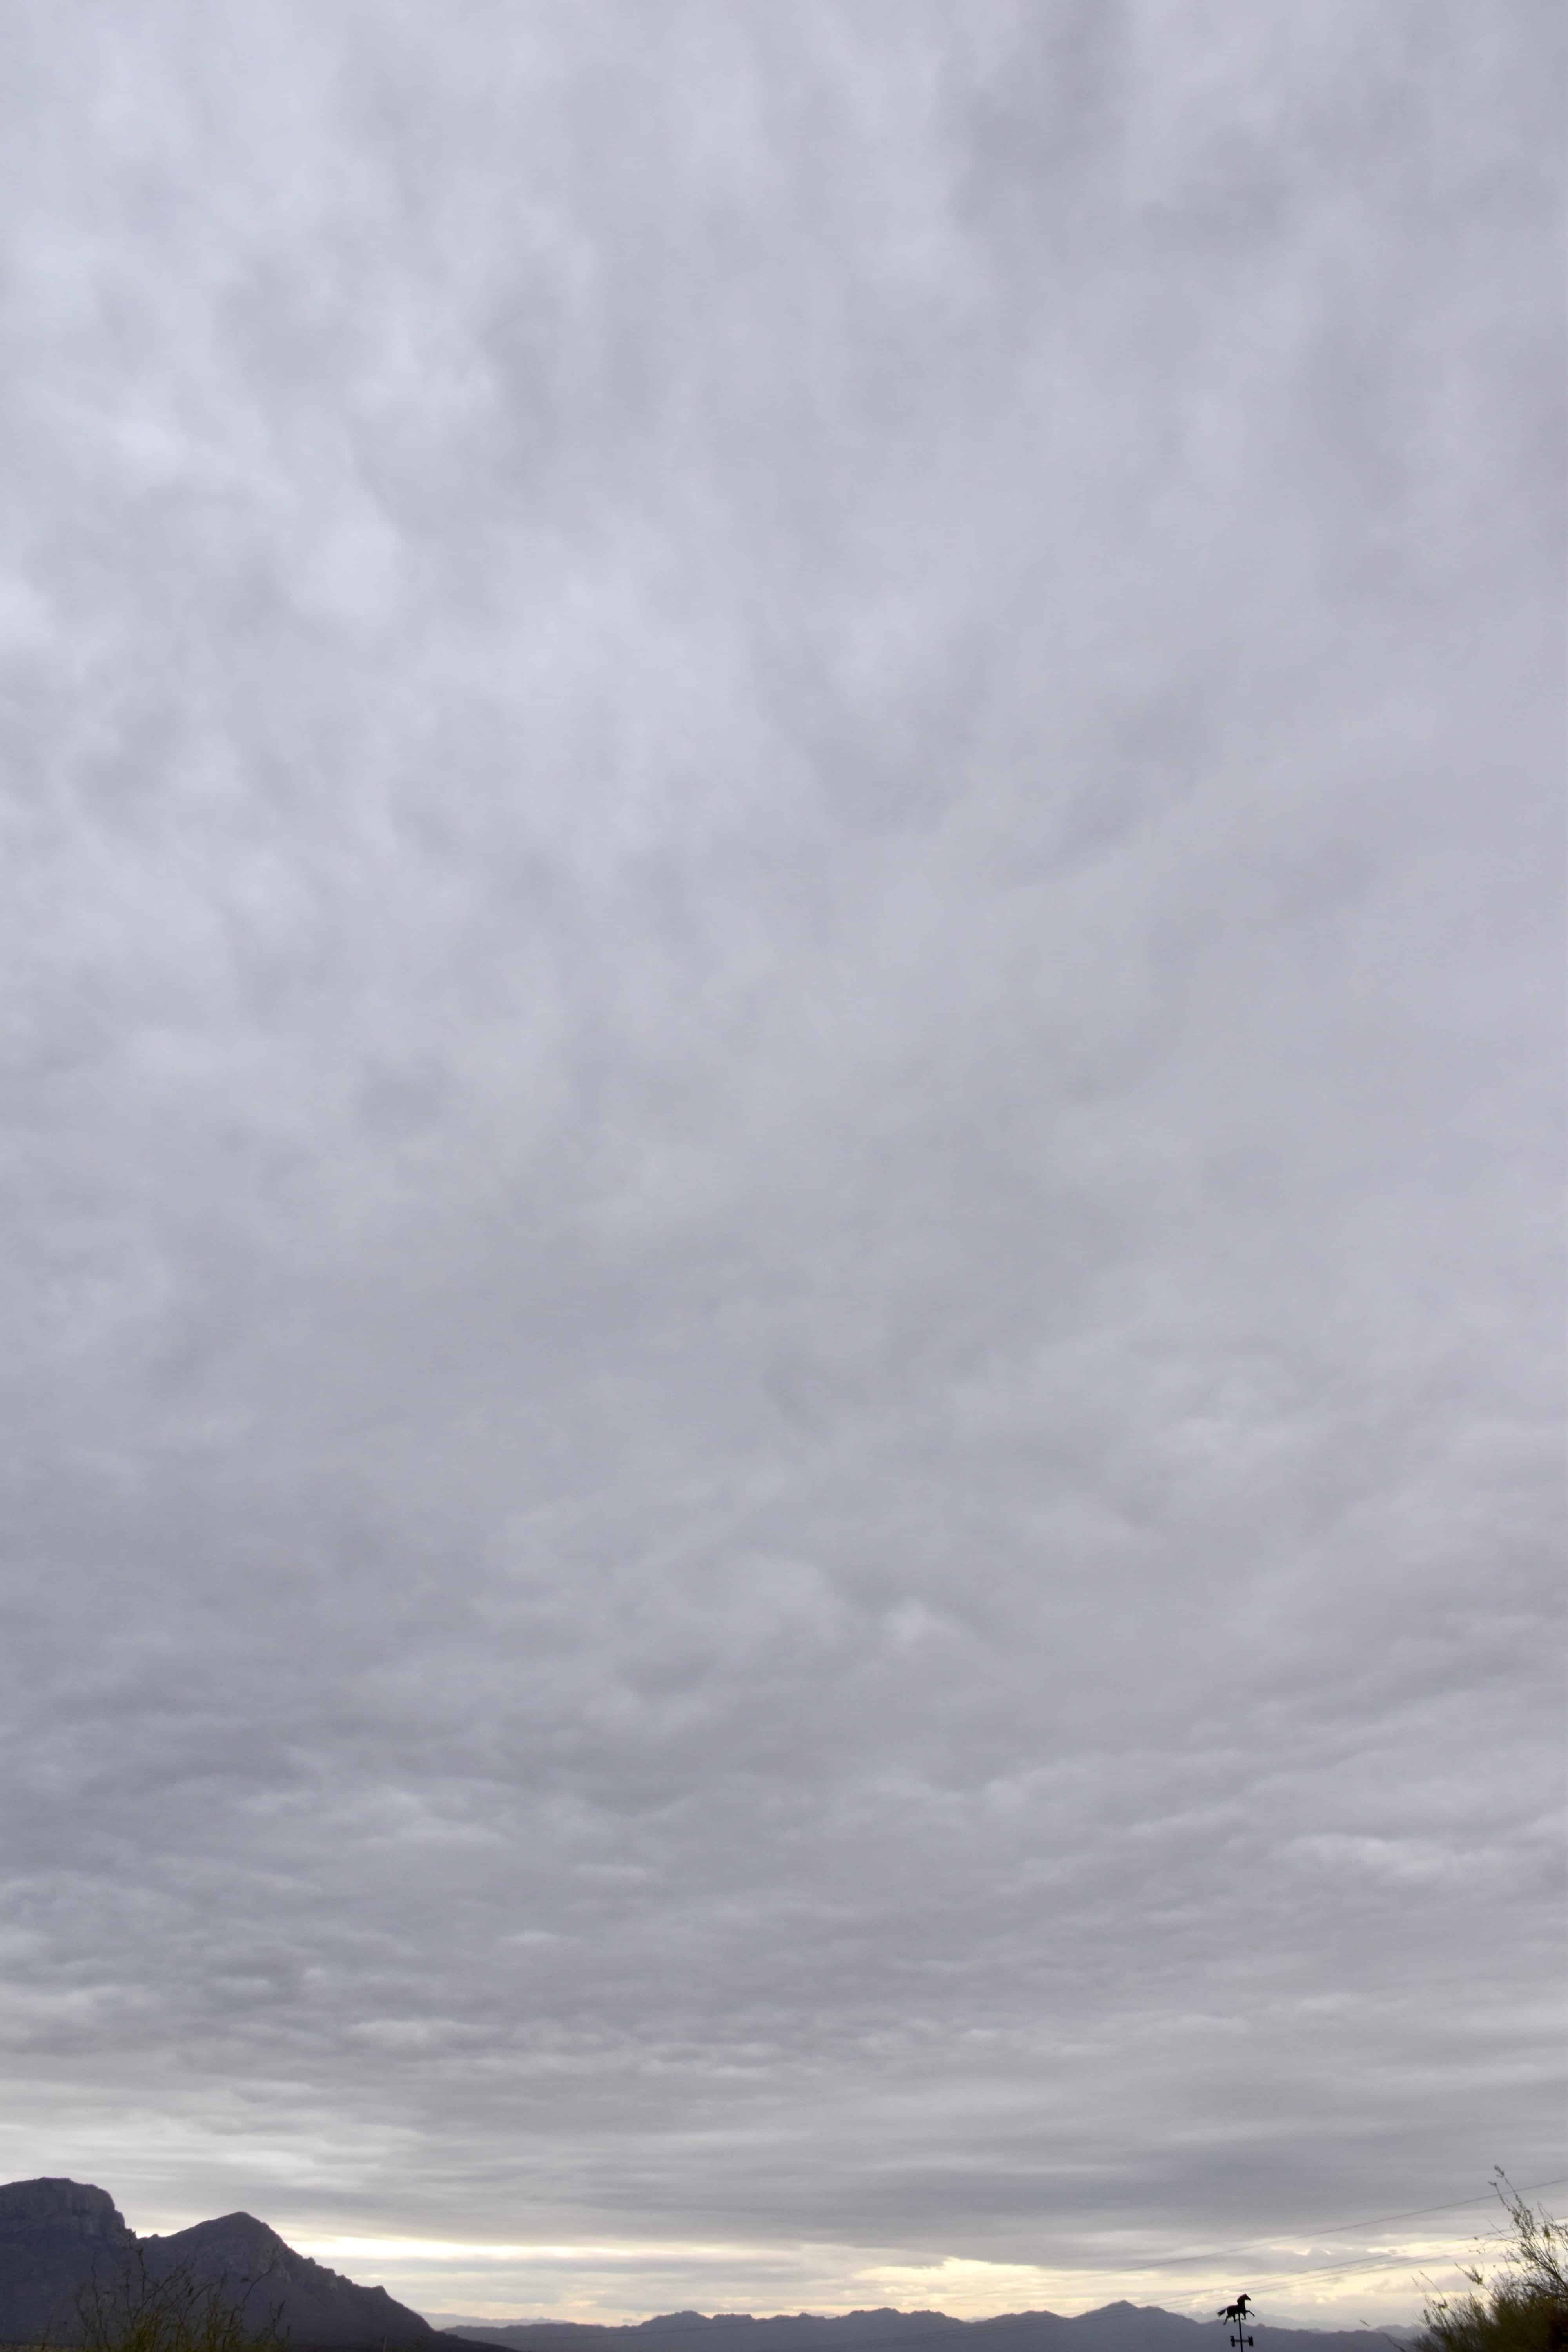
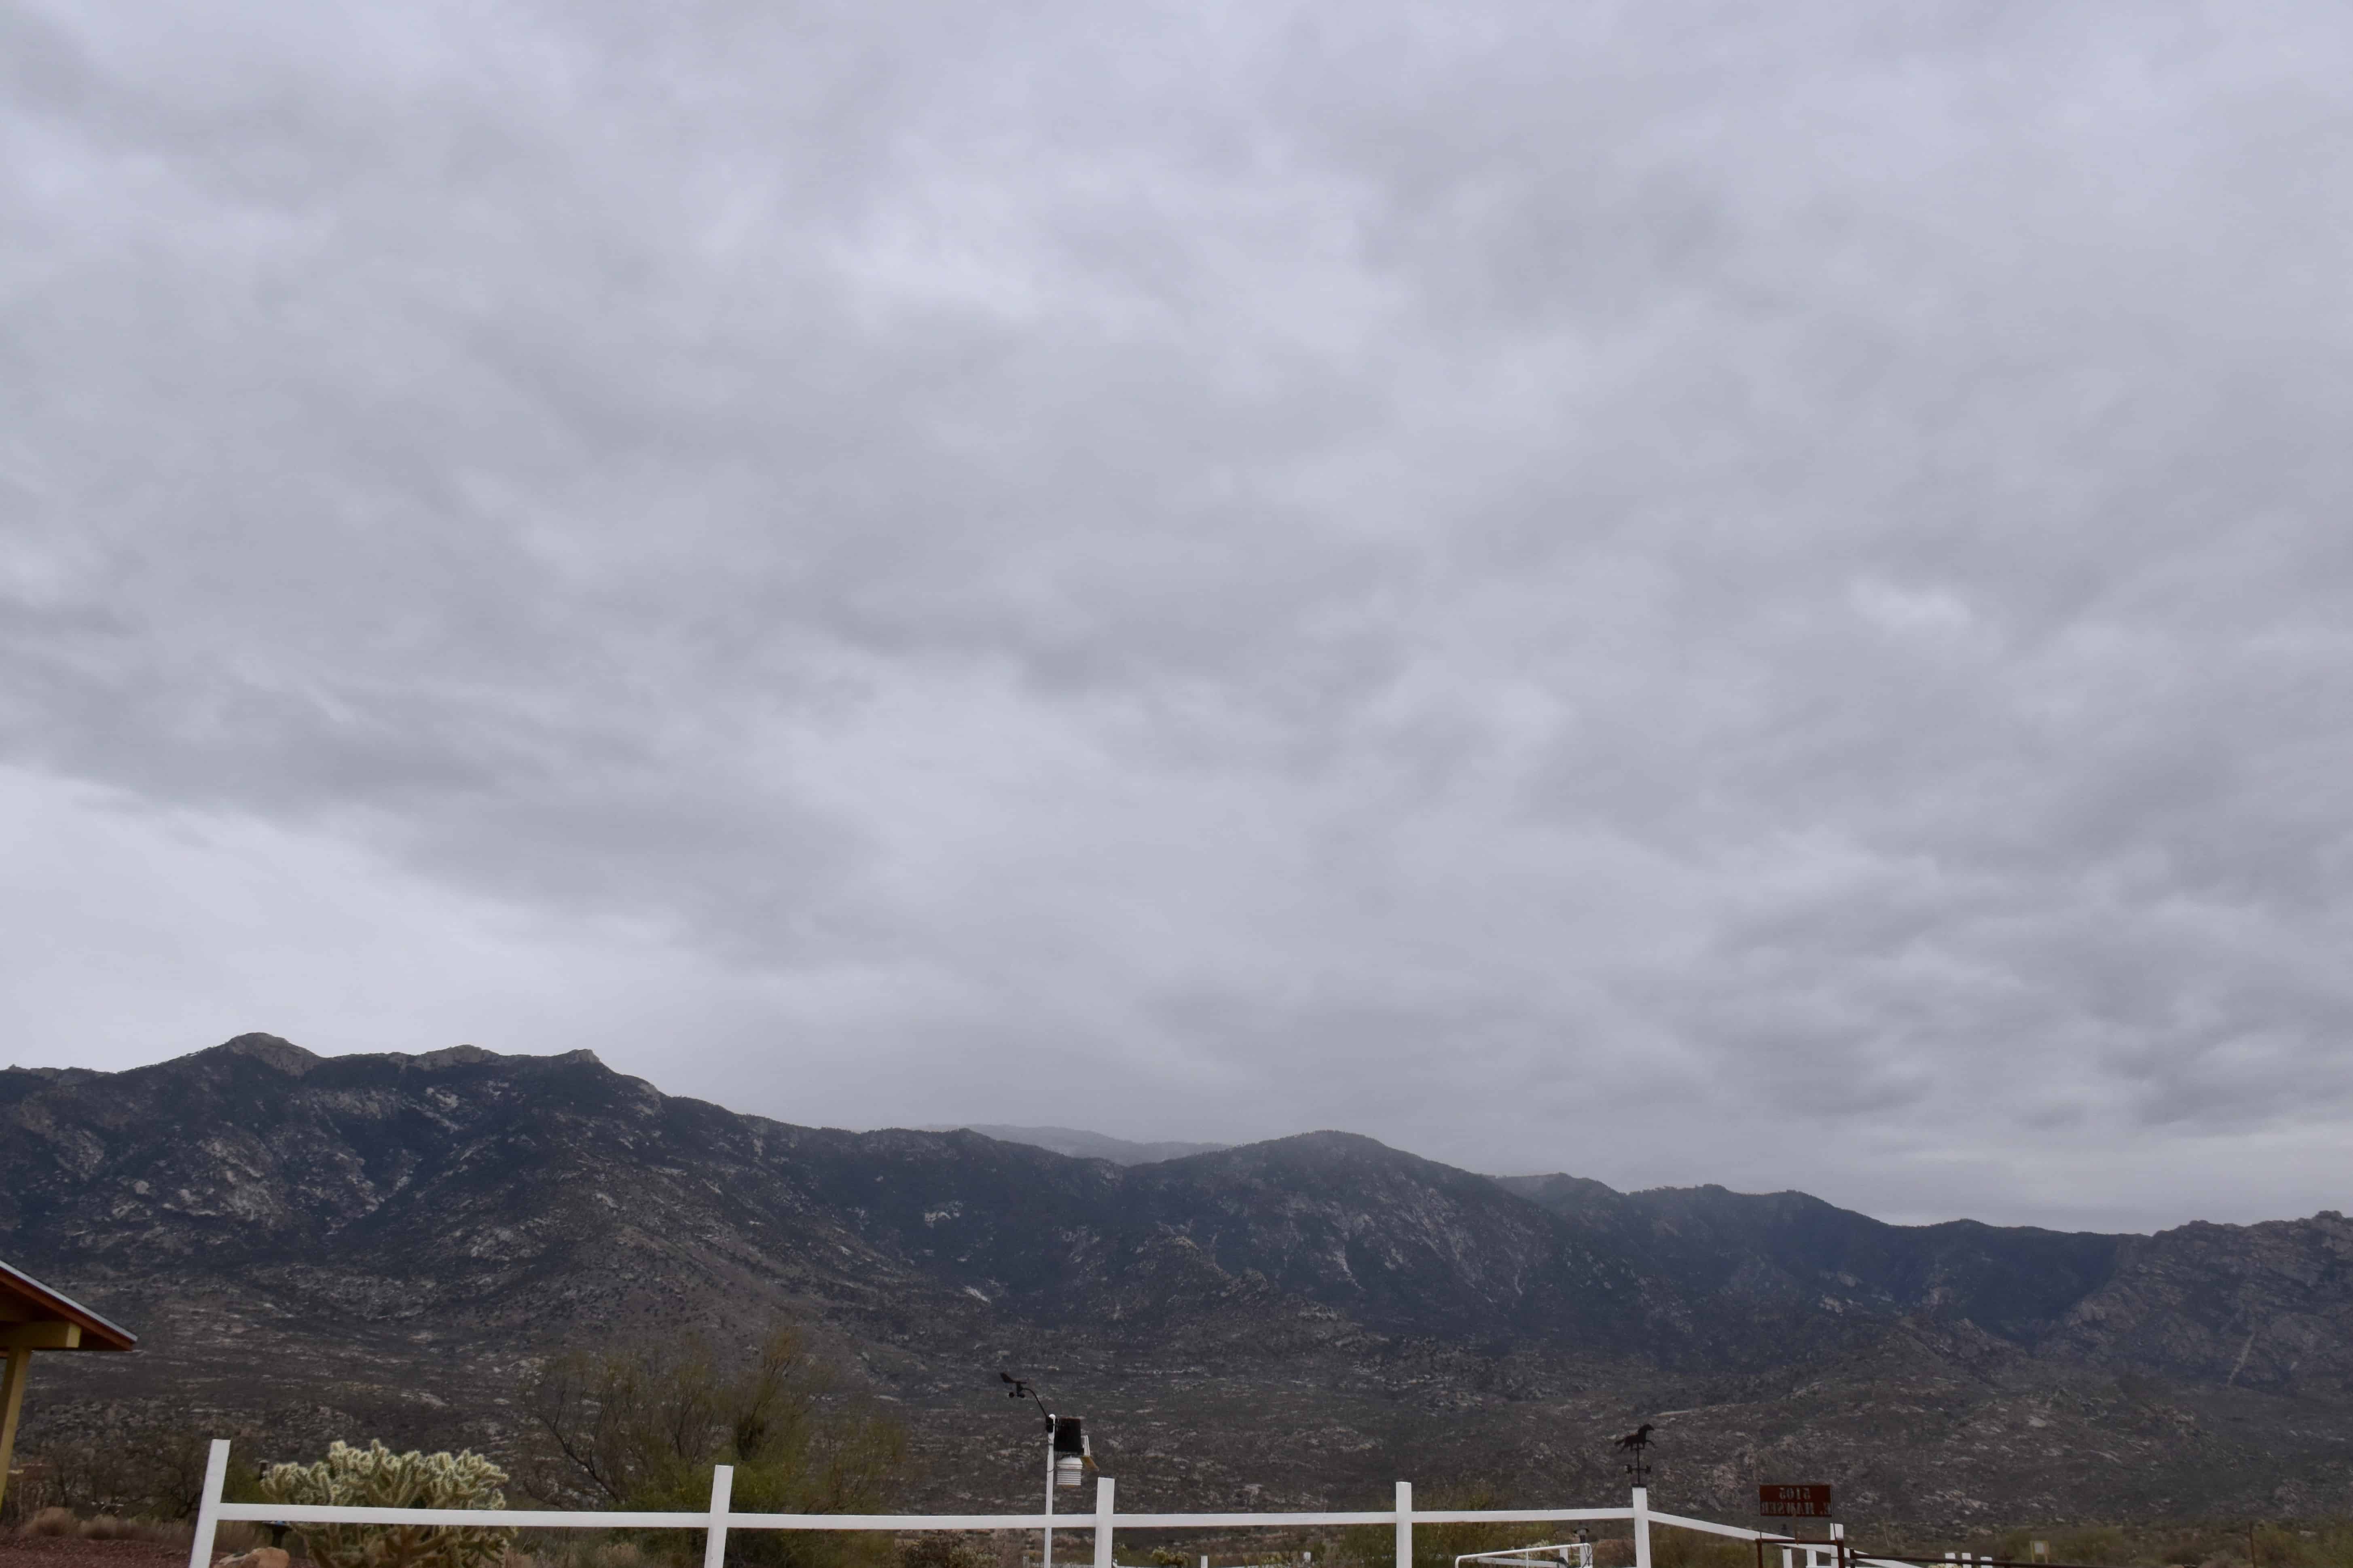
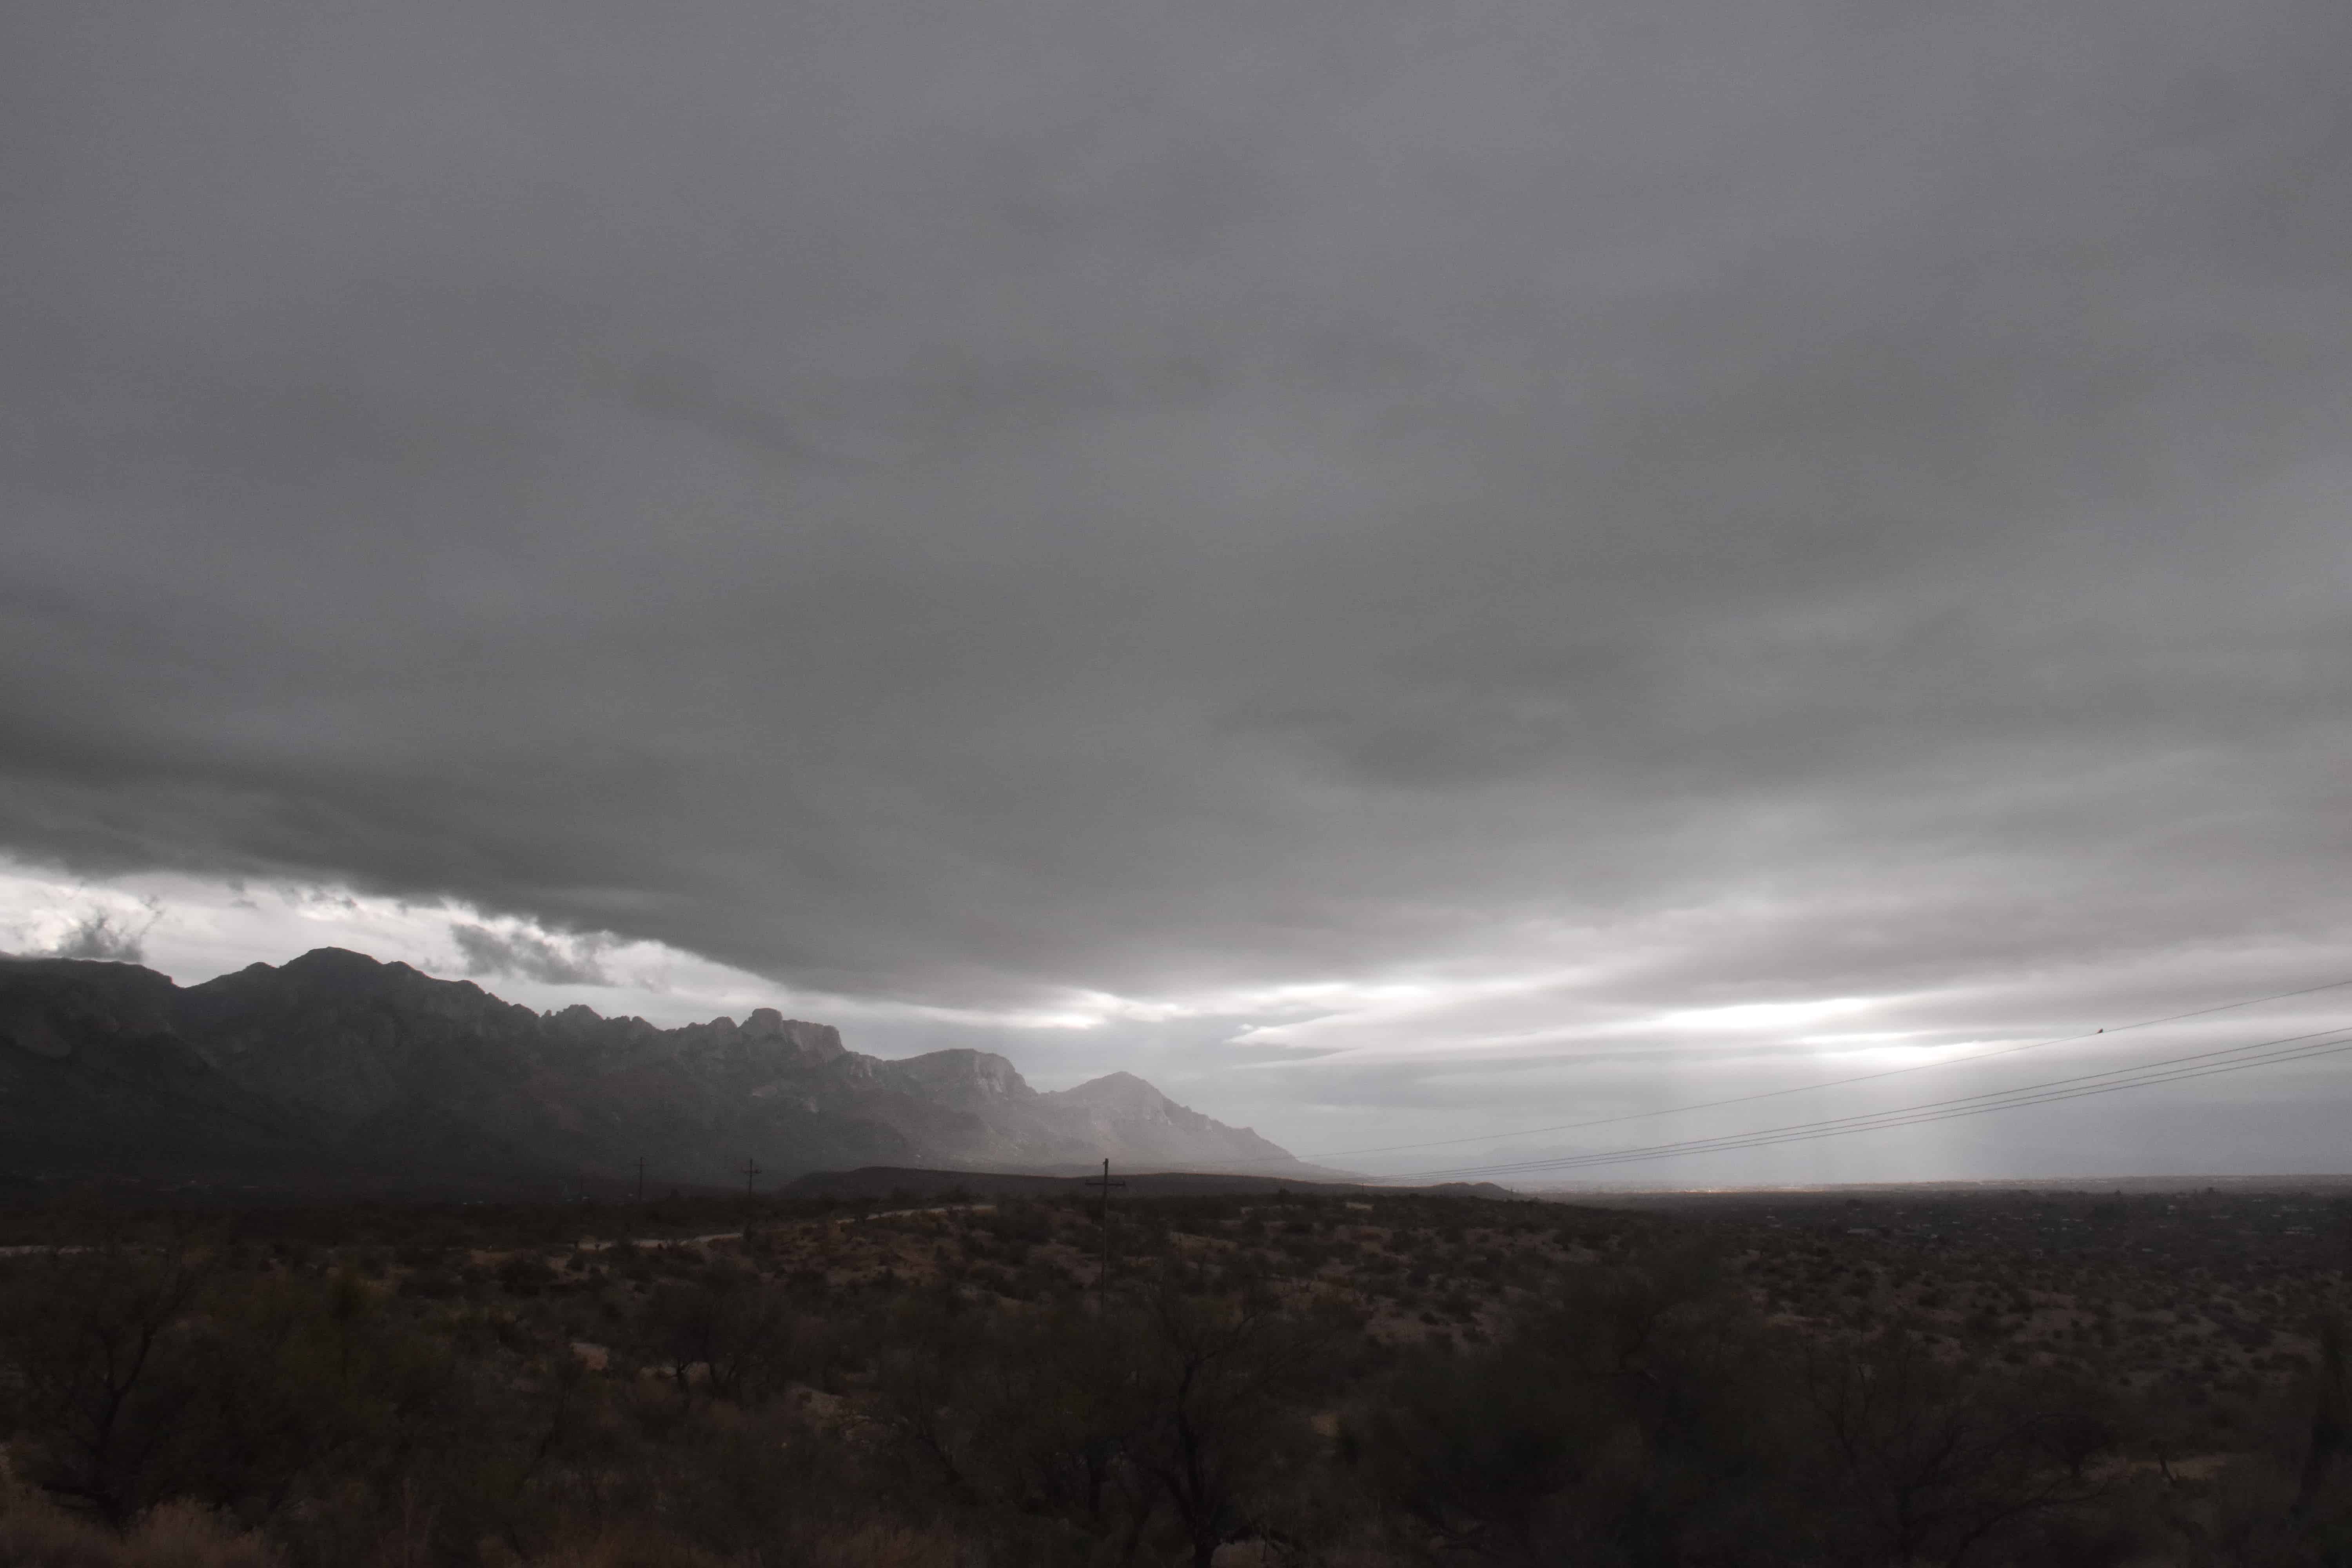
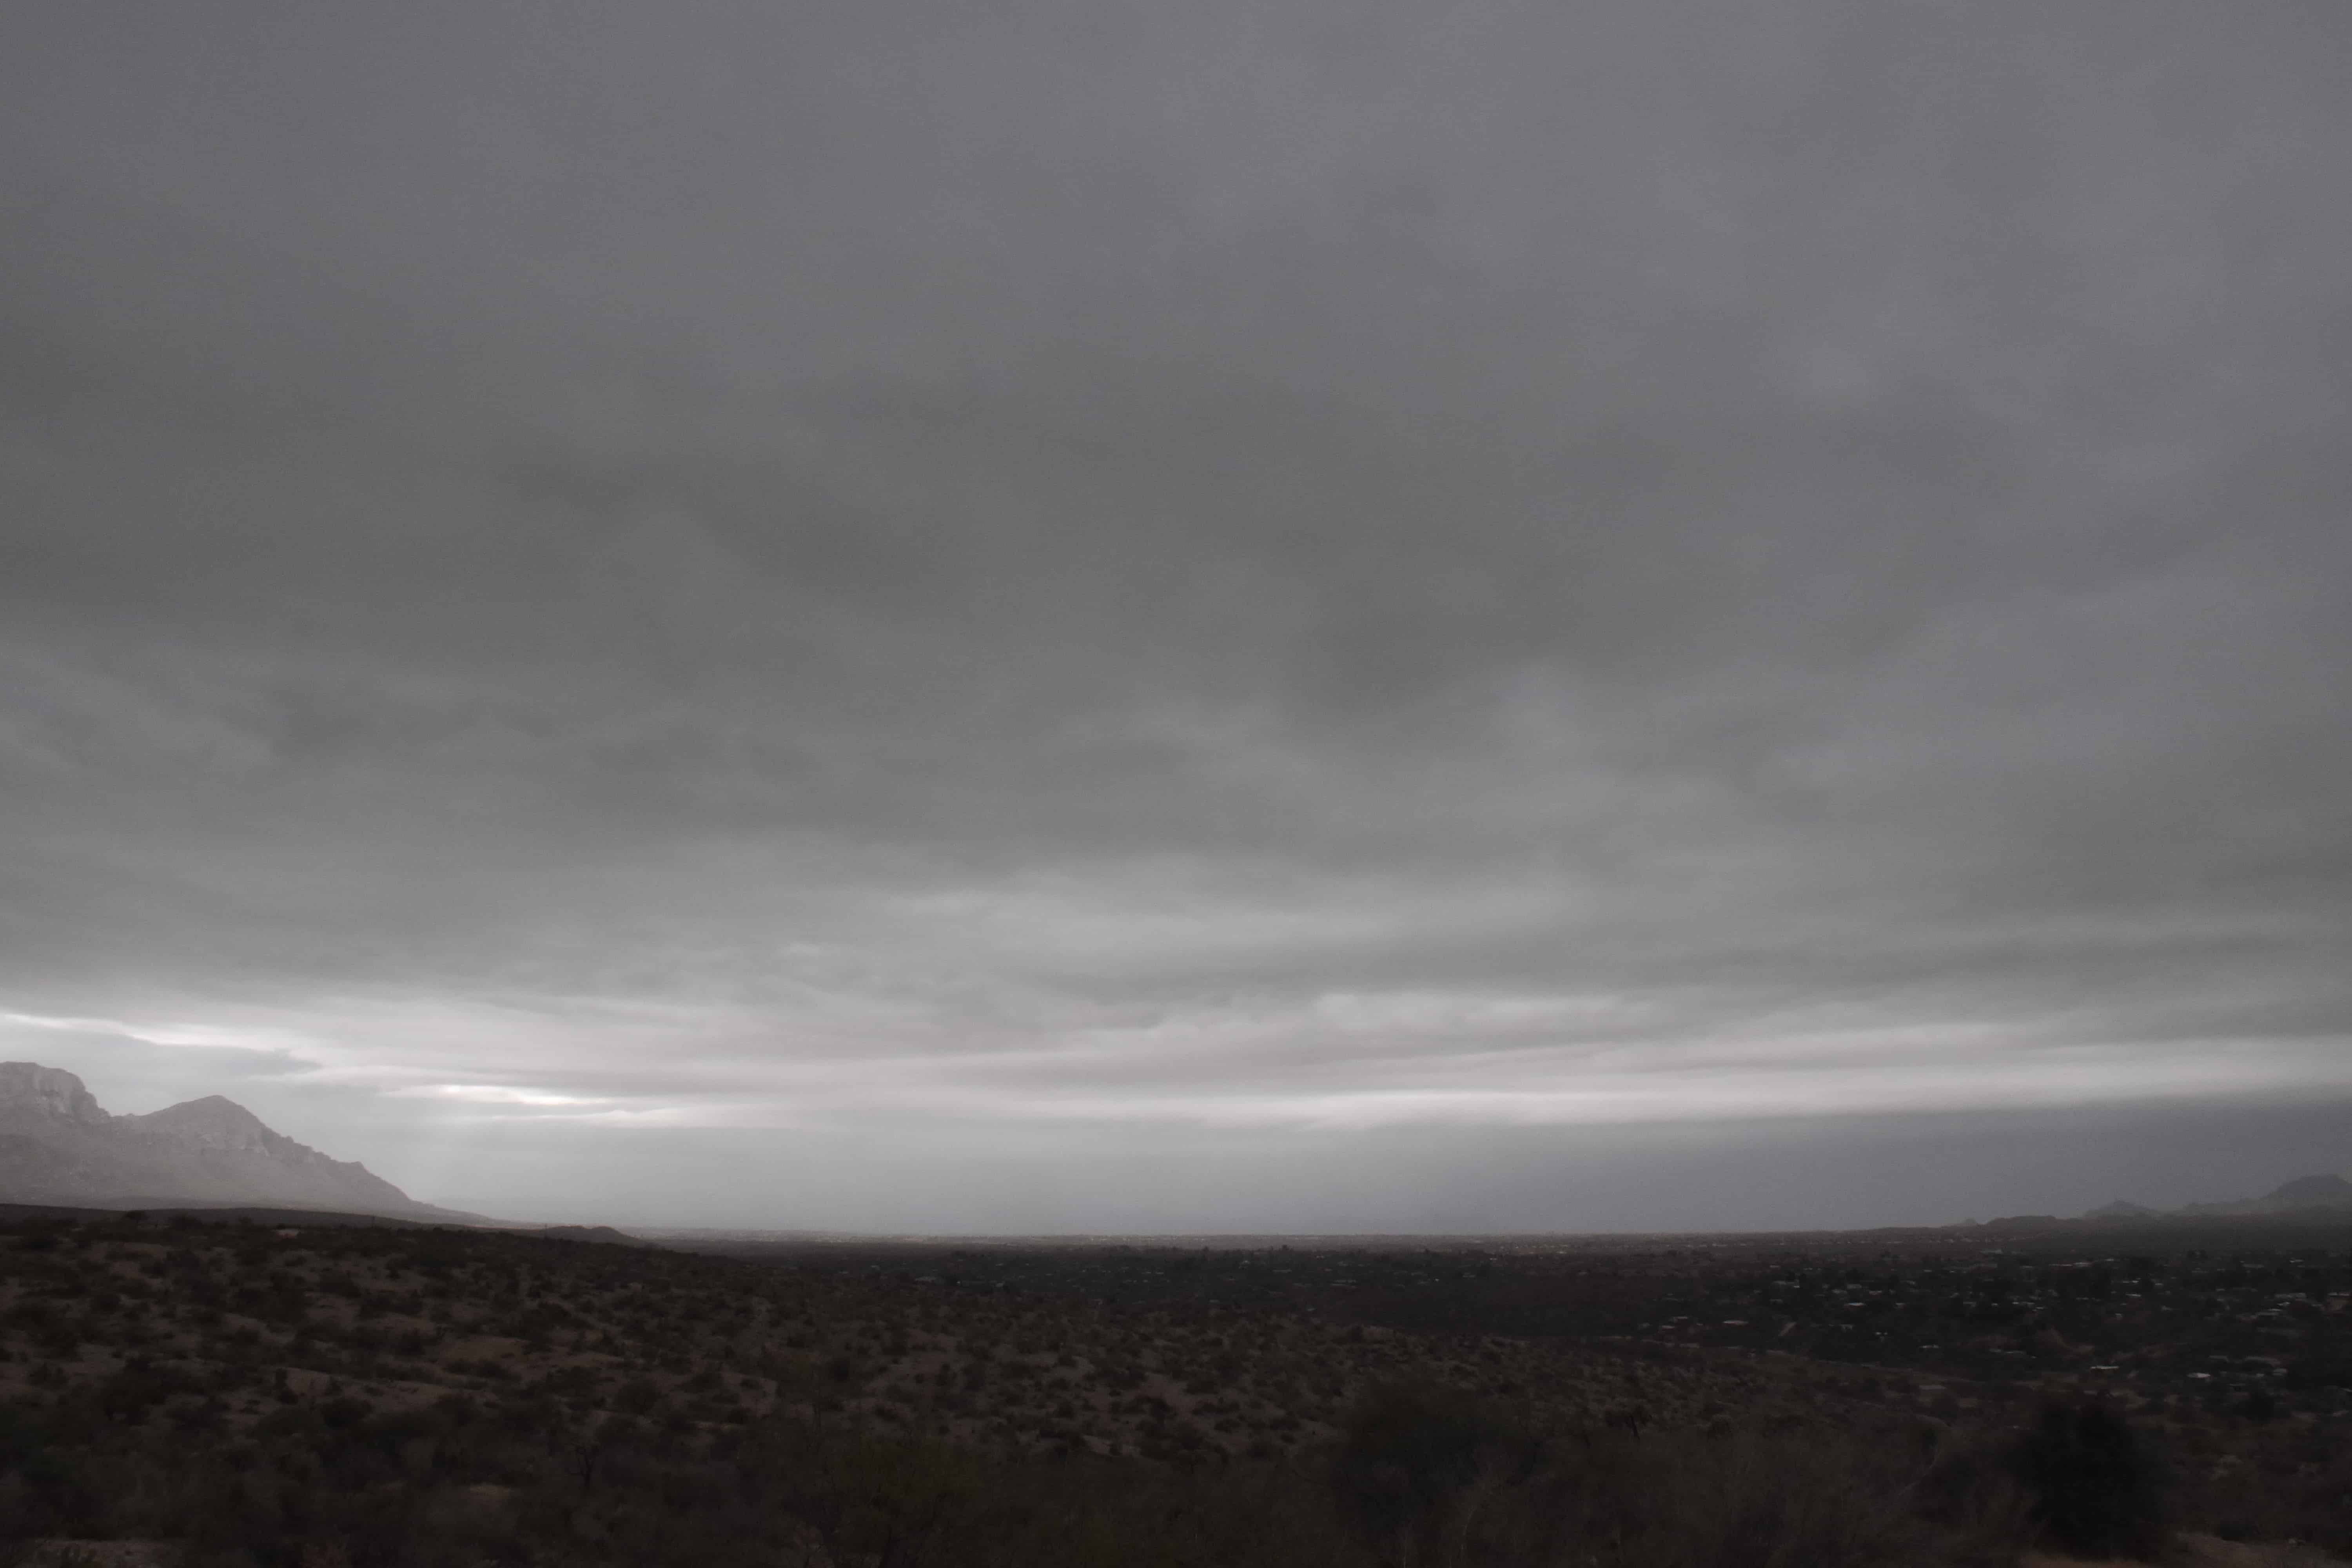
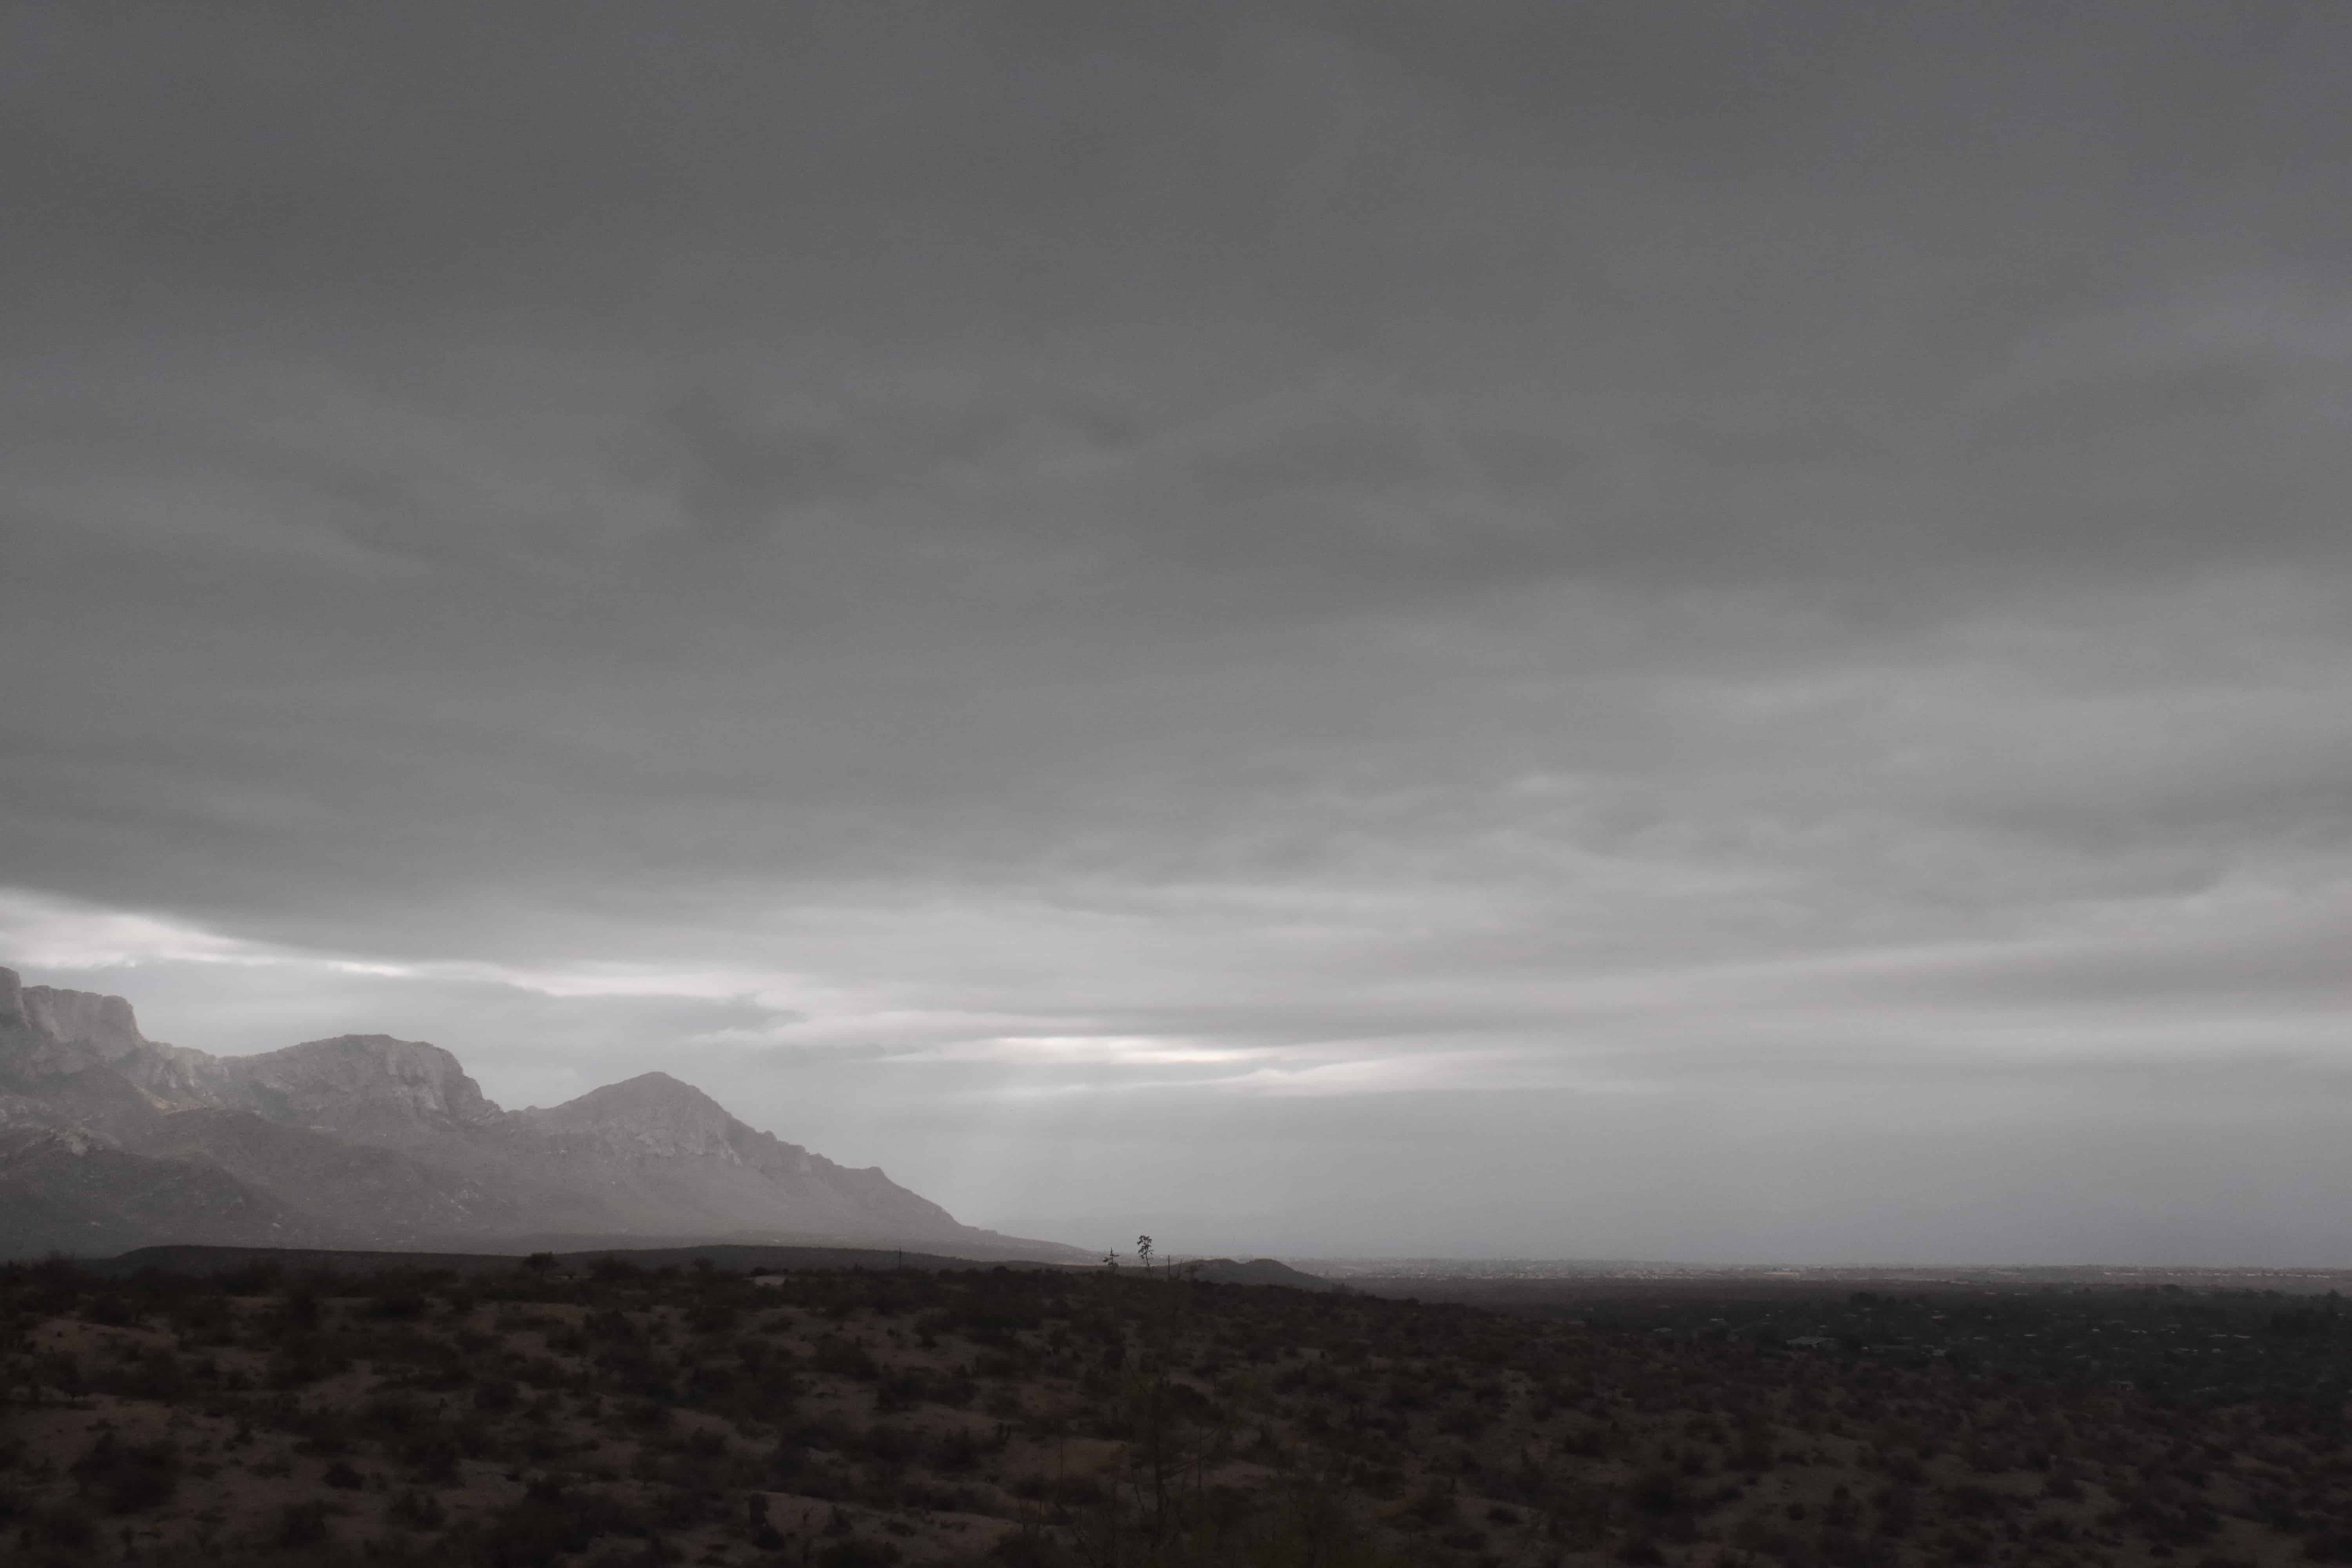
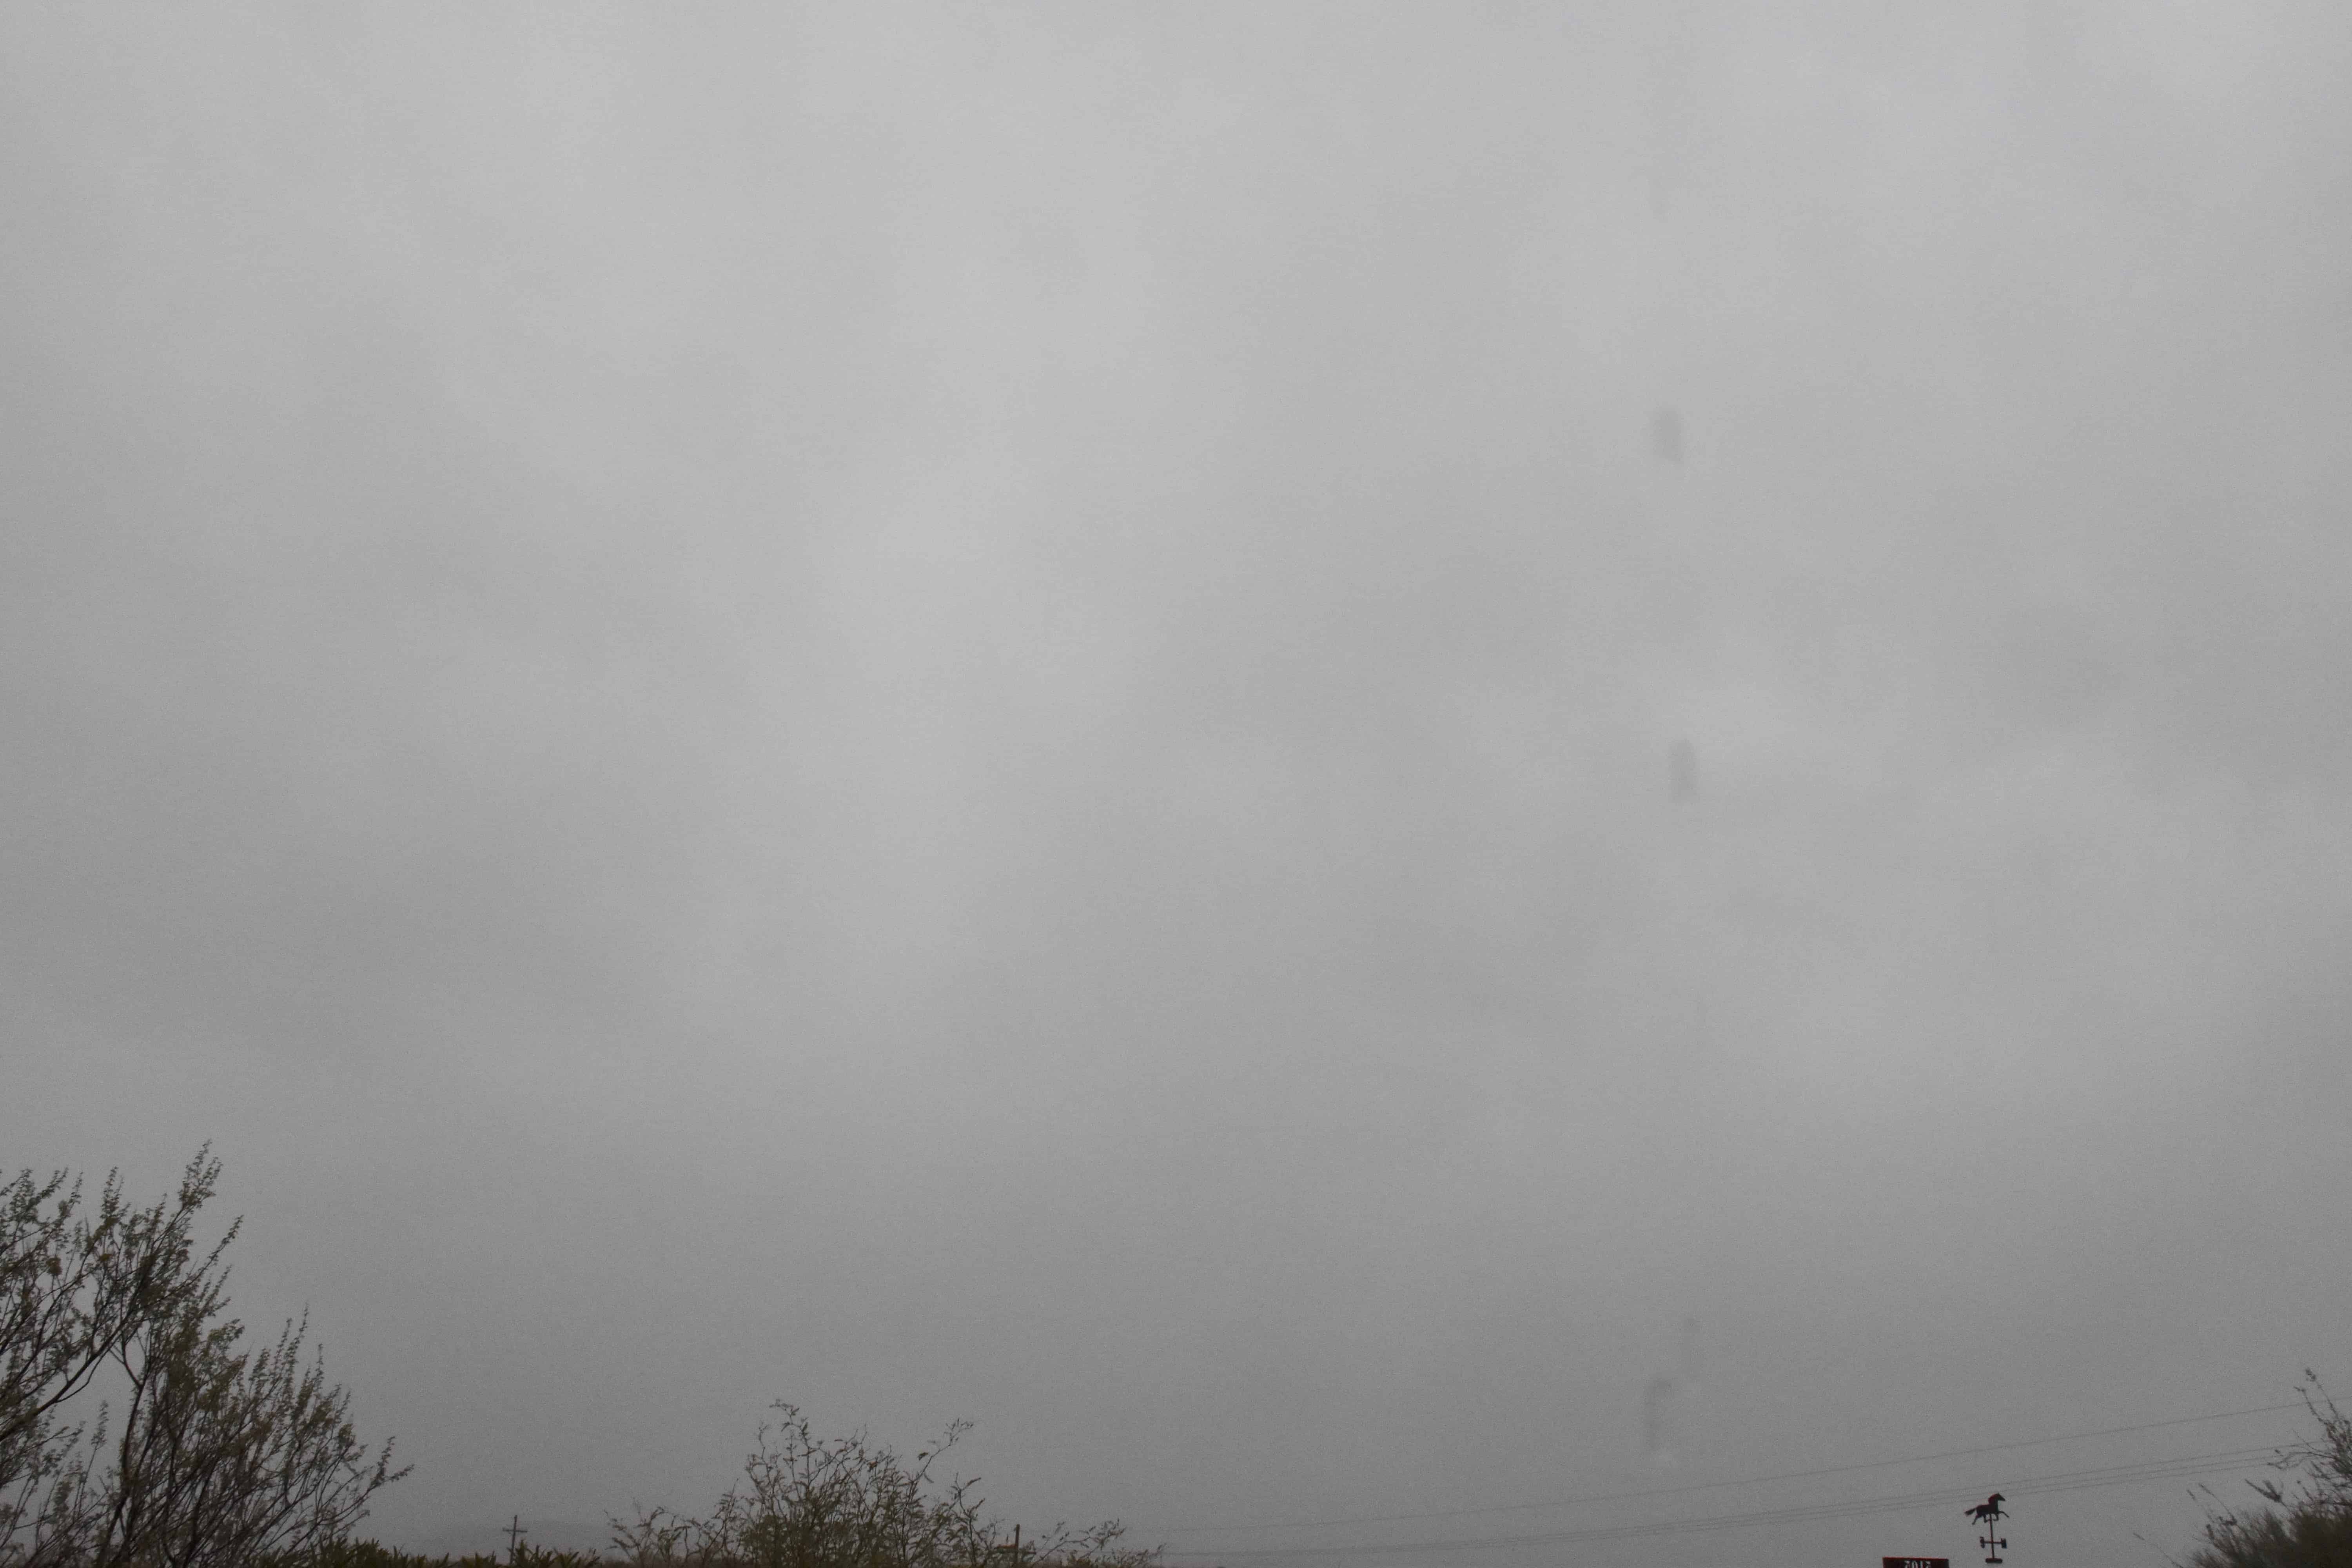
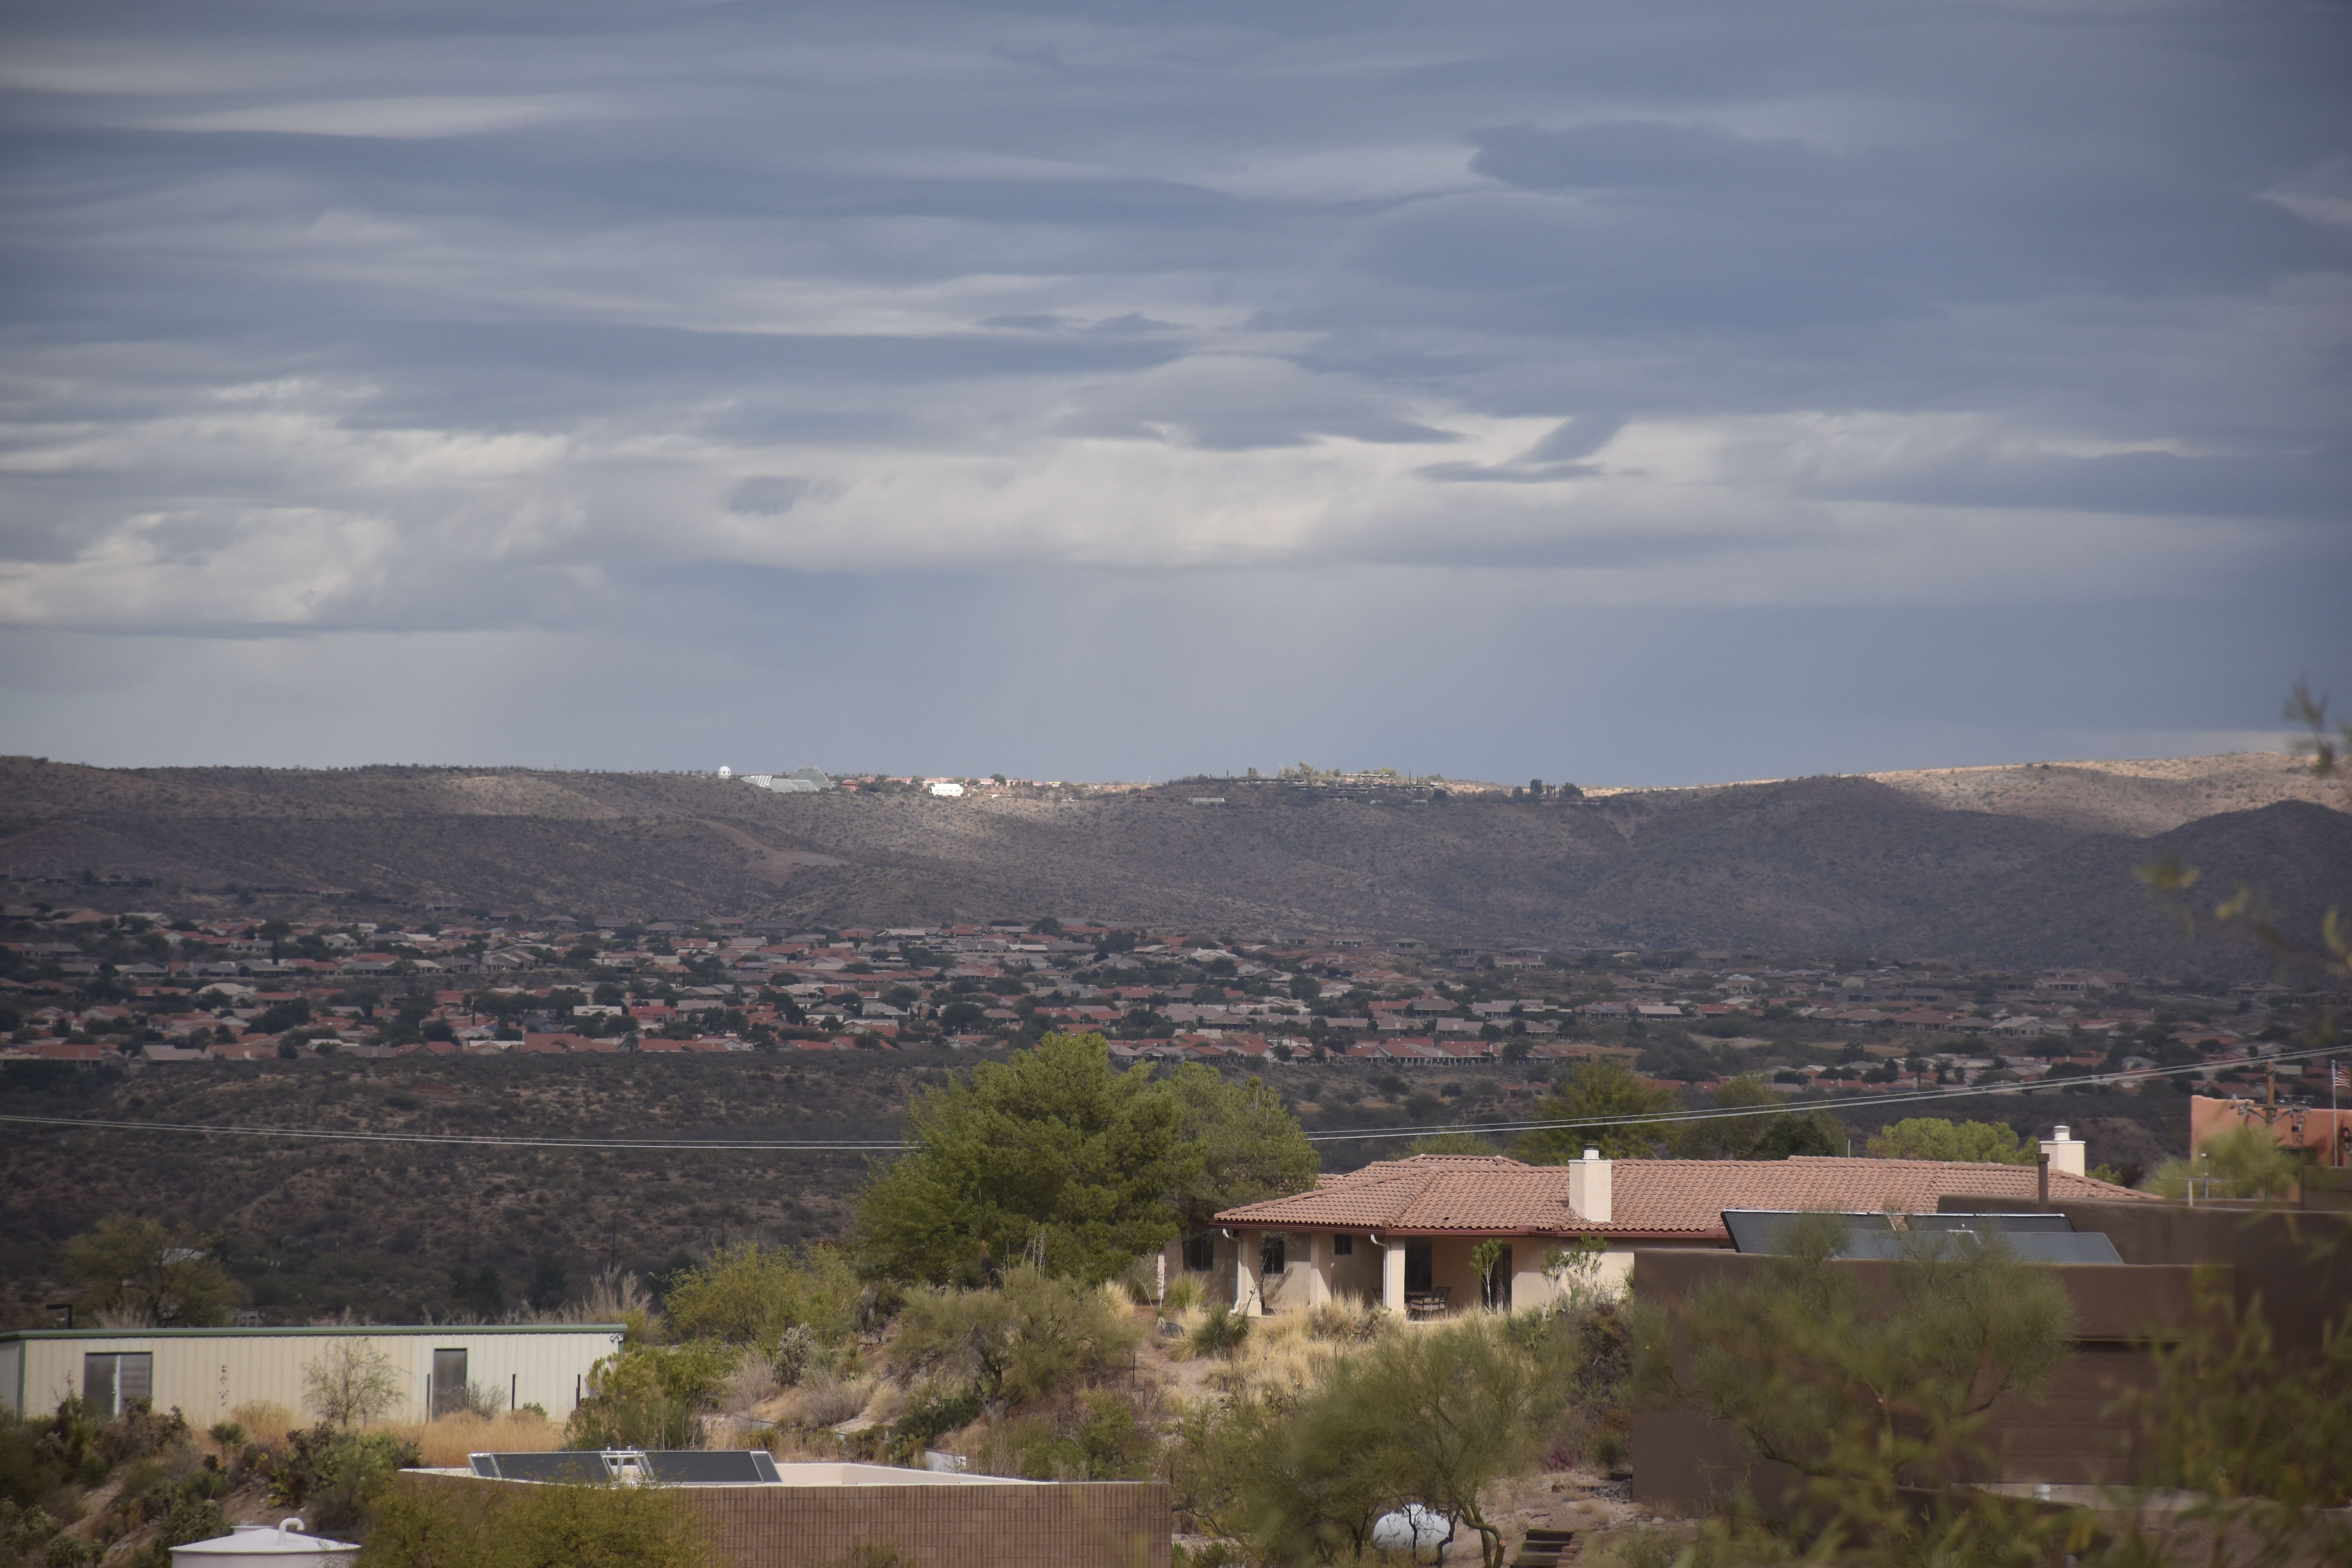
8:34 AM. An orographic layer of Stratocumulus tops Sam Ridge while a separate higher layer covering the whole sky sits on top of it. Neither one seem to be able to produce precip, ice or “warm rain”–precip without ice.8:34 AM. Stratocumulus. Light rain is falling from them on the horizon. What does it mean? Those clouds over there are just that bit thicker, tops higher and colder. Could be a warm rain (no ice involved) or a case of “ice multiplication”, a still continuing mystery in the cloud and precip domain where more ice forms in clouds than we can explain. Mostly occurs when the cloud top temperatures are higher than -14°C to about -4°C. Ice crystals can be in tremendous concentrations in such clouds but we don’t know quite why yet. So, models that forecast rain and snow, as good as they are today, could be that bit better if they could accurately the ice in clouds in that cloud top temperature range I just mentioned a few paragraphs ago. That’s probably the biggest payoff for really understanding how ice forms in clouds. At the University of Washington, me and Peter Hobbs were reporting that the consensus theory on how ice formed in clouds was not capable of explaining what we were finding in the clouds we sampled with our aircraft. There was too much ice in clouds, and it appeared too fast. We were on the outside looking in and our whole body of work was criticized as being wrong by two of the great professors of ice-formation in clouds, Alan Blyth and John Latham in 1998. They used our names in the title of the article, too, “the glaciation papers of Hobbs and Rangno.” I sent a copy to mom. This is what happens when you’re not part of a consensus, you eventually get criticized royally because no one believes you, they think without commenting about it that your work is bogus. At the same time, it was truly GREAT that Blyth and Latham took time to look into all of our work since we scientists don’t do enough of that kind of thing, look into the work of others we suspect might be wrong. But over the years, the concensus about how ice forms in clouds has weakened and new factors are being touted as important players like drizzle drops that fragment or explode when they freeze because at certain temperatures an ice shell develops on the outside of a freezing drop, and then when the water farther in freezes and tries to get out because it wants to expand, it breaks the ice shell, and maybe spicule or ice splinter comes out helping to produce extra ice we call secondary ice particles since they didn’t form on an “ice nuclei”, something we have a though time measuring anyway. Fragmenting drops as they freeze has been known about for decades, but now its being thought that maybe a lot fragments result, not just a few as was thought before. So those extra ice crystals end up creating concentrations of ice crystals we can’t quite explain in clouds here even in 2018, such as those ones over there that were raining north of Saddlebrooke to bring us full round in this photo. Caption too long? Let us not forget that this site originated the practice of novella-sized captions. I think many of you forget that a picture is worth a thousand words of caption, too. Here, we’ve only managed a few hundred.10:13 AM. Still raining way over there NE of Saddlebrooke and Bio2 if you look carefully, lower right. Can there be a better “classic” photo of Stratocumulus? I don’t think so. Cloud bases still running about the level of Sam Ridge, or about 3,500 to 4,000 feet above the ground.10:05 AM, maybe. Stratocumulus clouds spewing drizzle precip roared out of the west in a band, now enveloping the Catalinas toward Pusch Ridge. Drizzle is pretty rare in Arizona, so I hope you noted it in your diaries yesterday. Means the clouds overhead have low droplet concentrations, and the larger drops are greater than about 30 microns in diameter, which are those sizes that when they bump together they can coalesce into a much larger drop that collides with more and more drops to form ones that can fall out of the cloud instead of just hanging around up there not doing much. We call that process the “collision-coalesce” process of rain formation, or “warm rain” process, one that doesn’t involve ice. The formation of ice almost never results in drizzle, hence (is that still a word?), why CMP thinks it was a warm-rain process yesterday over there. Also, drizzle is often think enough to make it look like its a snow shaft, which is what we see over there, too. But we know the freezing level was really high yesterday, so it can’t be snow over there. Nor are the clouds Cumulonimbus ones that CAN produce dense shafts.
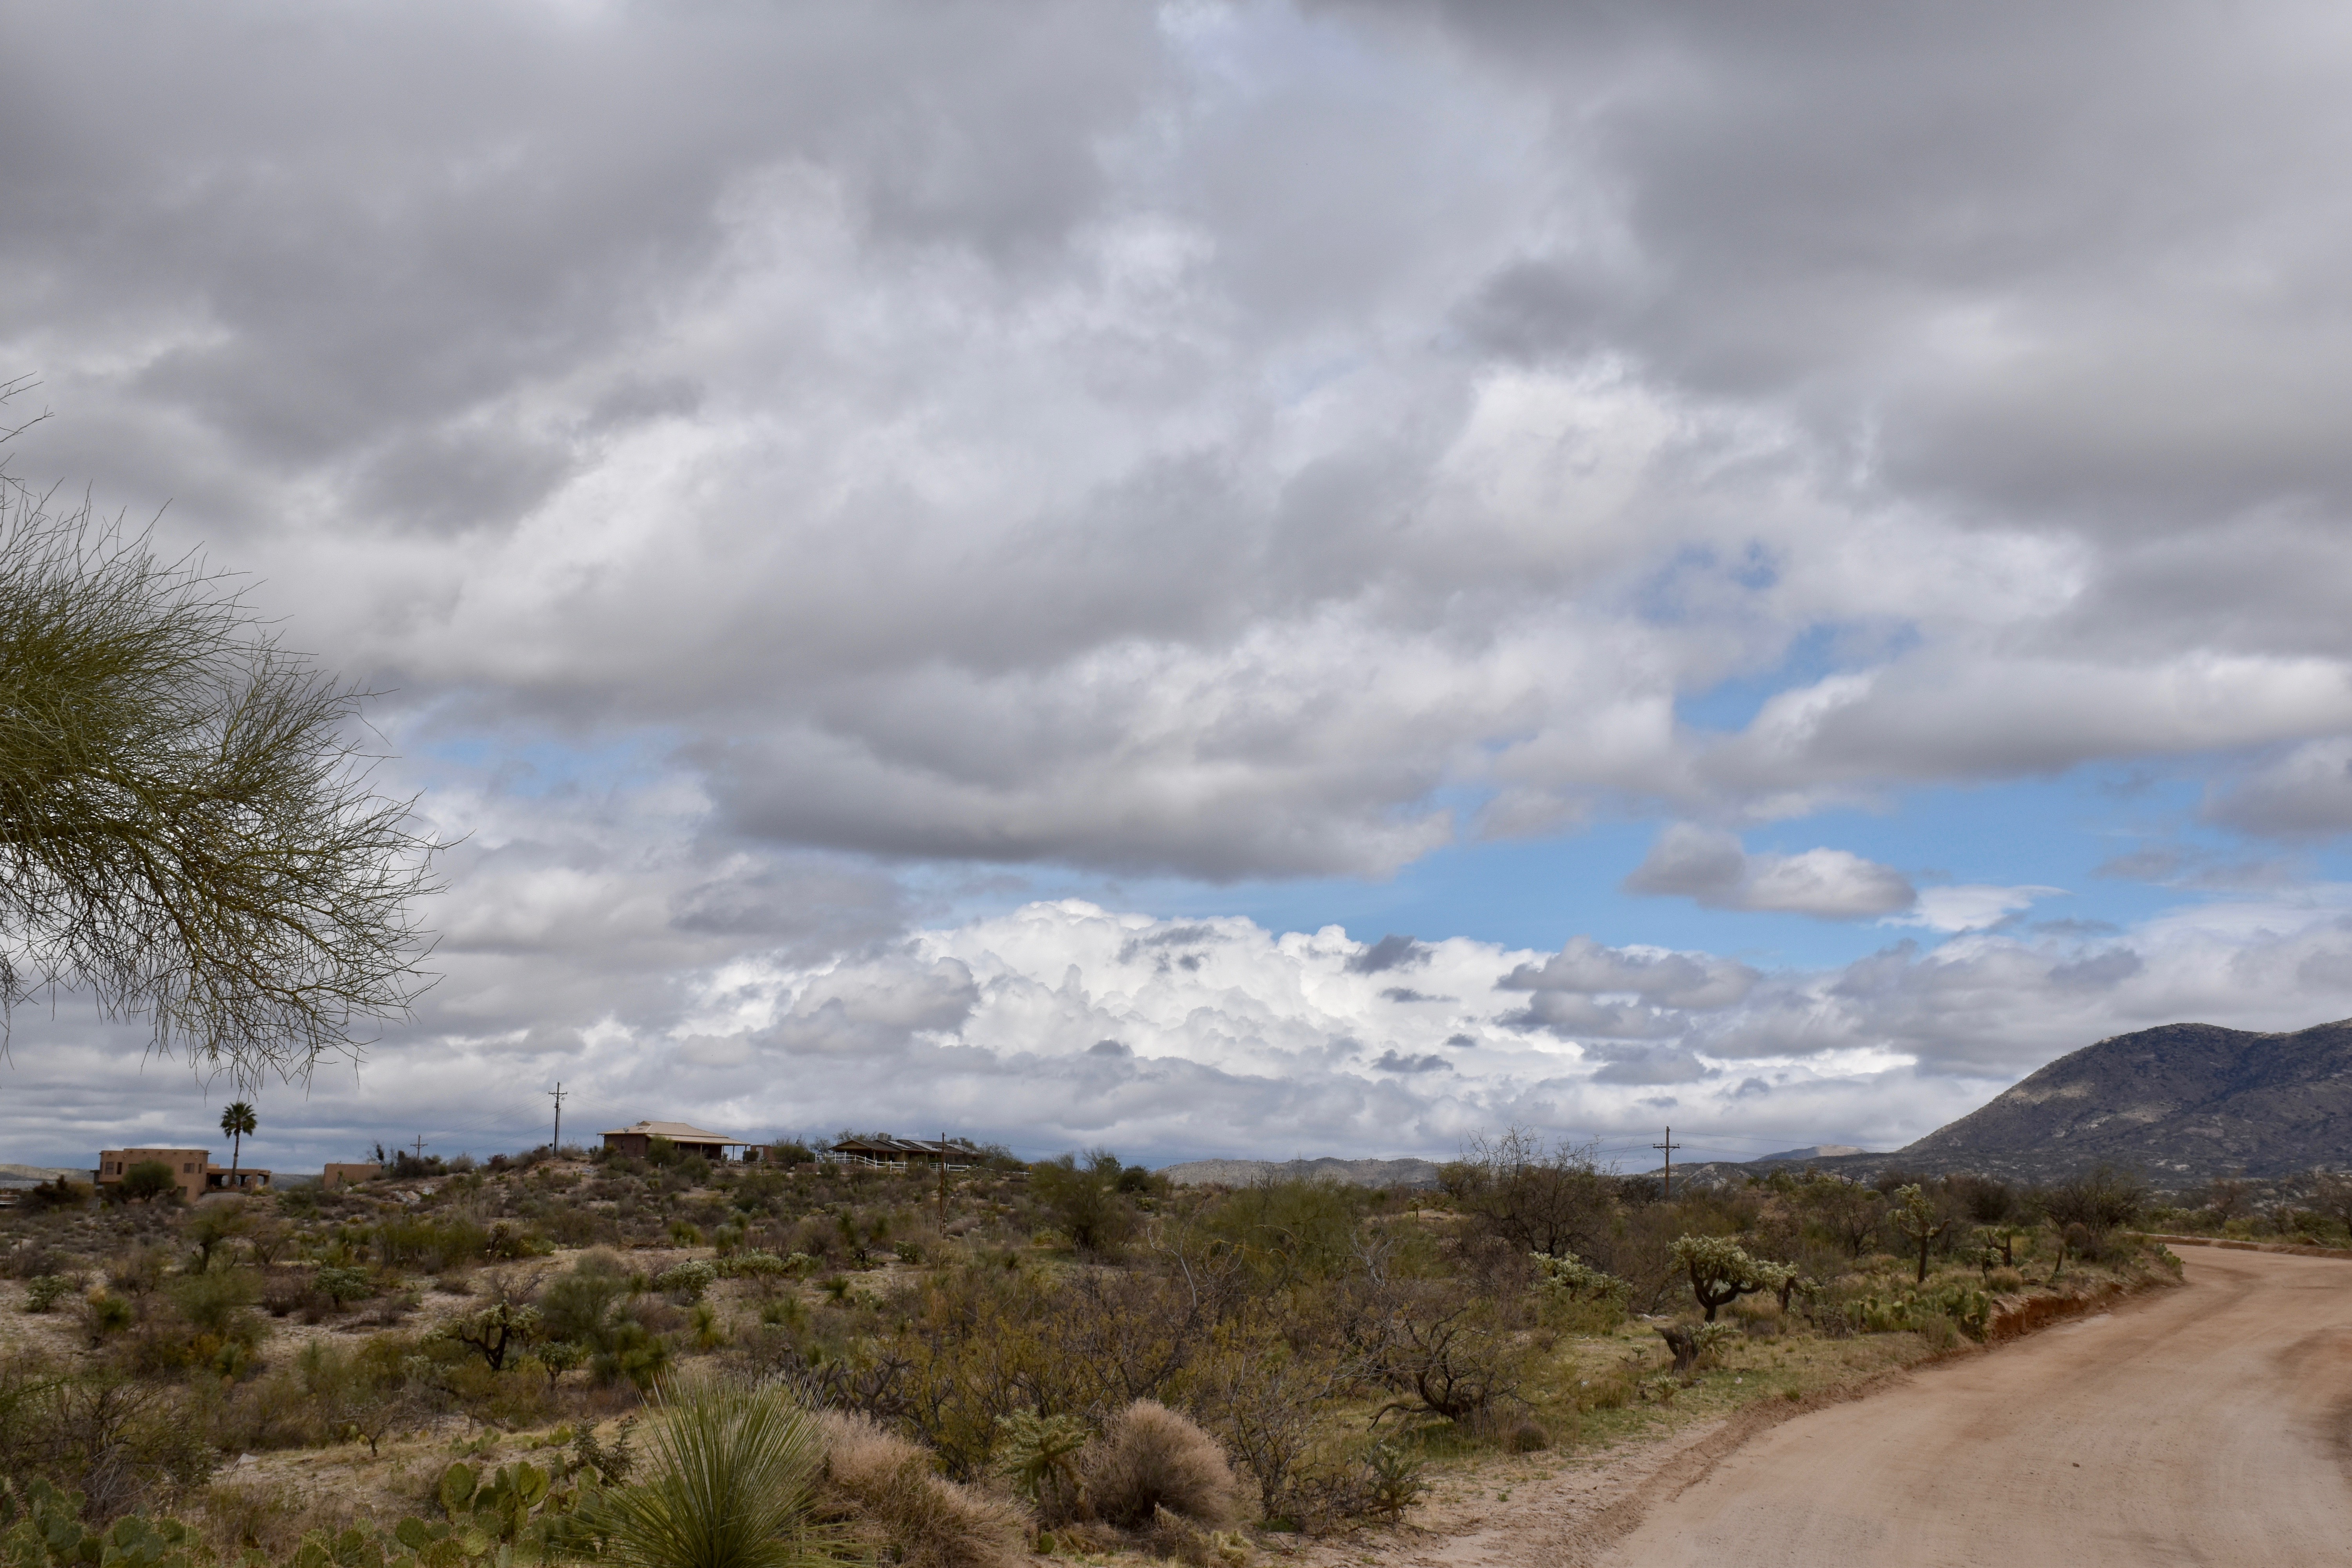
Well, let’s move ahead to sunnier conditions, those pretty scenes we see on the mountains when a storm begins to clear out.
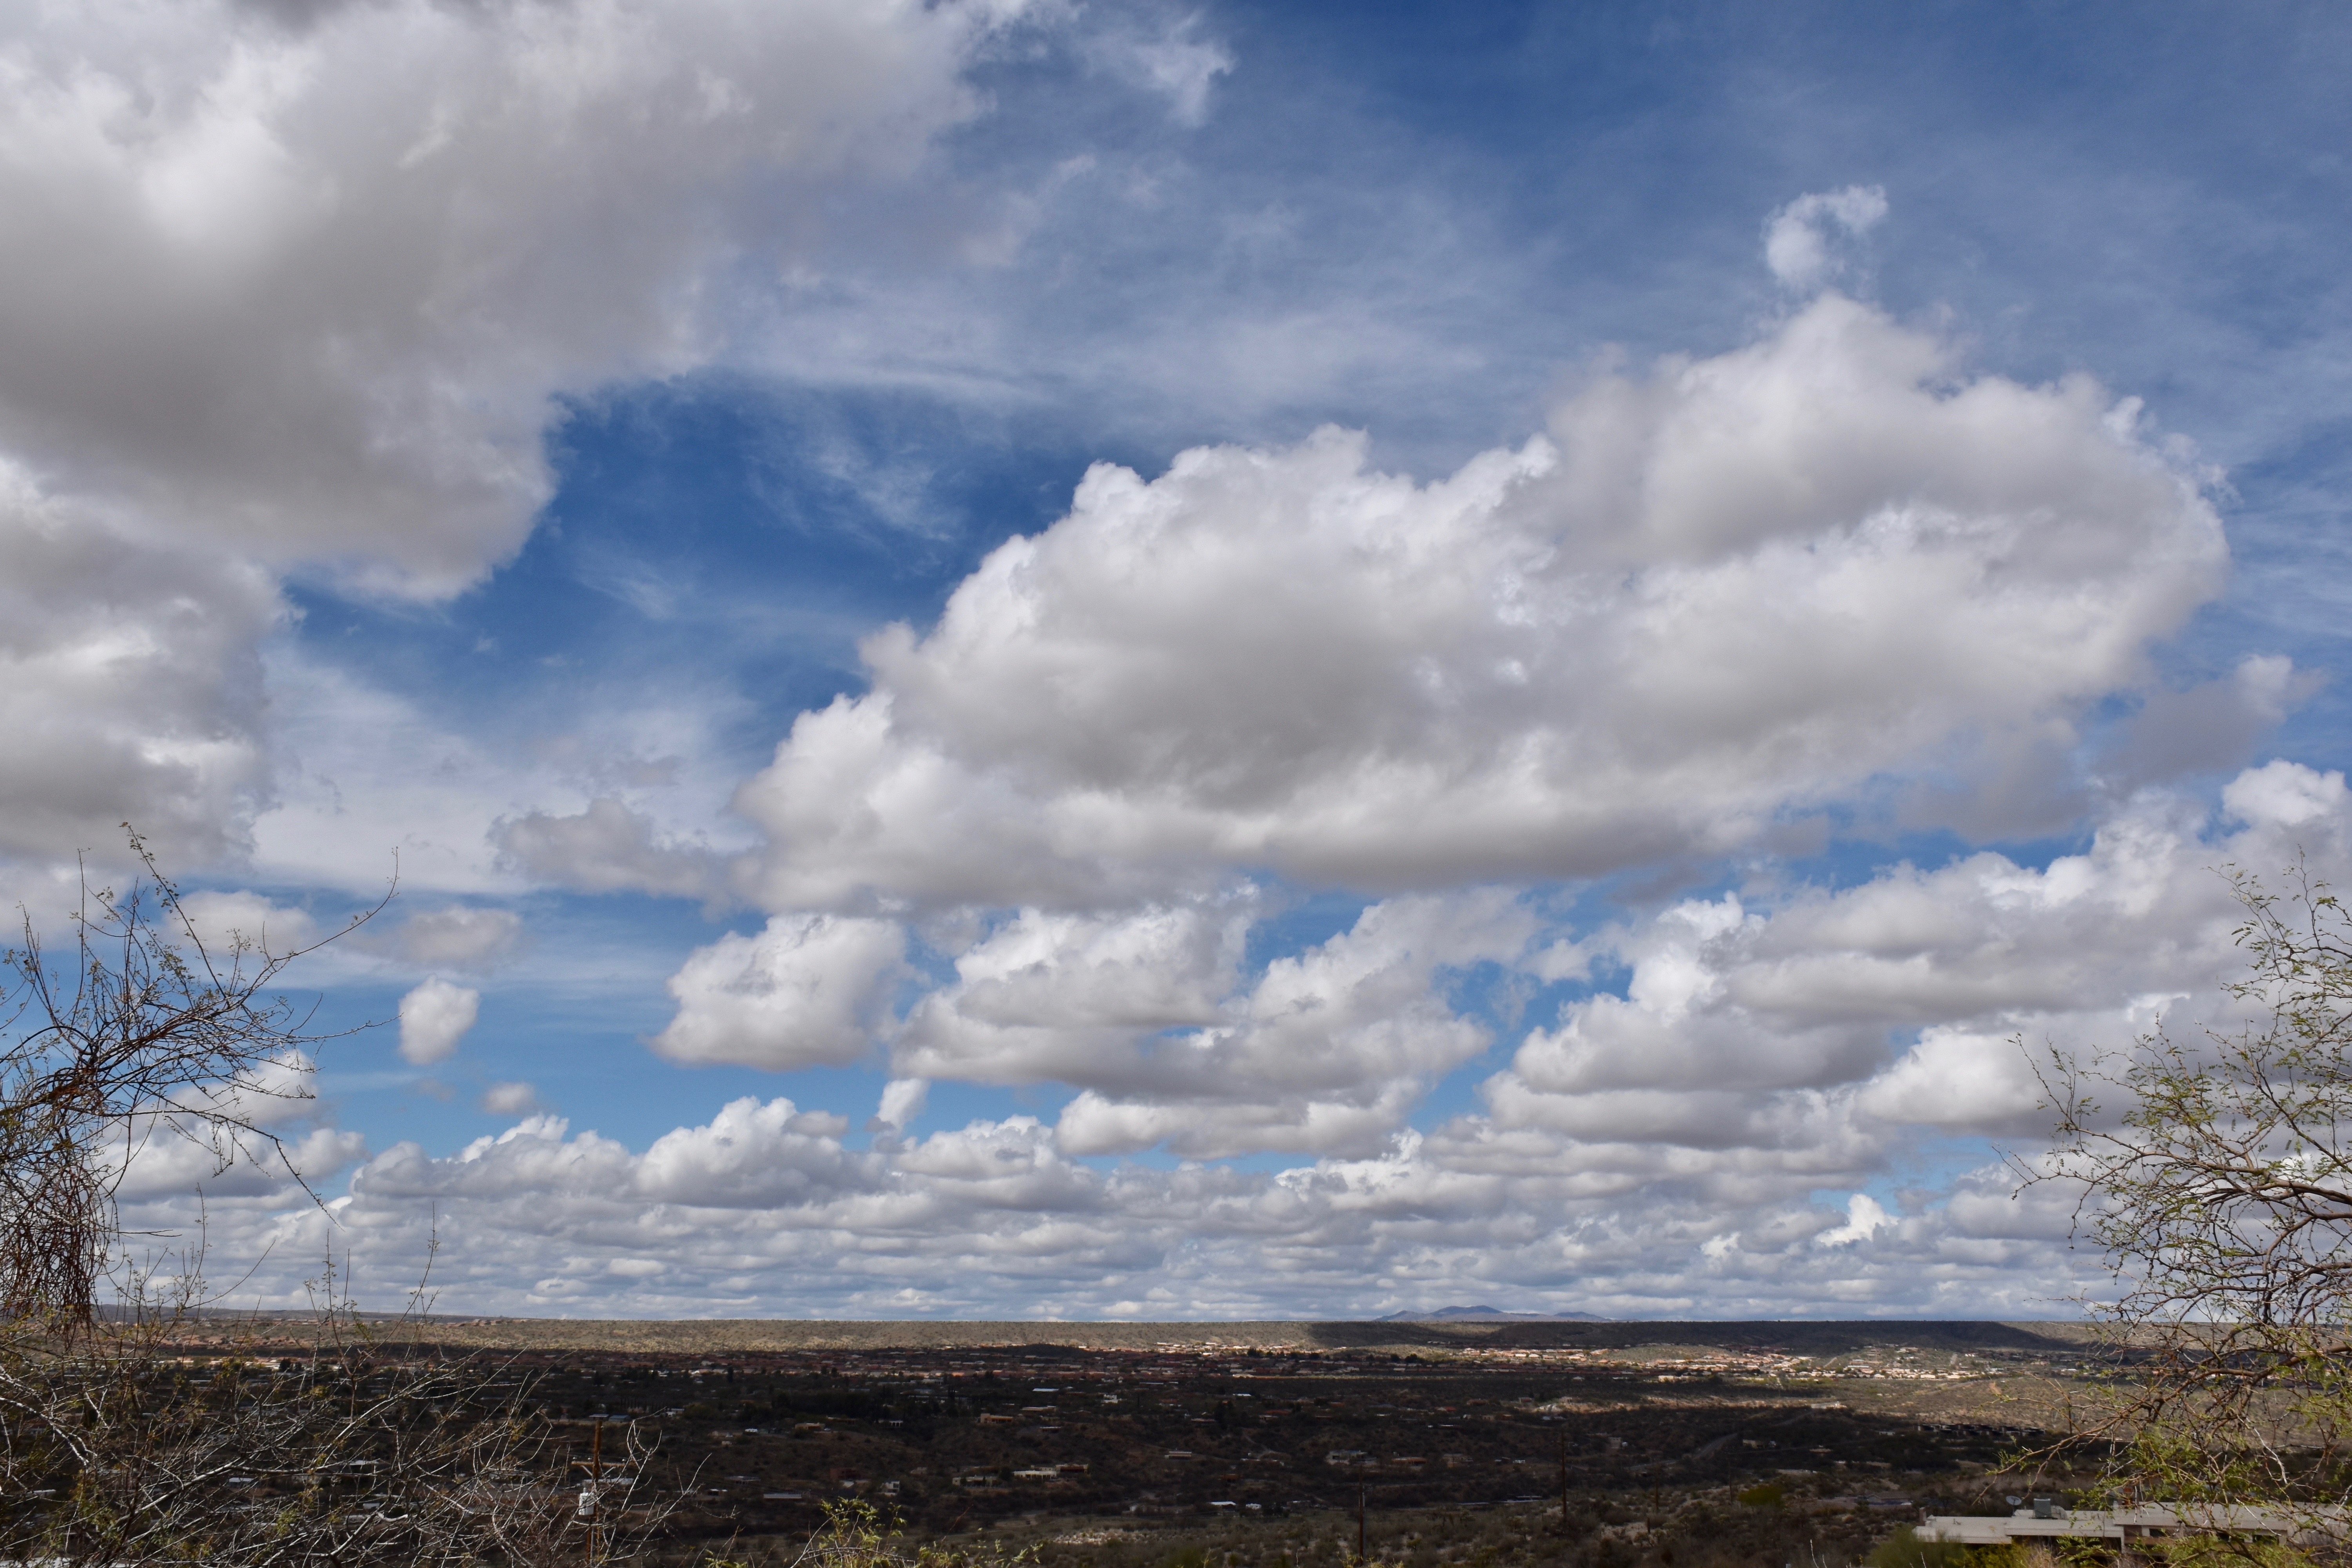
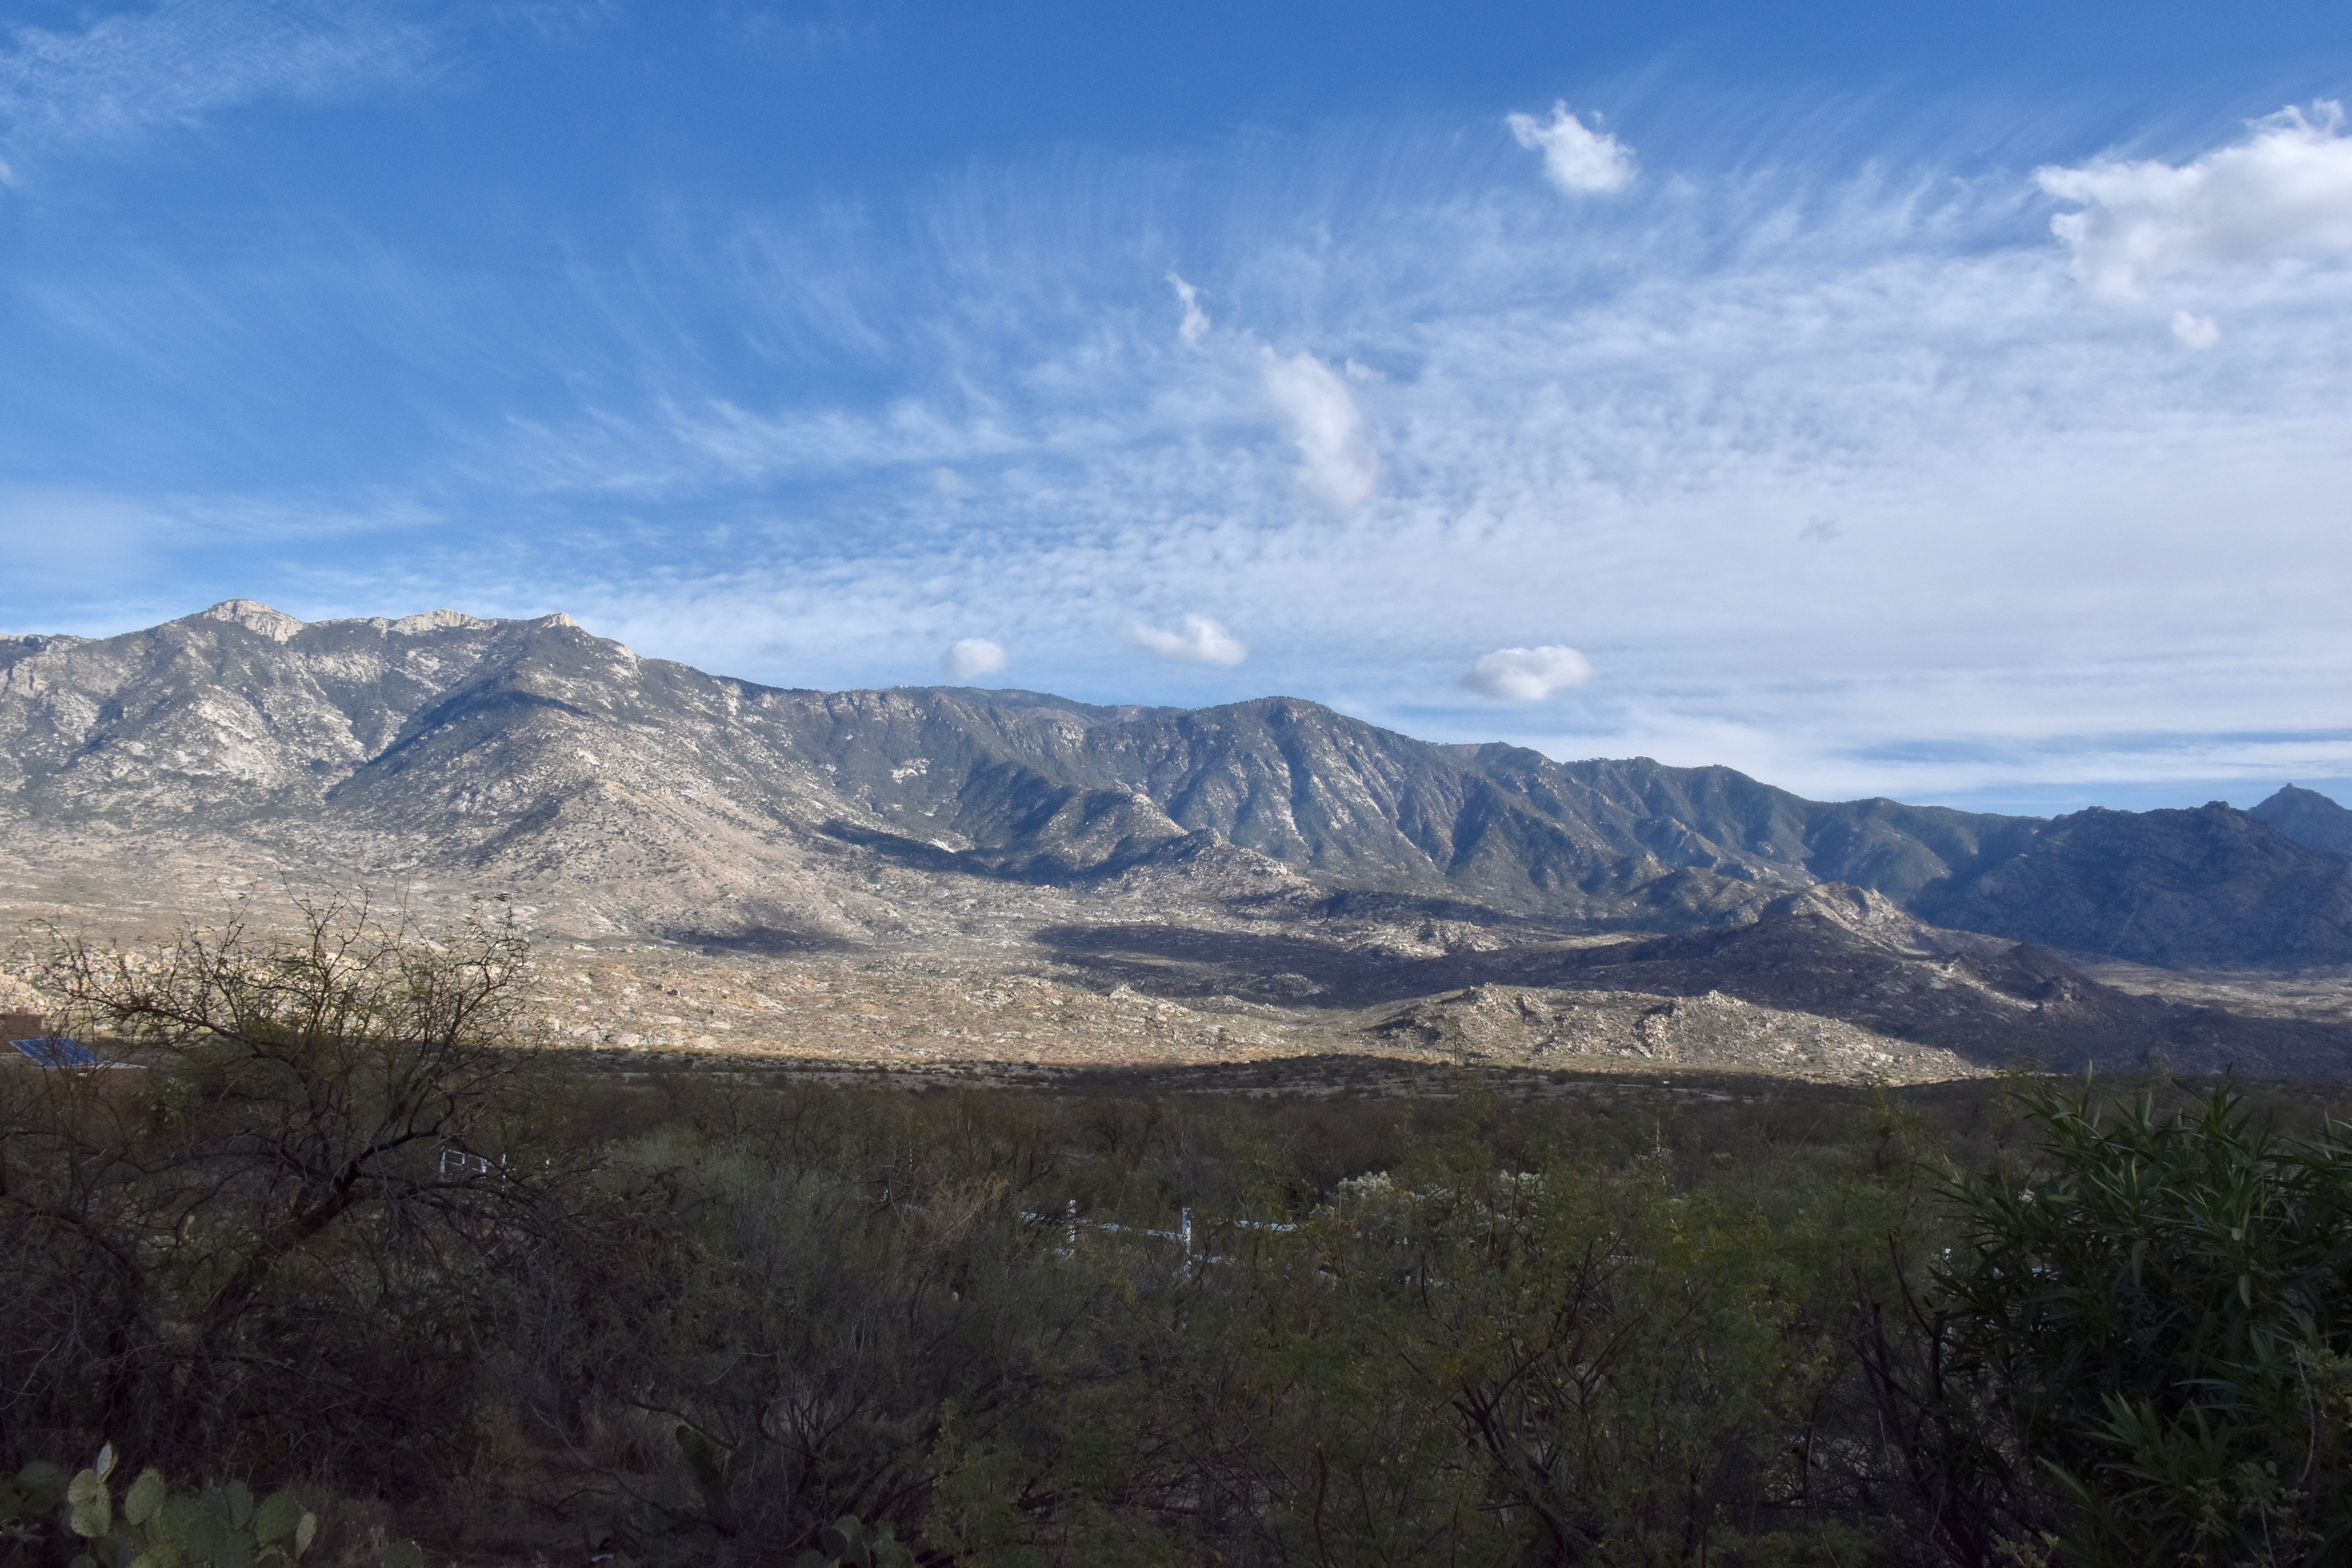
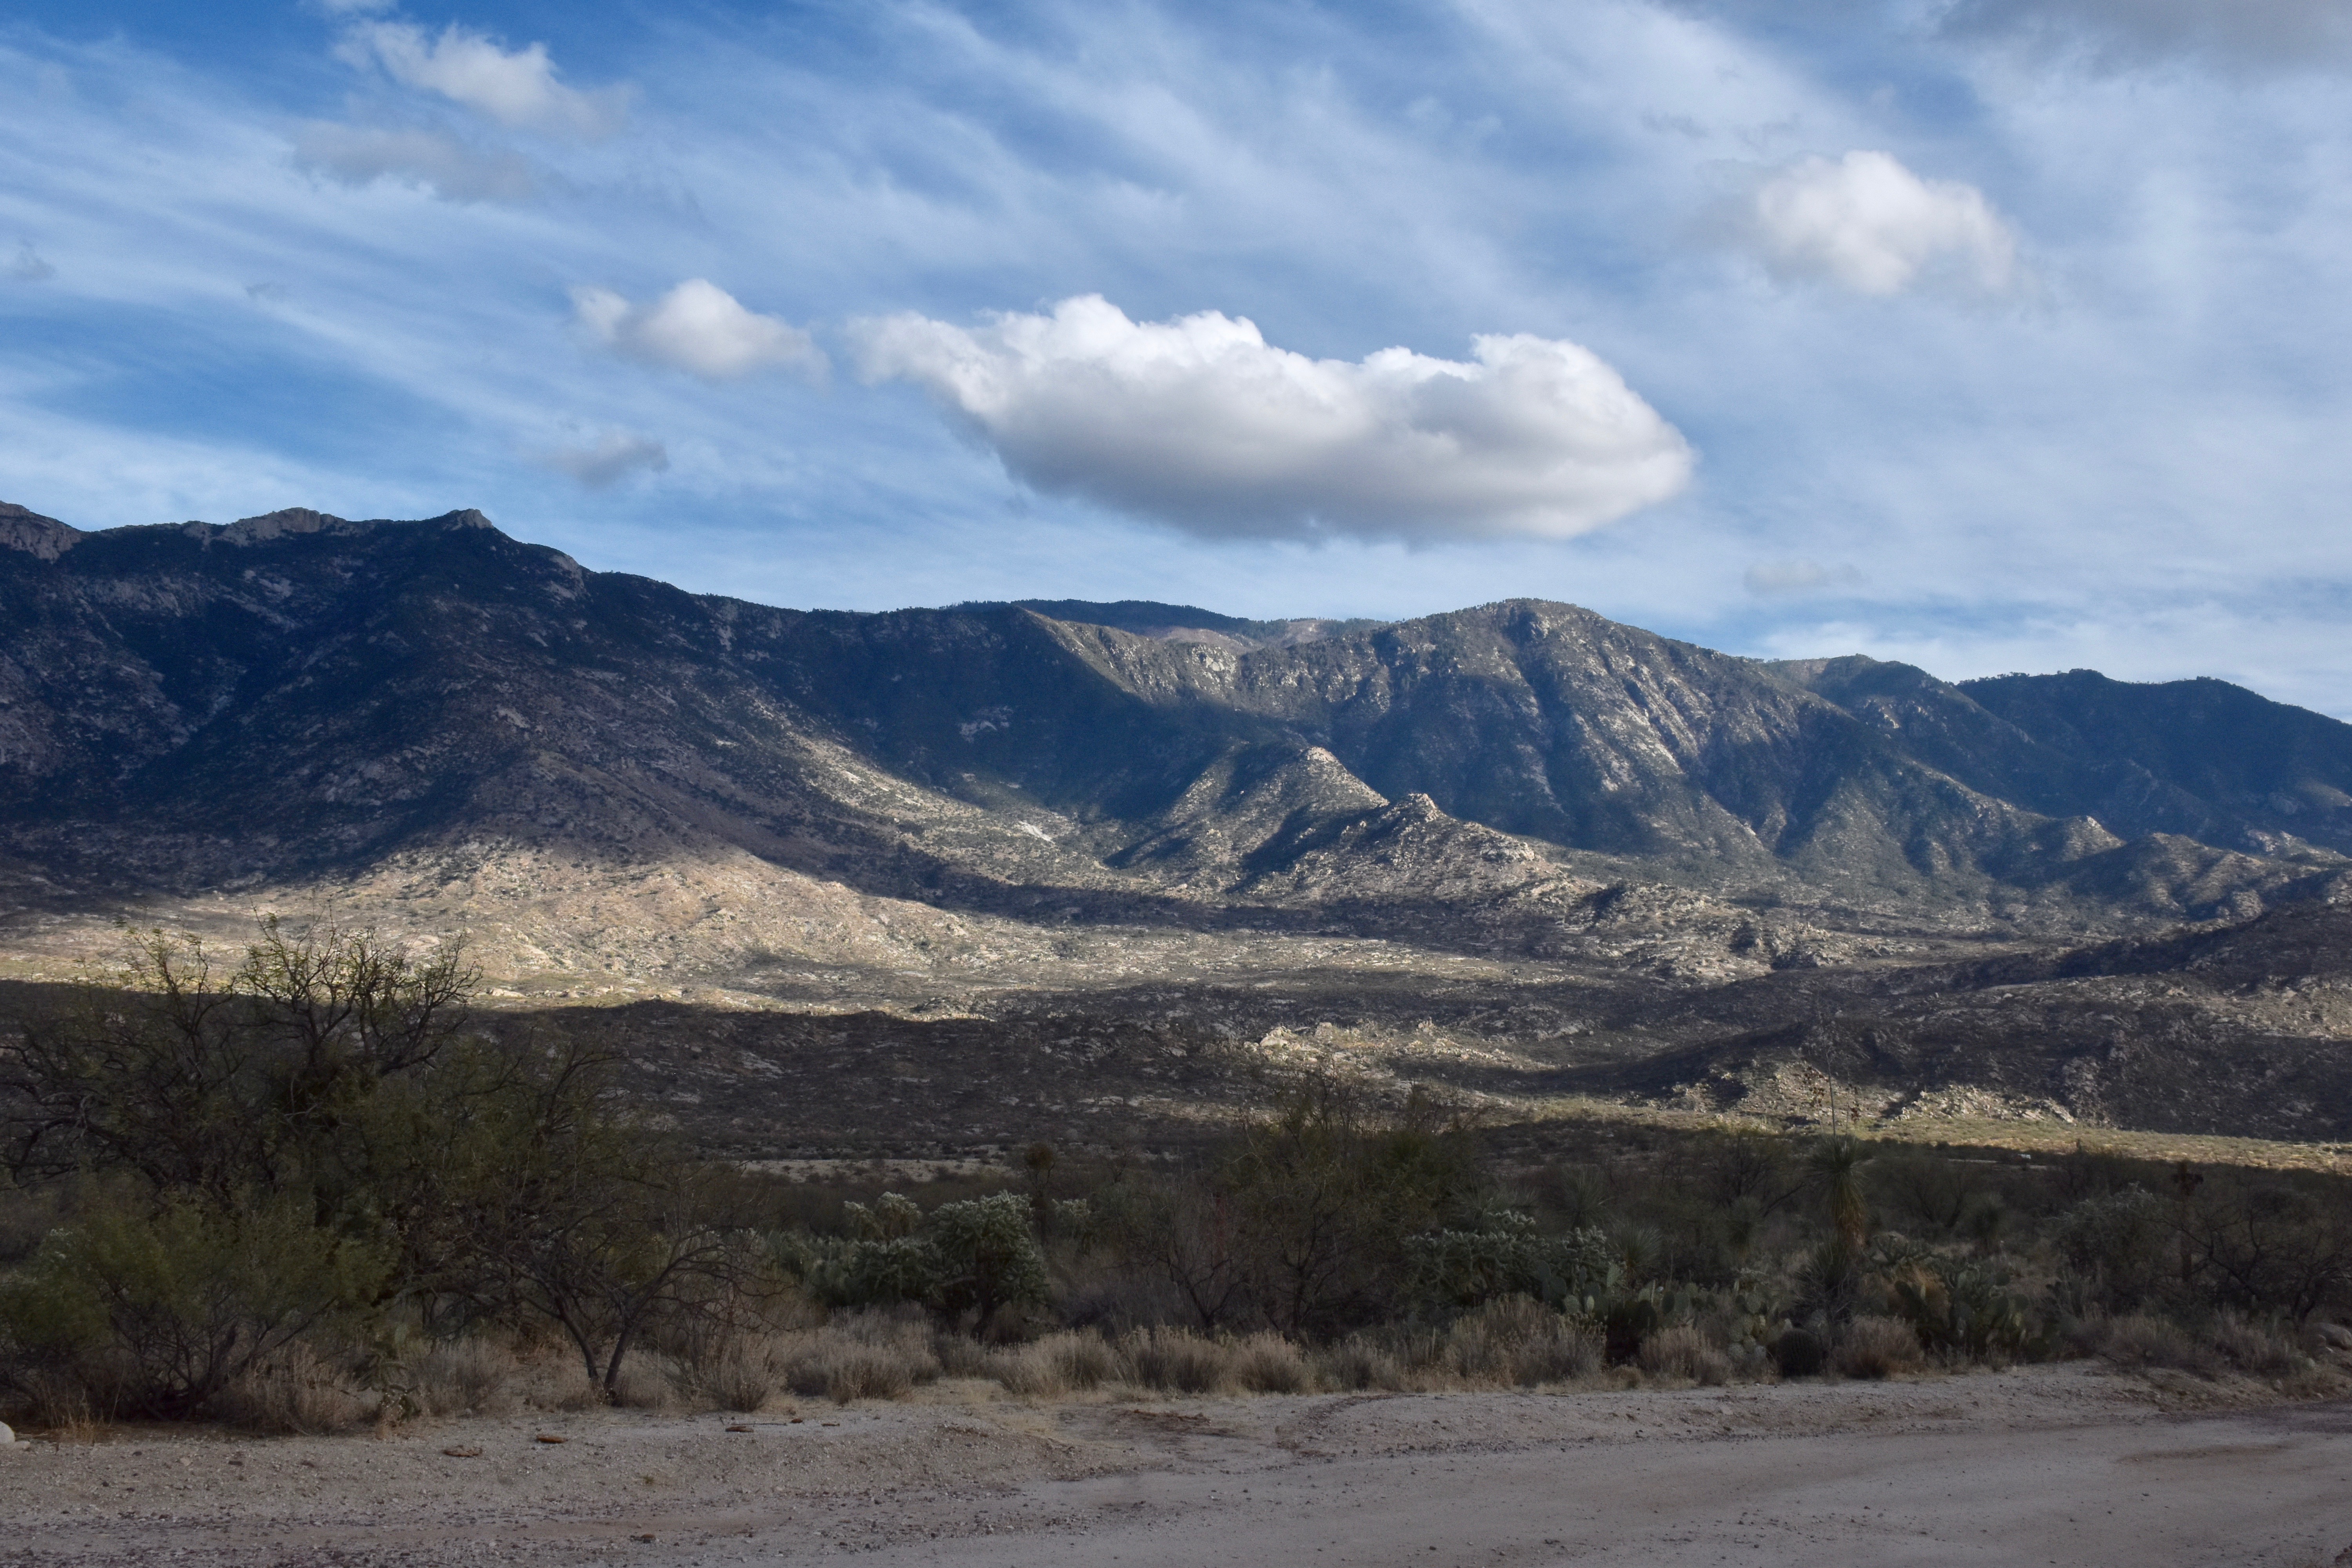
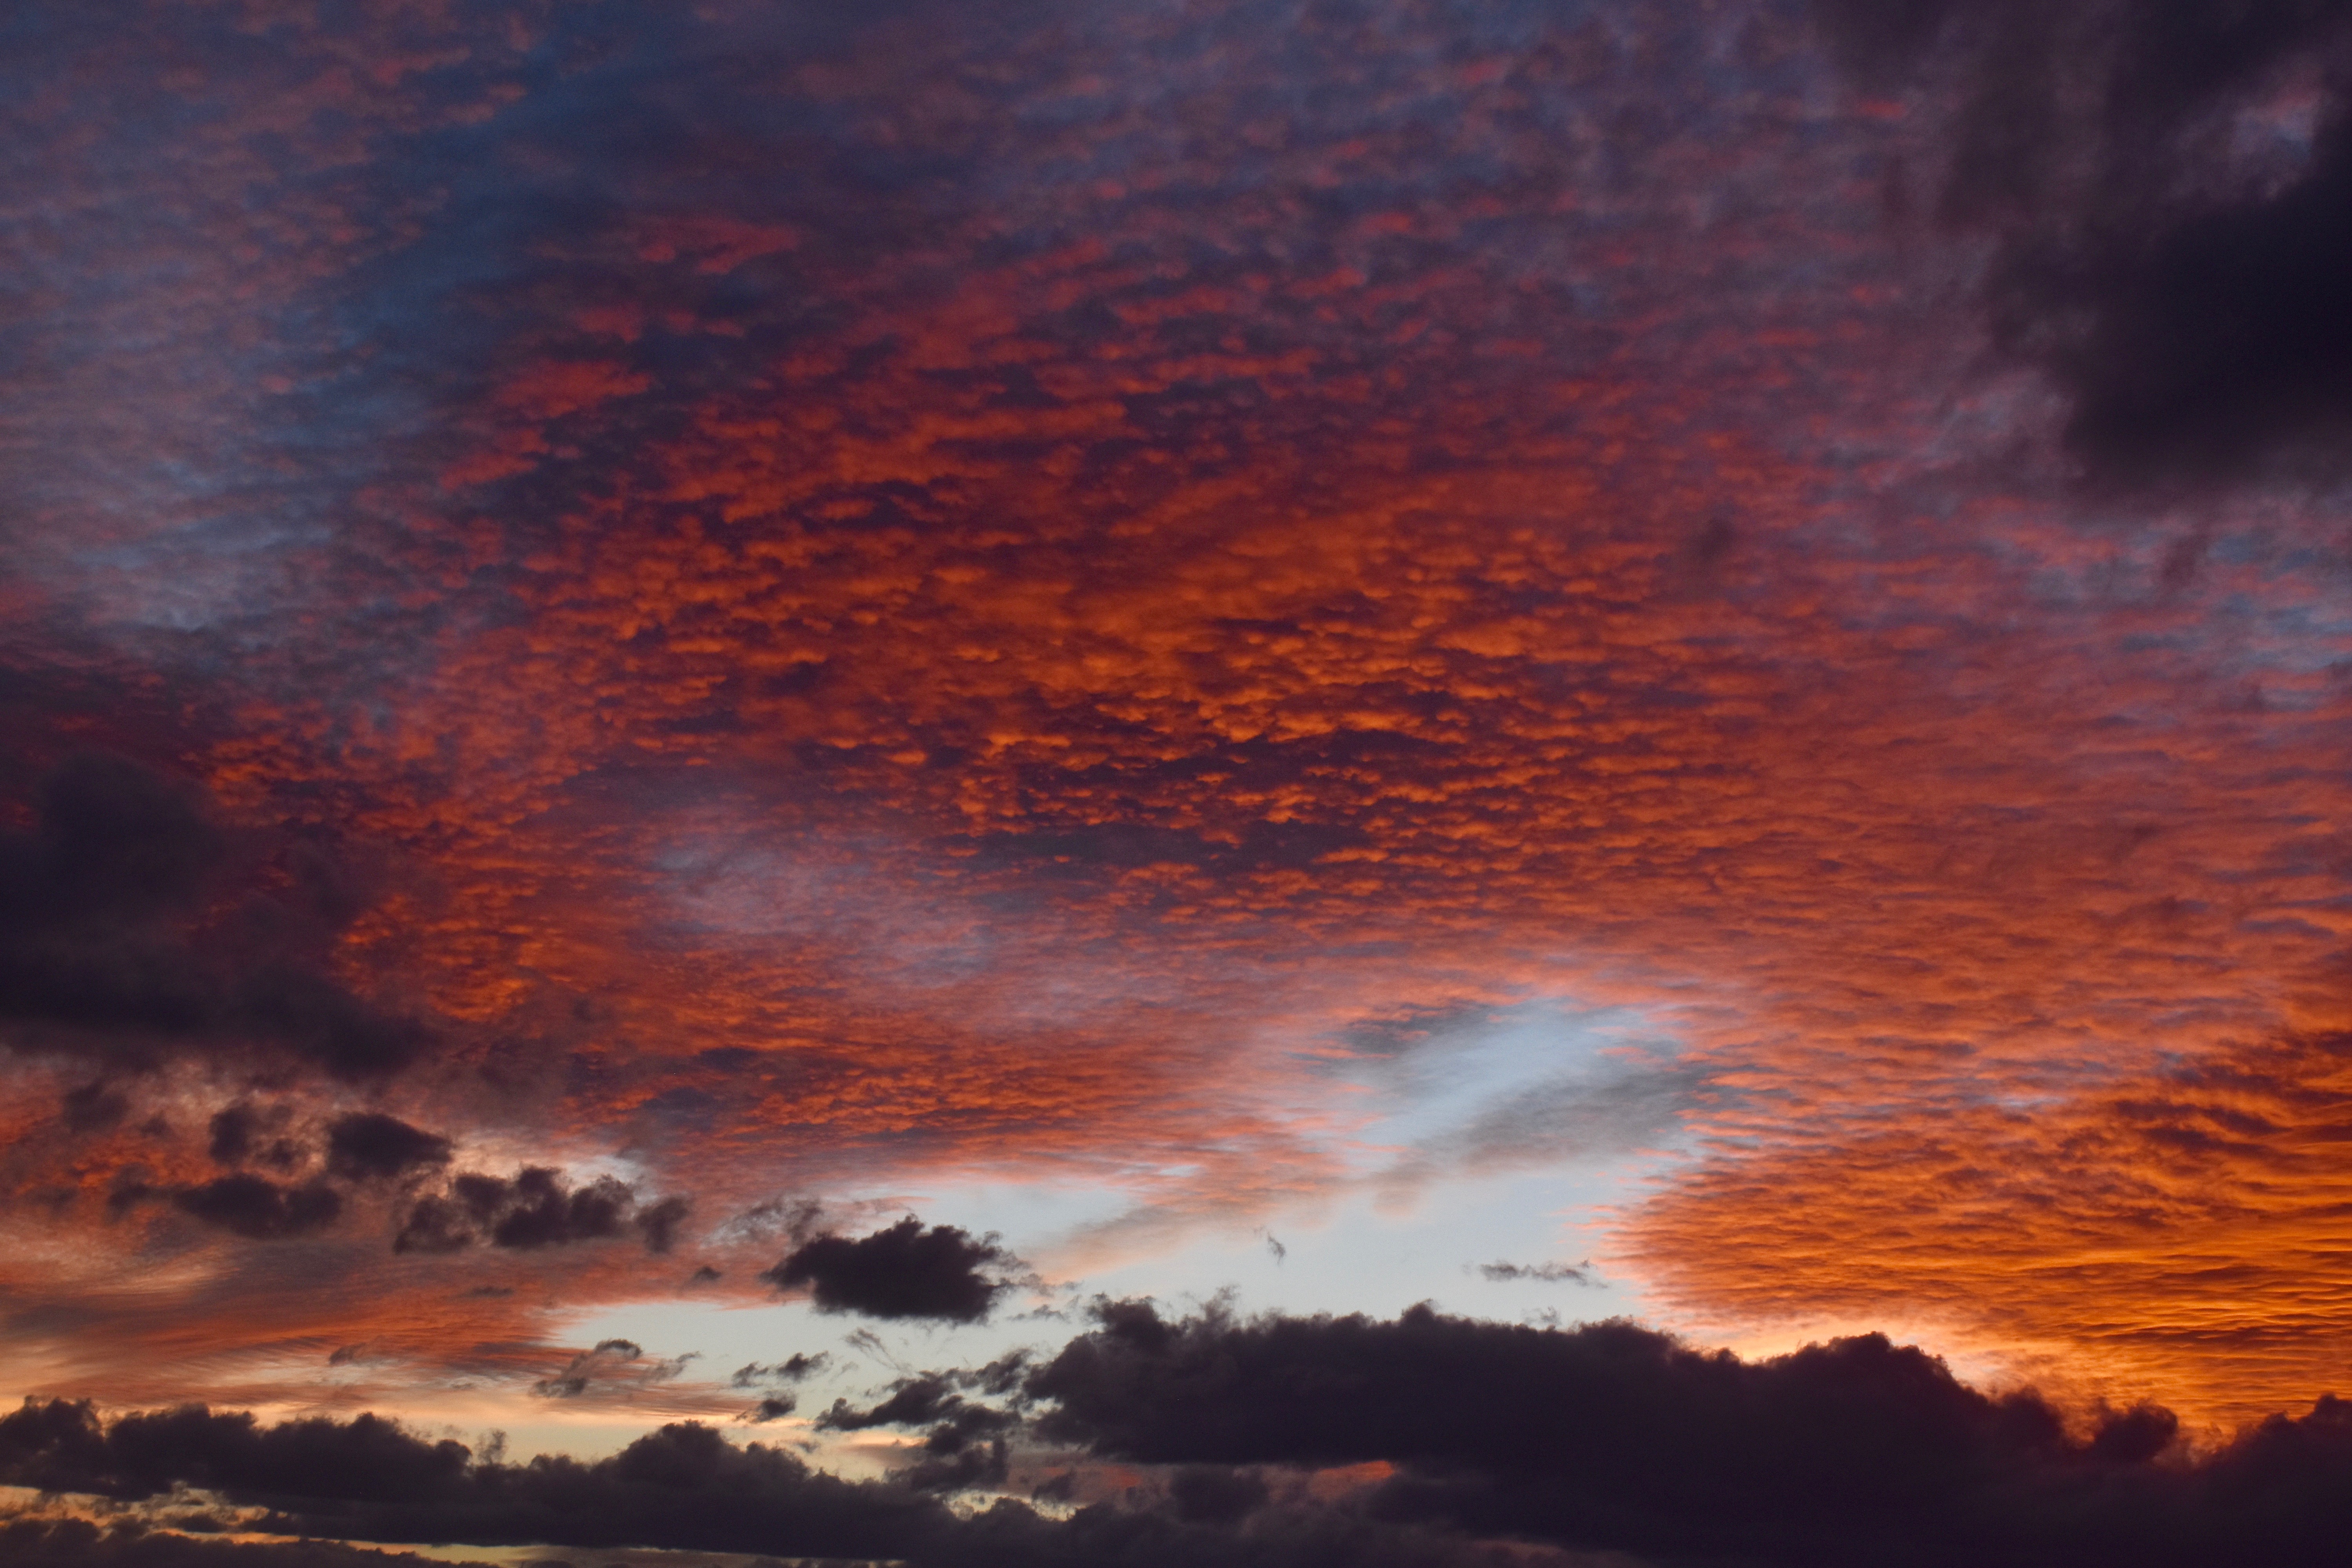
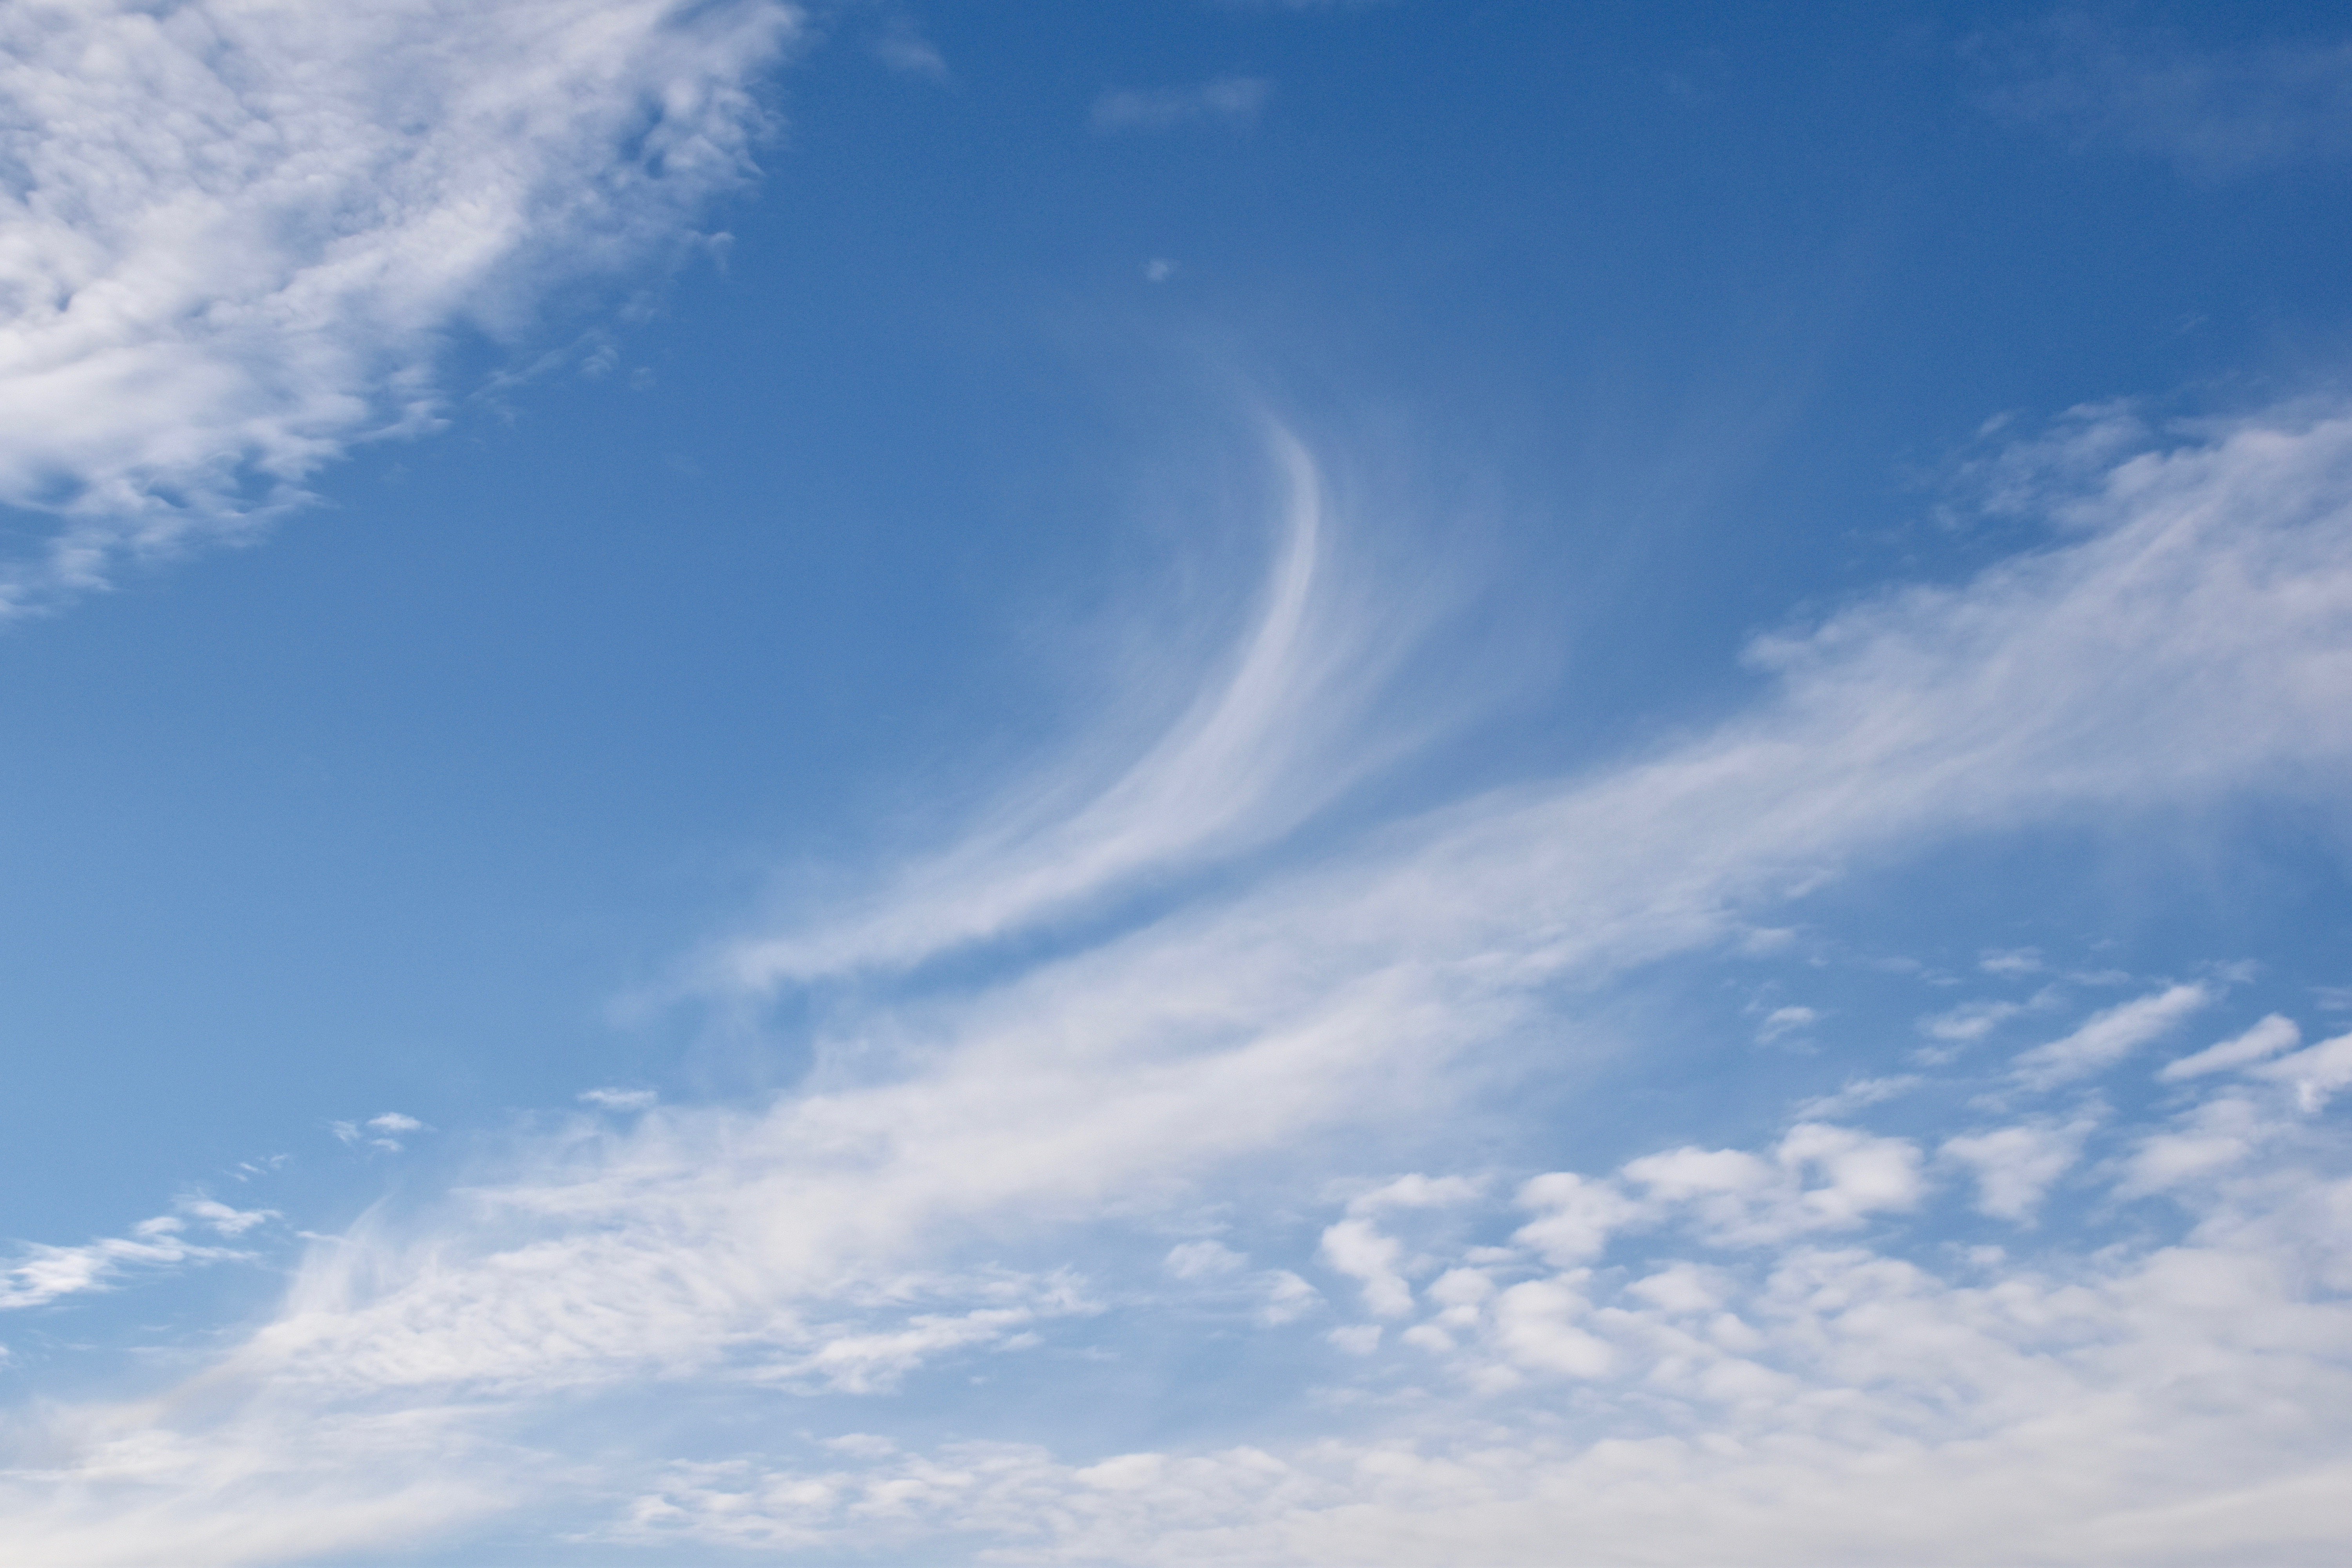
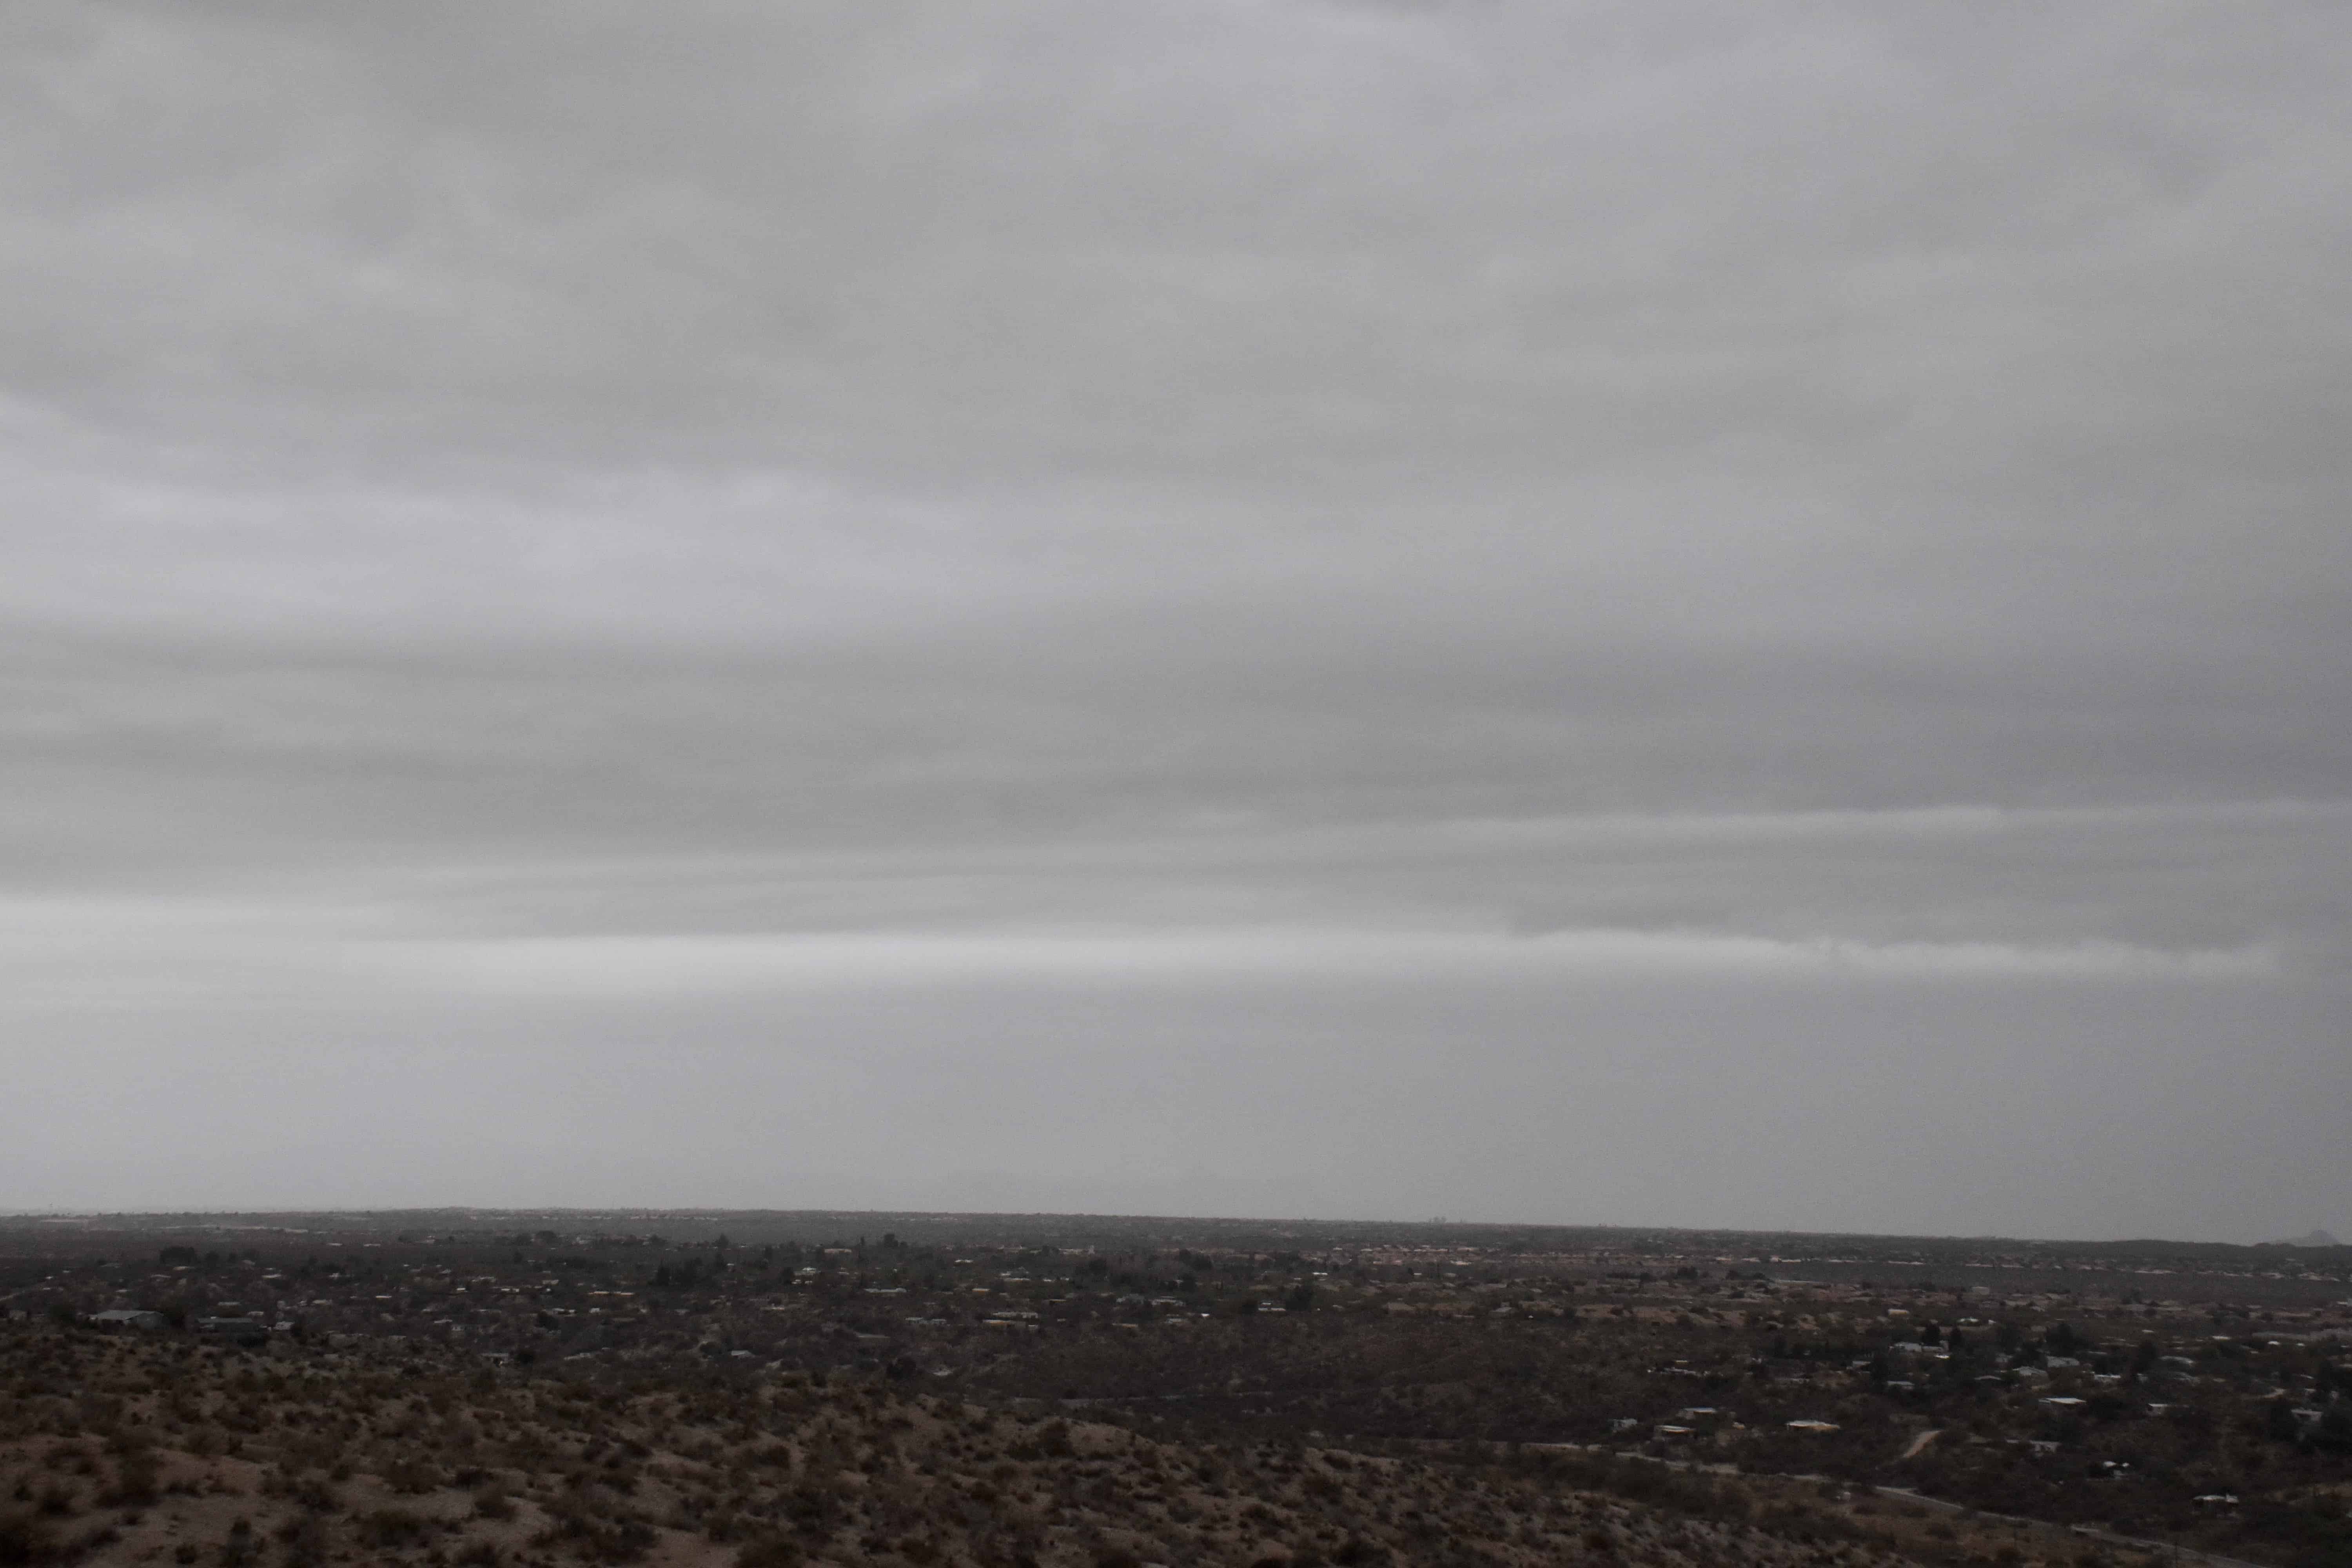
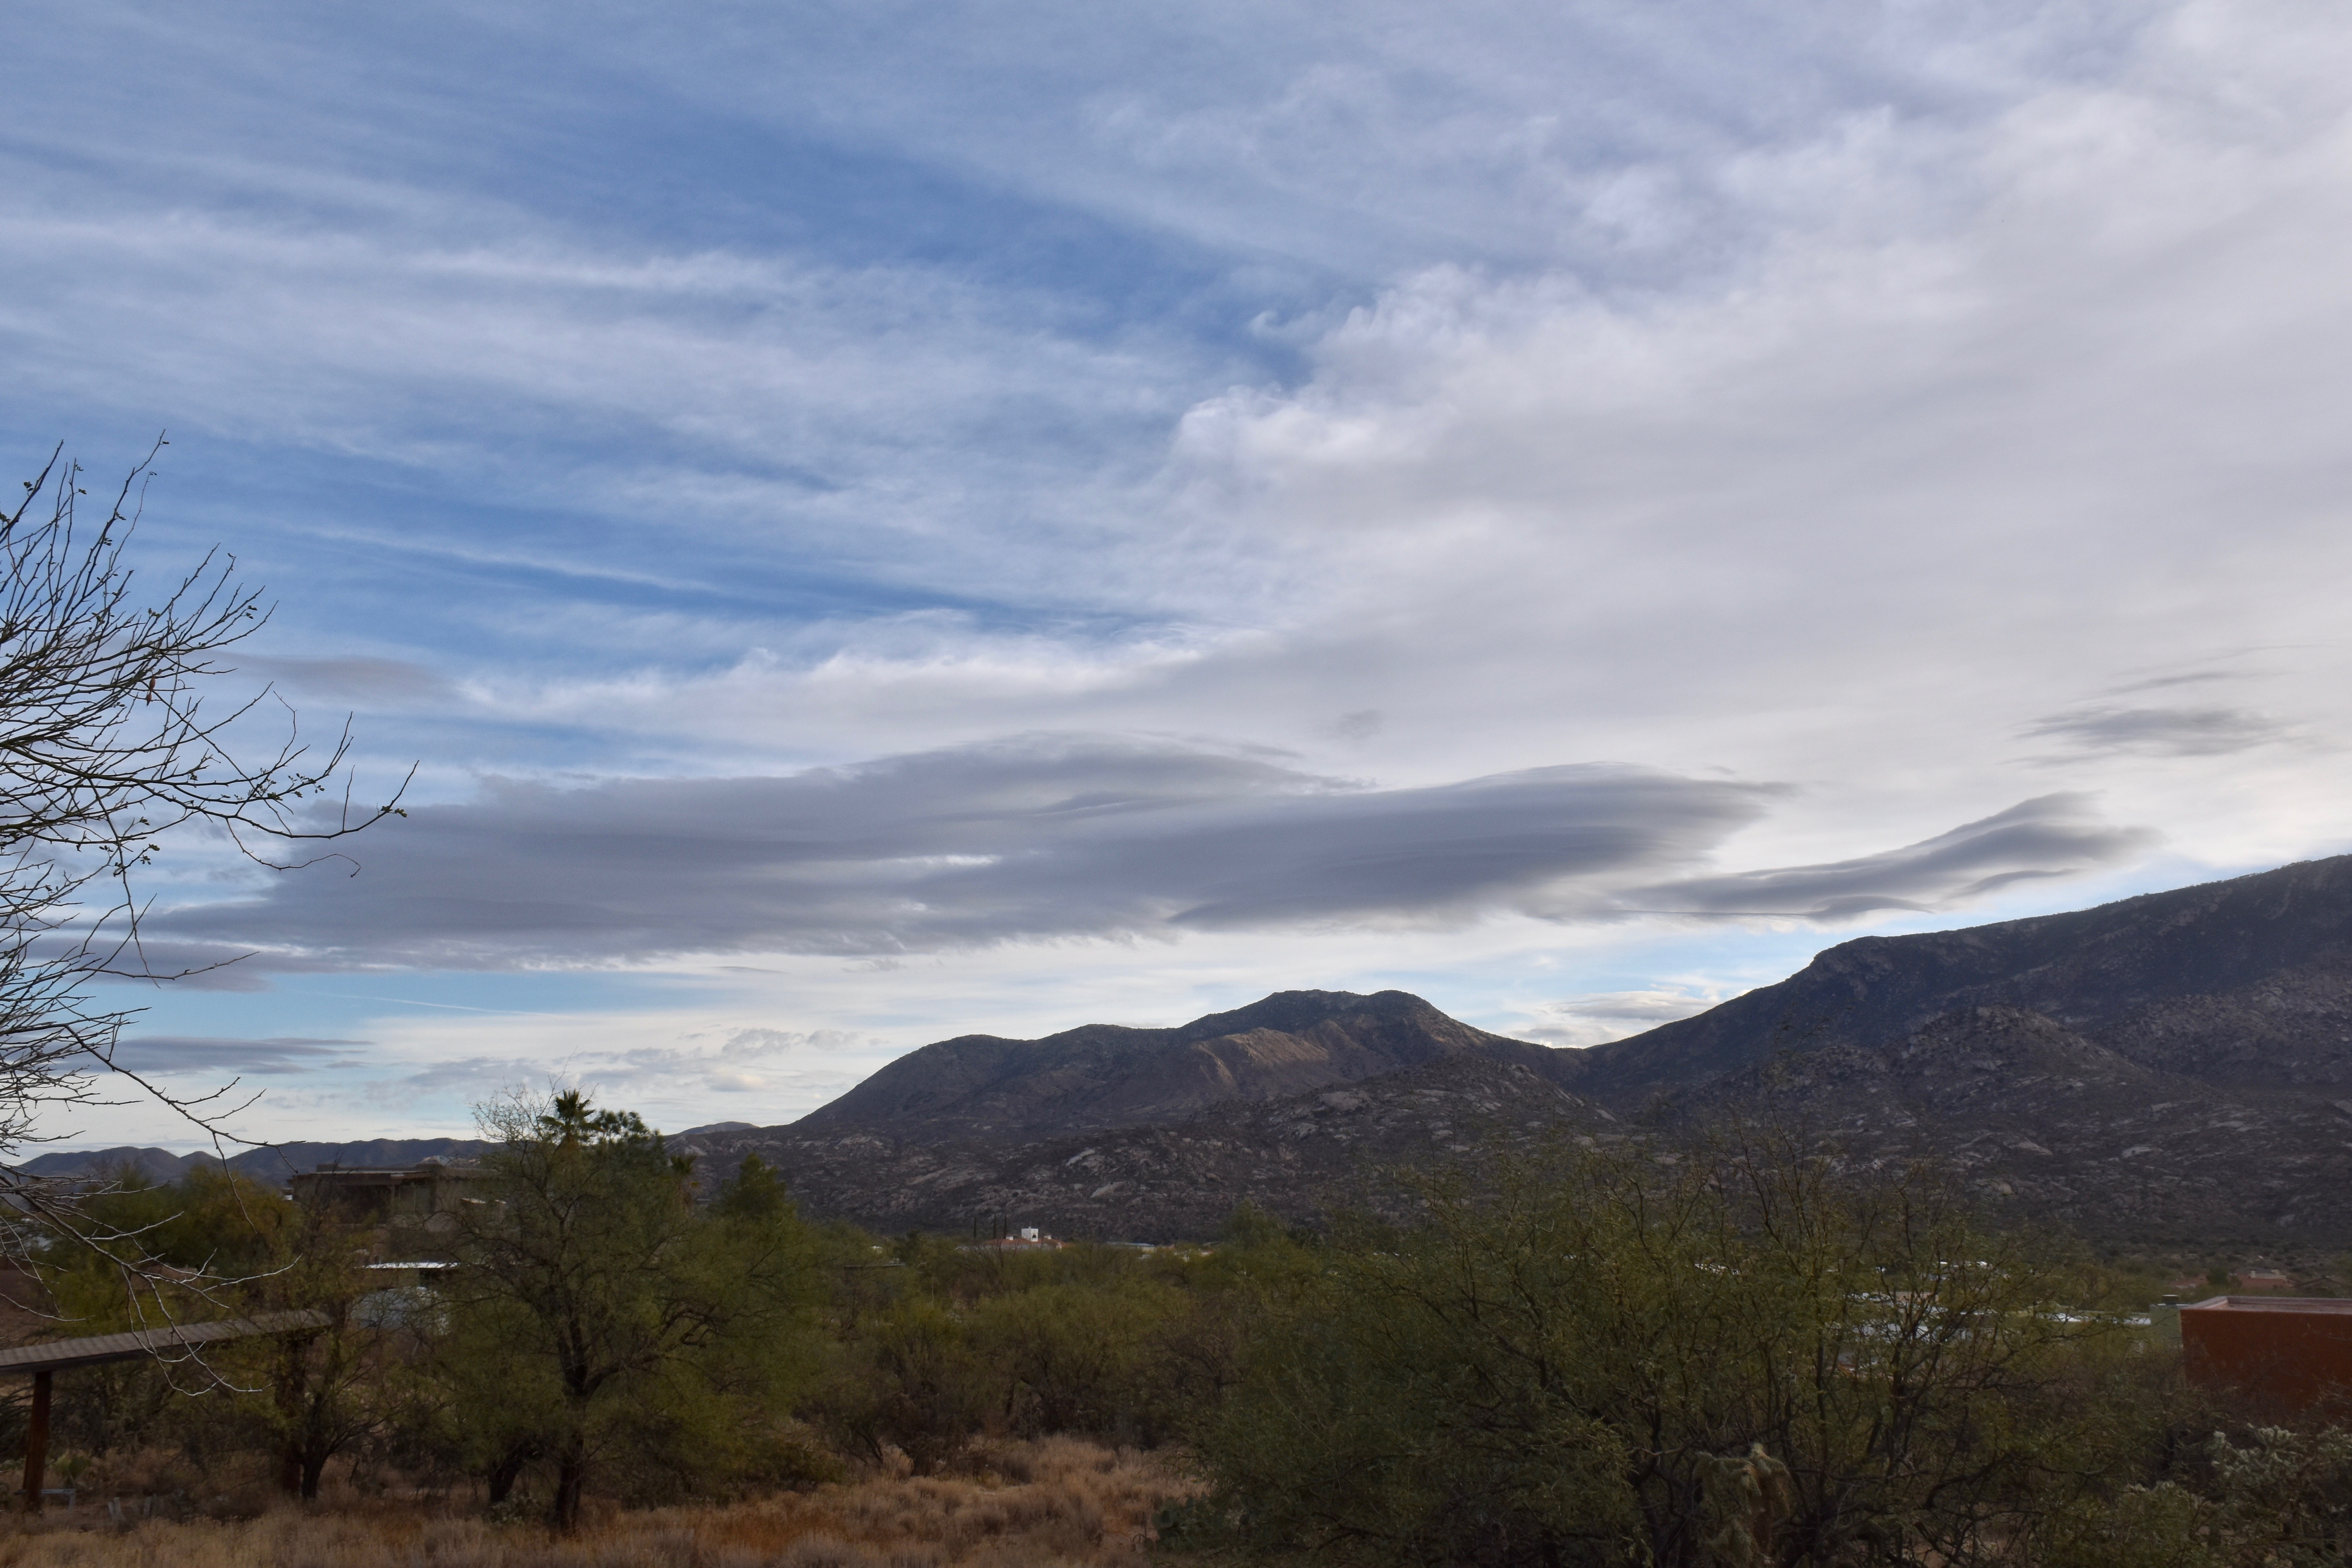
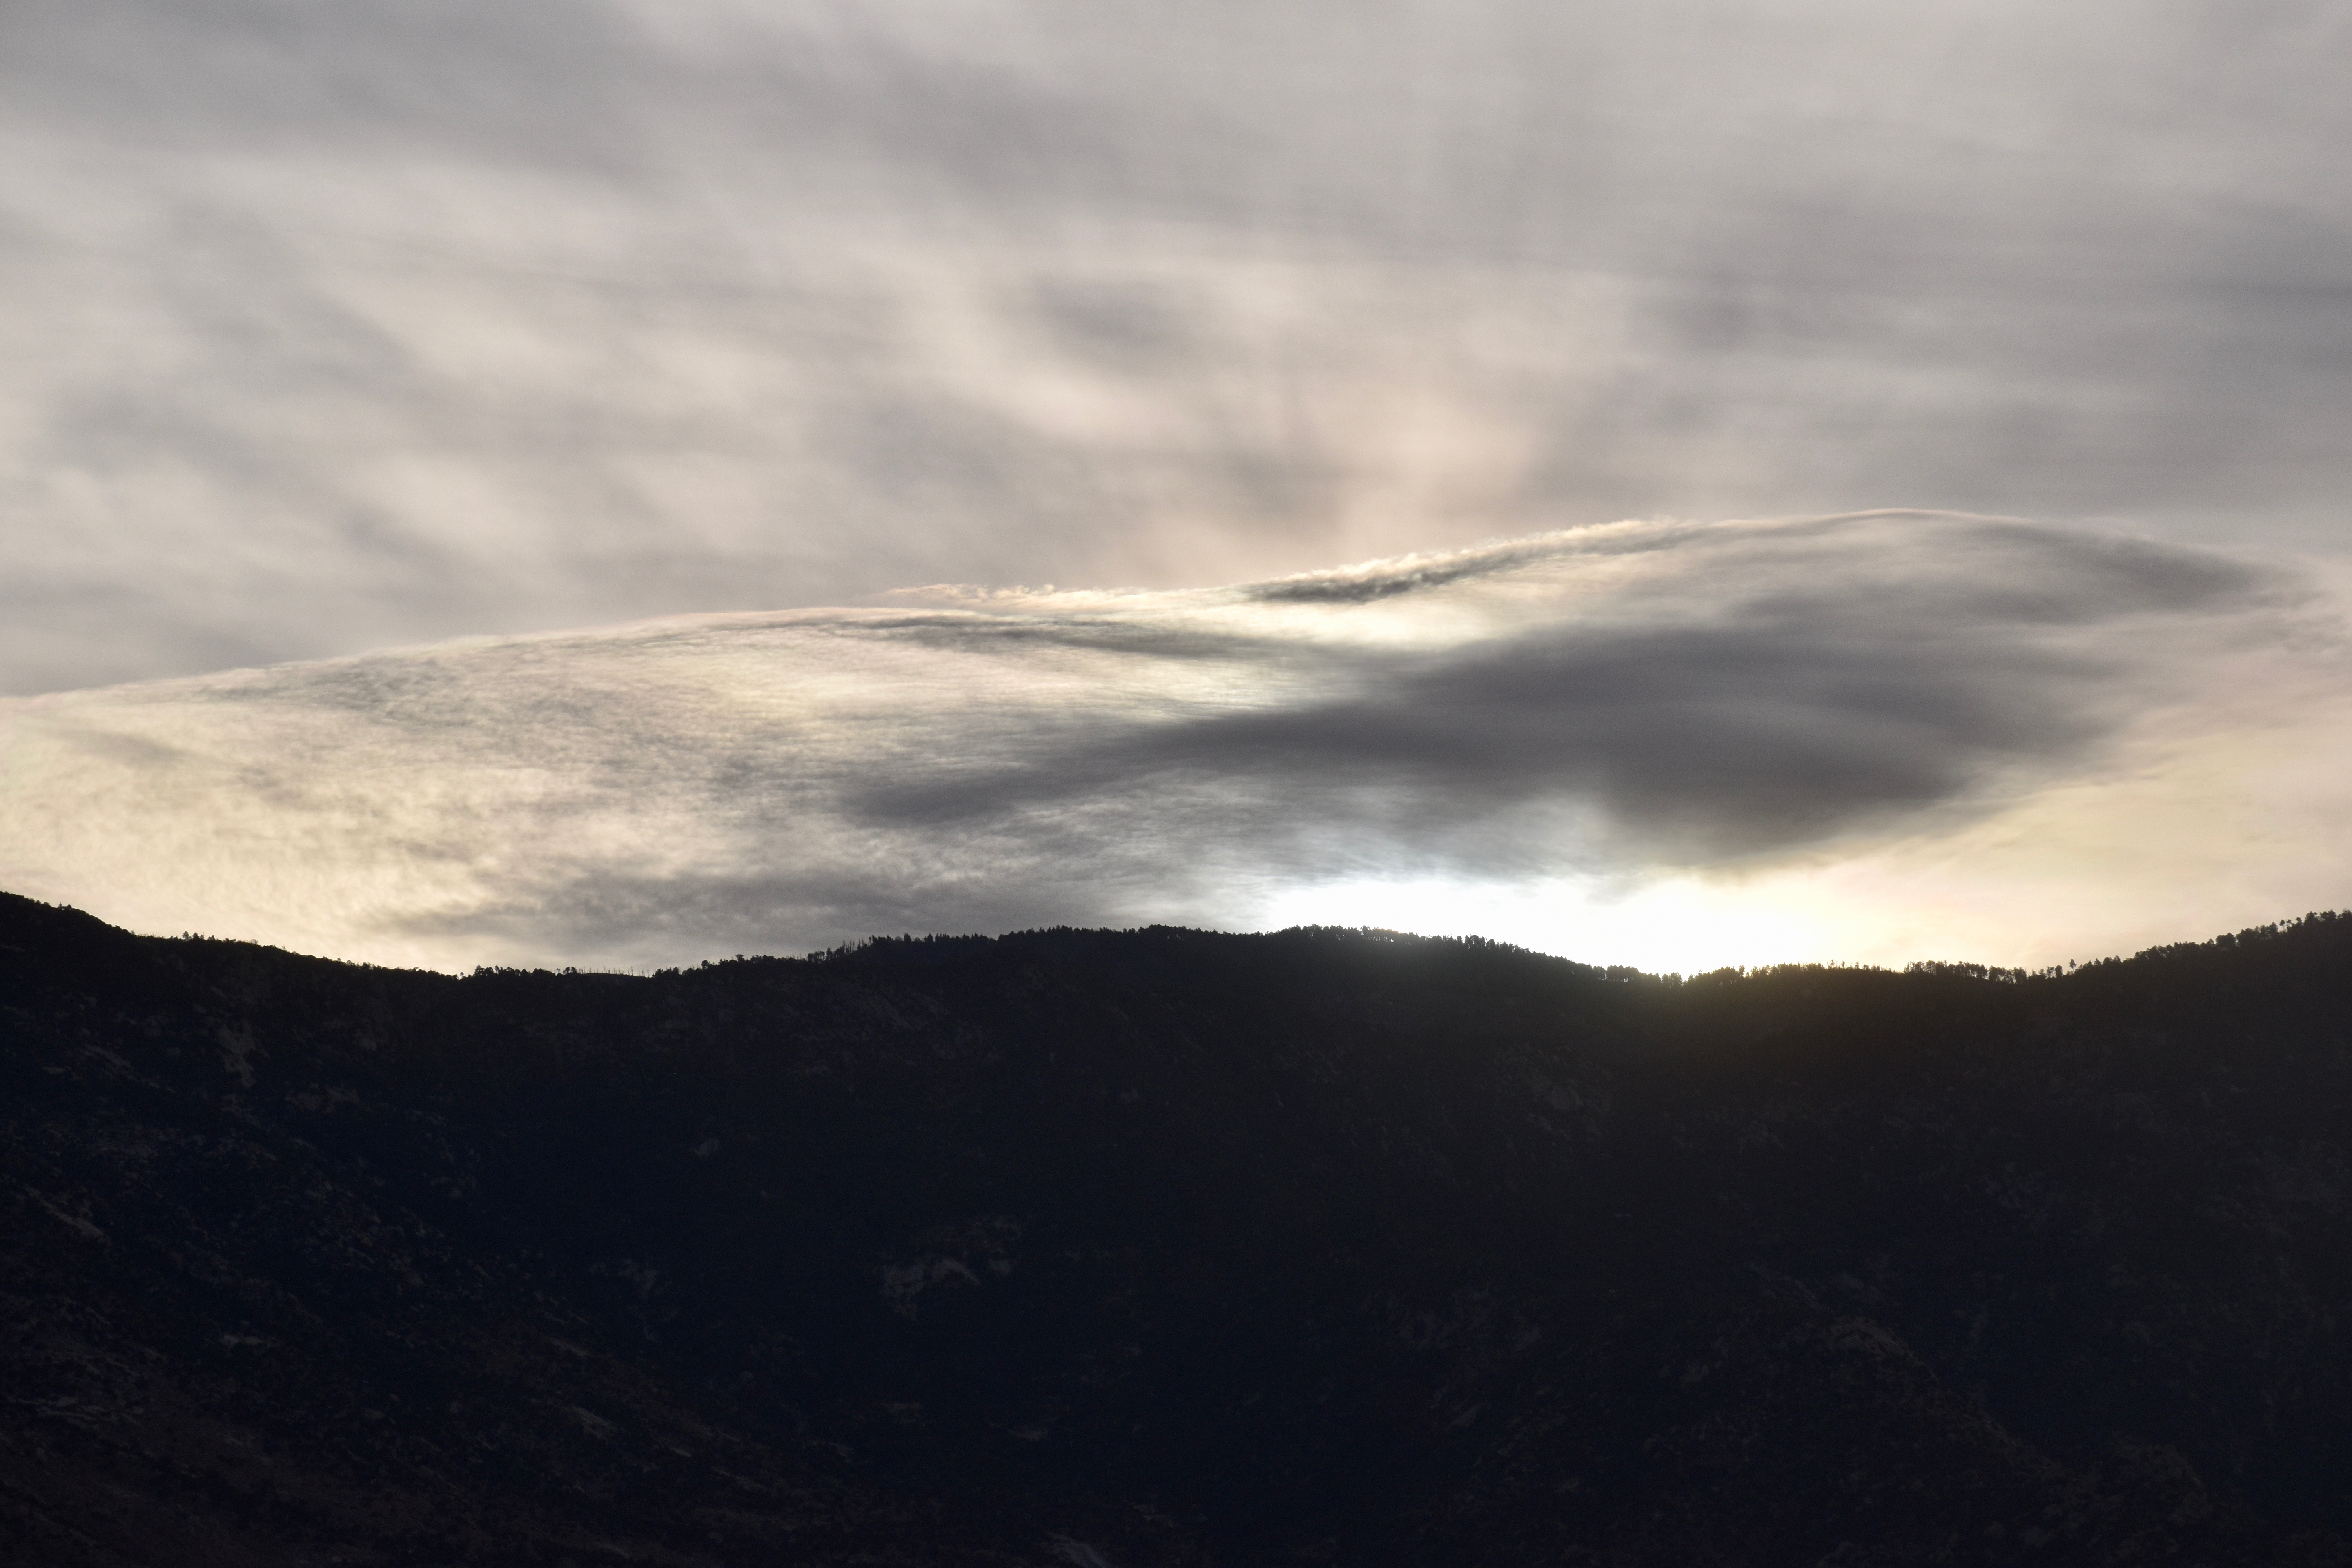
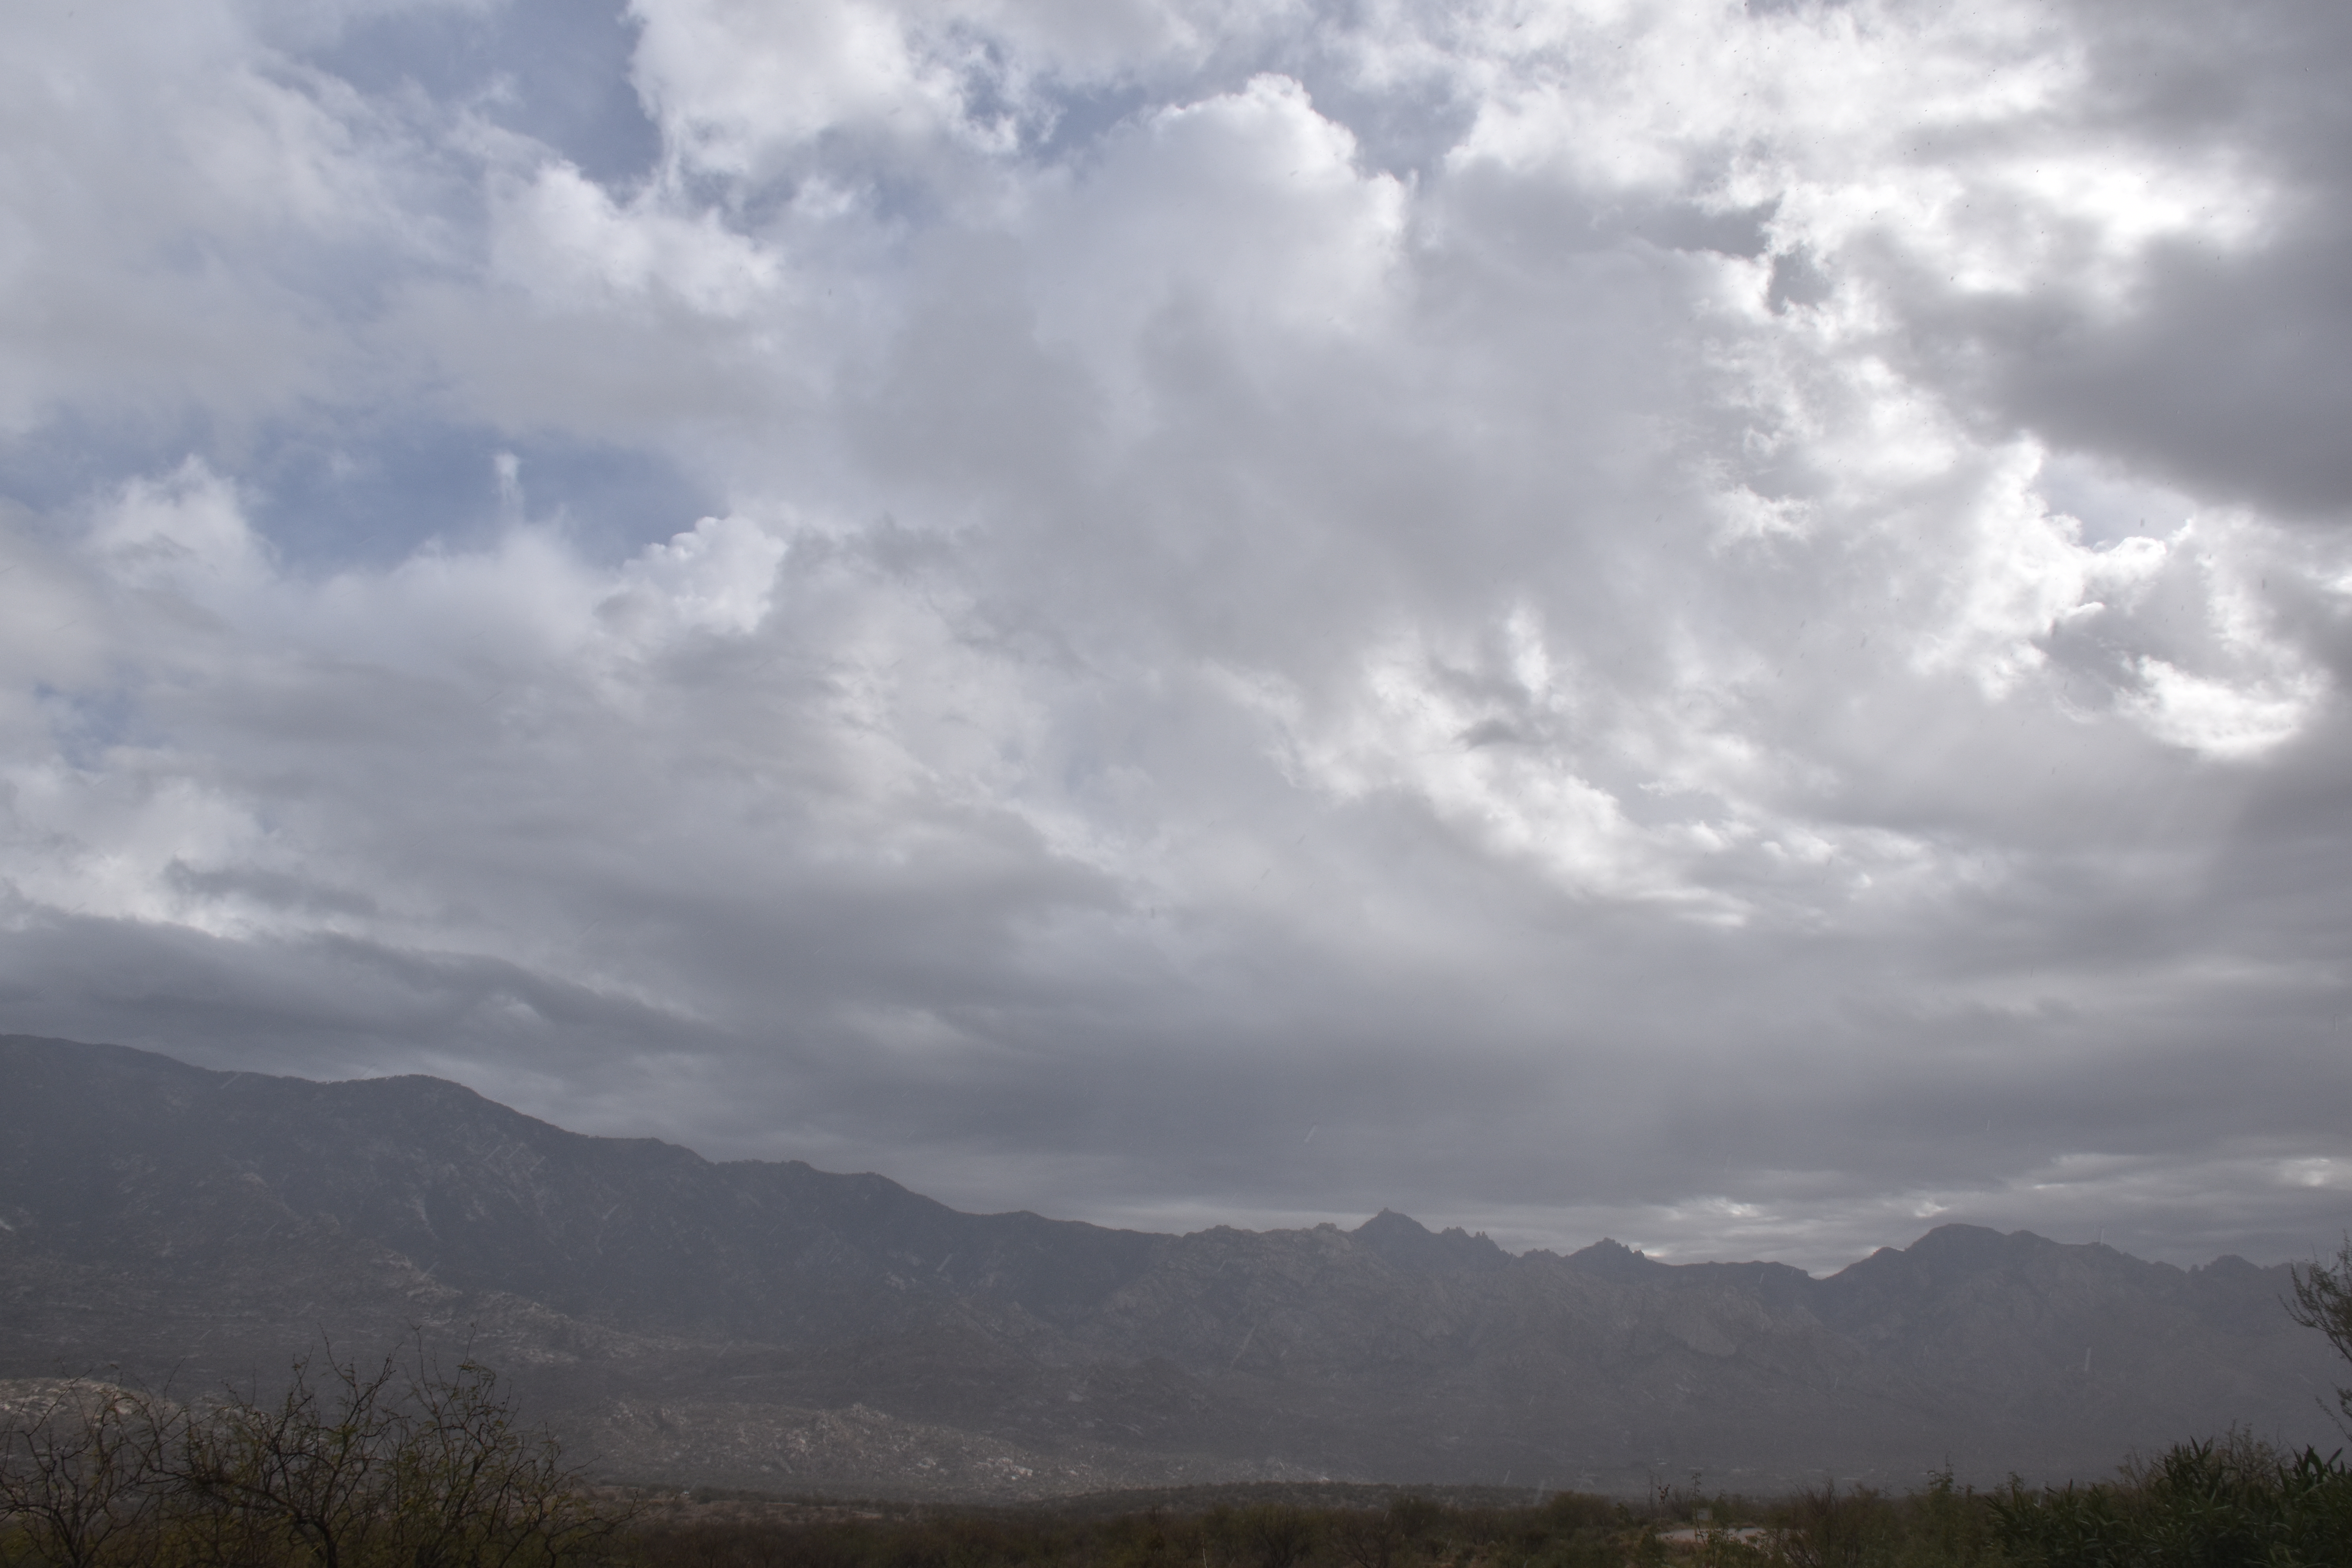
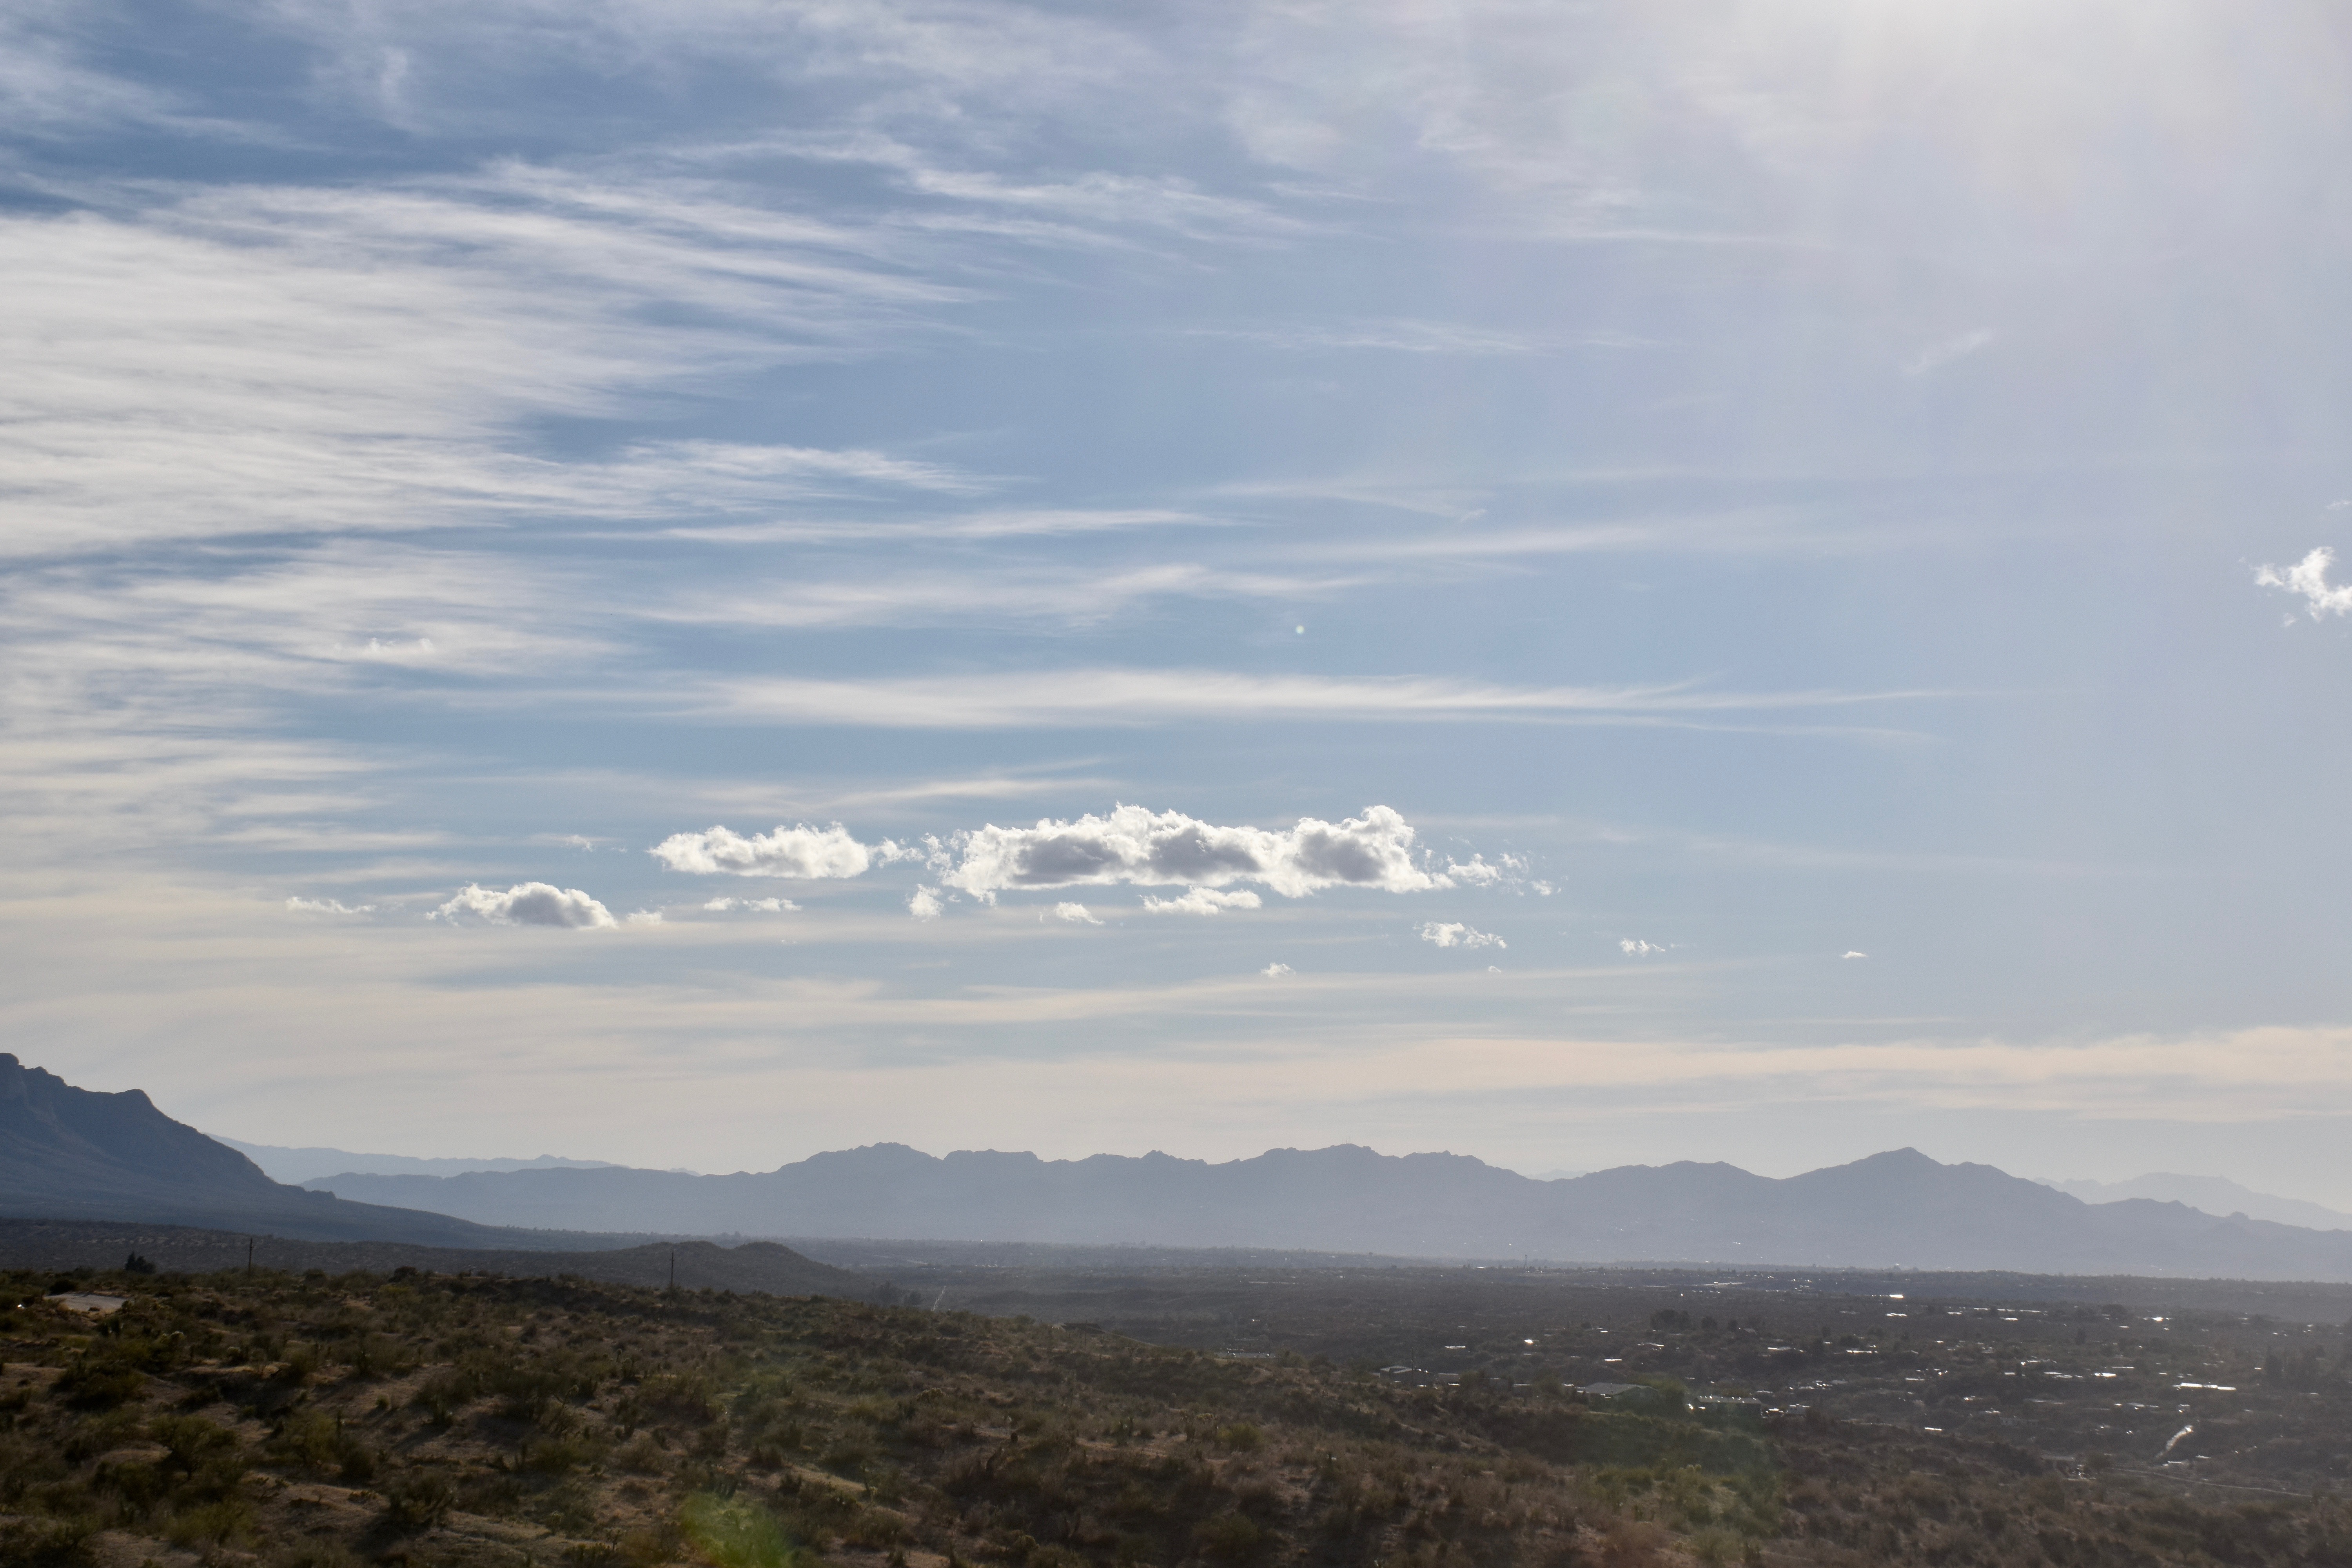
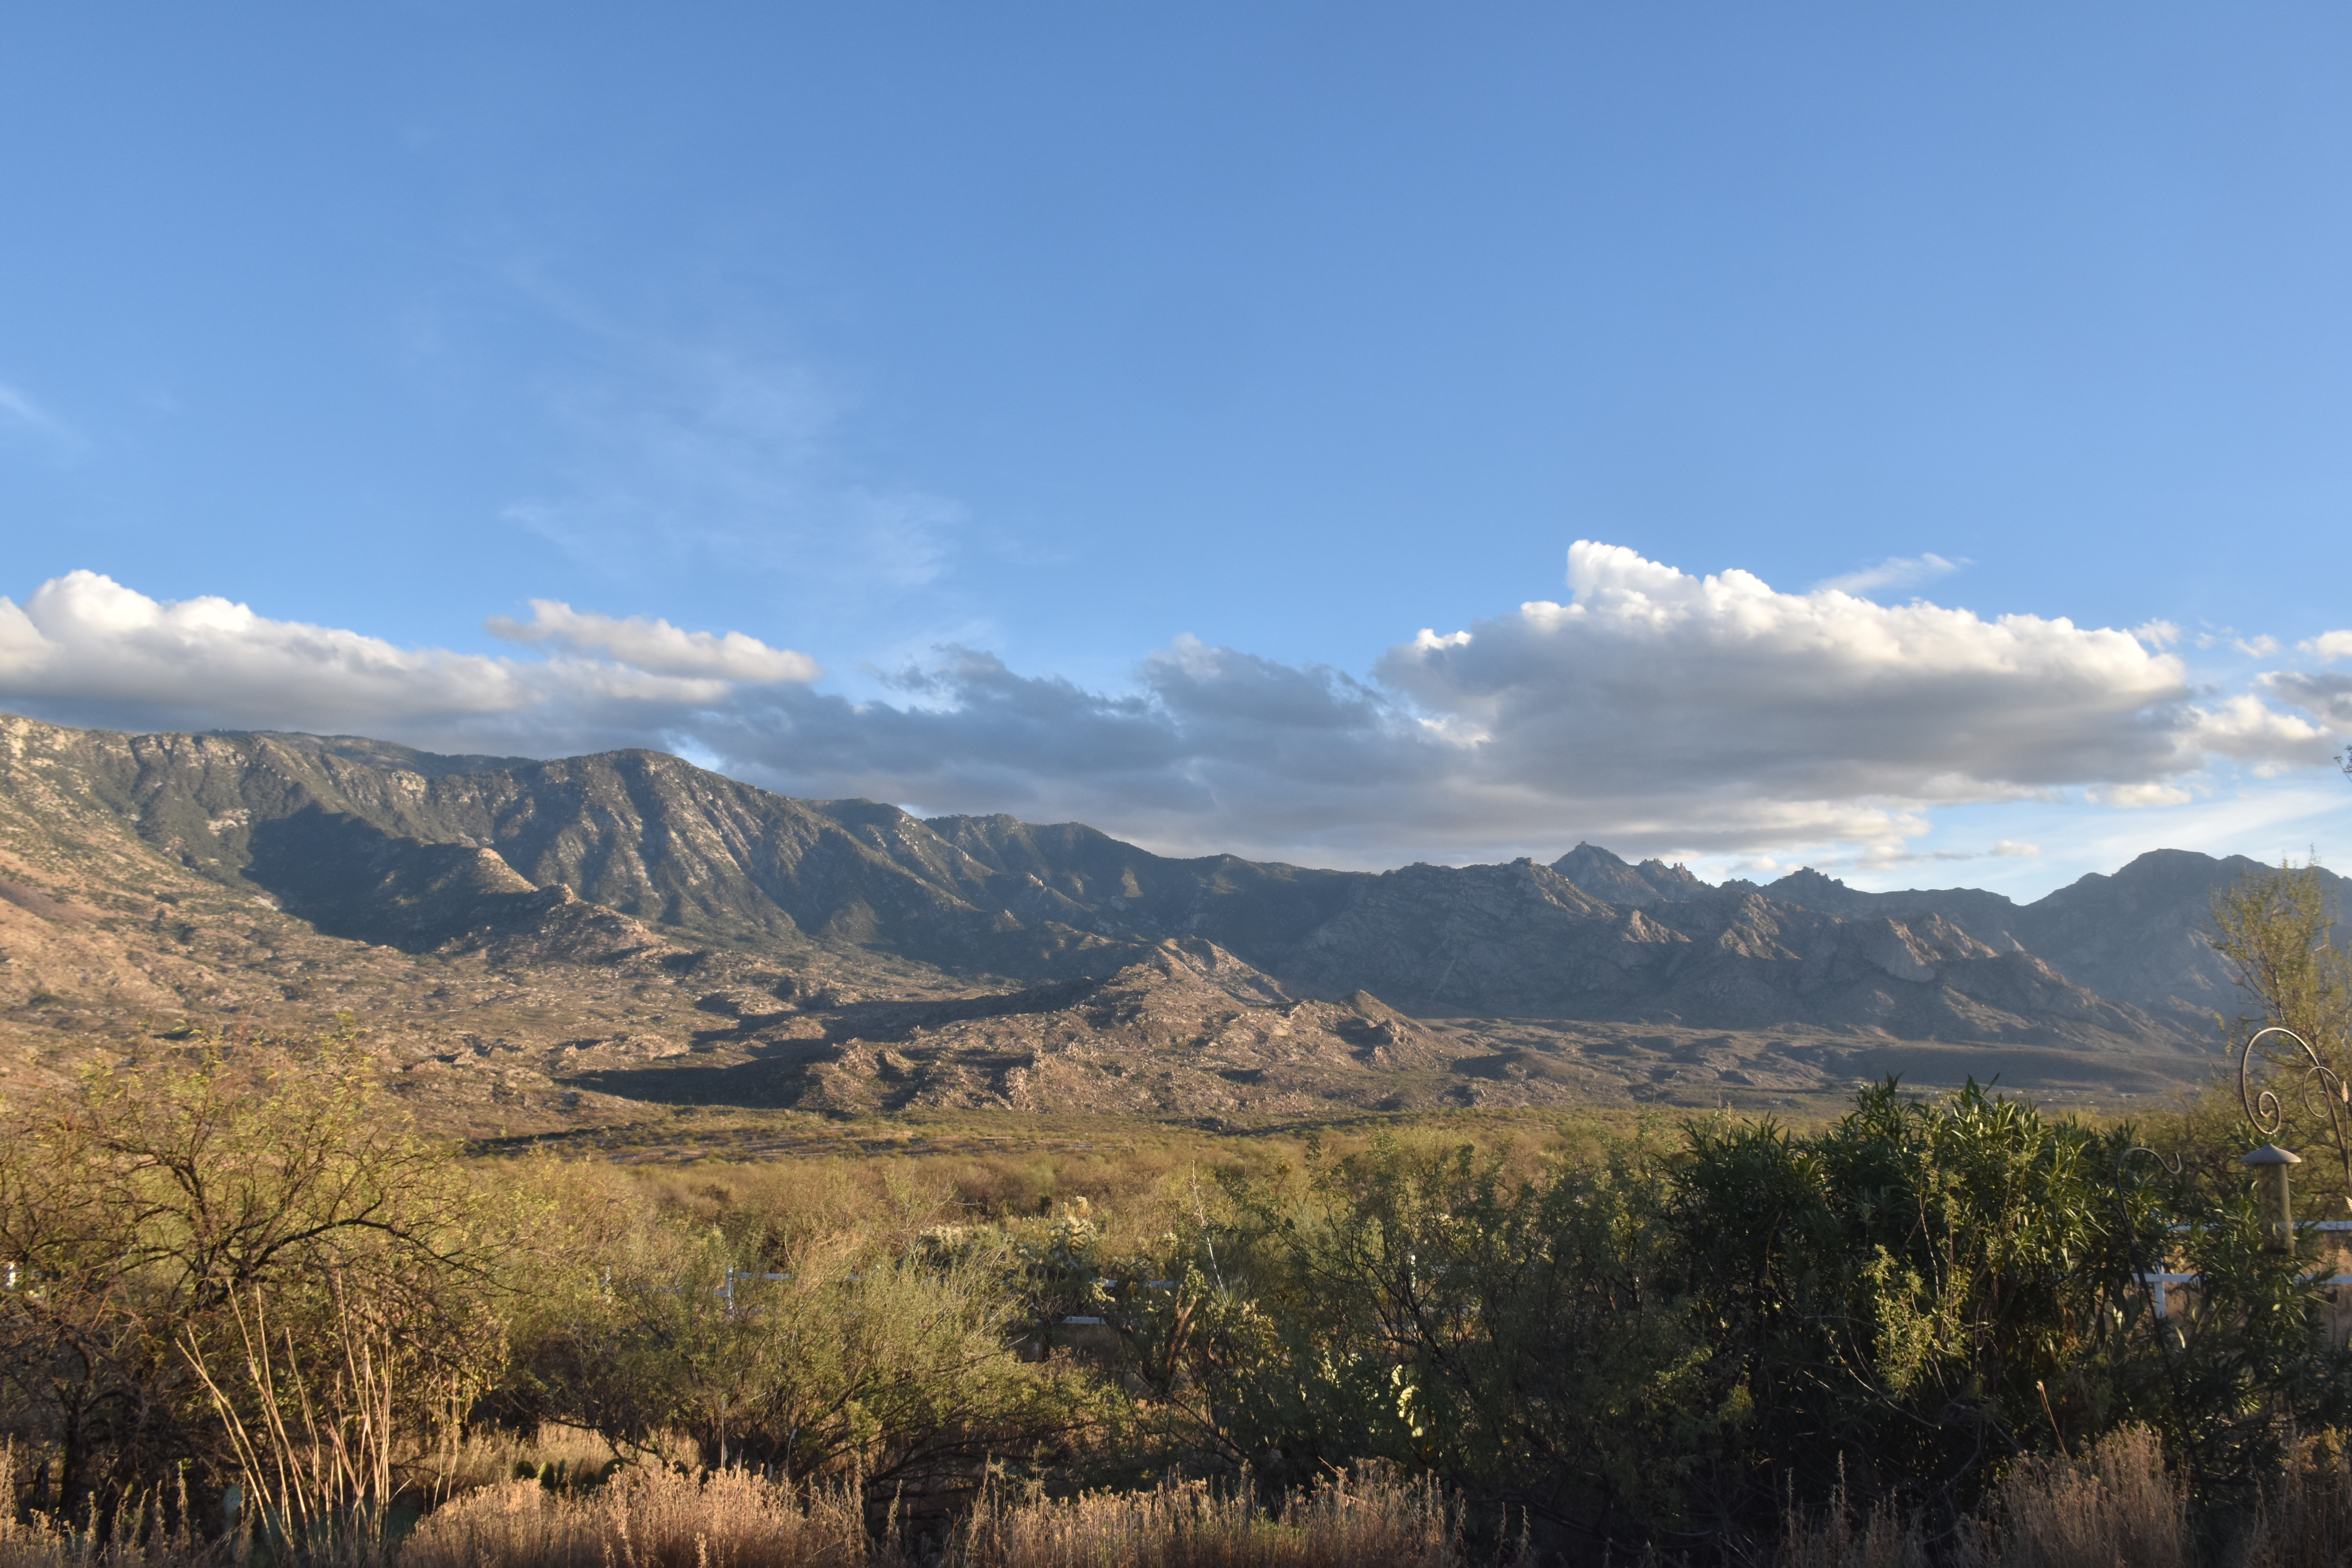
12:27 PM. As the Stratocumulus broke up, you got a glimpse of the deeper clouds north of Oracle that had been, and likely were still raining. Estimating depth here at about 2 km, or 6600 feet. With bases at 4,000 feet above ground, that would put the tops at only around 11,000 feet, too warm for ice since it would barely be below freezing at that height. Will check now to see if that statement is true. Actually, the soundings from the U of AZ make it a little more ambiguous than what I was thinking about too warm for ice formation, and so there’s no point in showing those soundings where people might question what you just said.1:19 PM. So pretty. I am a lucky man to see scenes like this so often.1:29 PM. A cloud street with this fat boy formed off the Tortolita Mountains and it passed overhead of Catalina! I wondered if some big drops might fall out since it would be a Cumulus congestus if you could see it from the side, and with “warm rain” having fallen earlier, there was still a chance that the drops in this guy, toward the tops, would reach sizes where they coalesced into drops.1:29 PM. Nice. One of our photo niches is cloud bases, and here’s one of the best. Am waiting outside for big drops, not Godot. Can’t go inside because they might only fall for a few seconds or minutes, it surely won’t be shaft. And what if no rain had fallen earlier? I might need to report a trace.1:41 PM. It wasn’t too much longer the drops began to fall, finally thinking to get a photo in case no one believed me that rain had fallen from that cloud.2:11 PM. Cumulus humilis and Cu fractus are all that remain of the gray skies of morning.3:59 PM. Just enjoy.6:37 PM. The sun, completing its weary journey around the earth, finally goes down.
The End
PS: The agonizing delay from typing then seeing words appear 5-10 s after you stopped typing, disappeared when I jettisoned Firefox for Safari. So, all these months of agony, were due to a Firefox bug, not a WordPress or GoDaddy hosting service problem. Unbelievable. This problem I think began when I downloaded the latest version of Firefox, which also came loaded with pop up ads and web site diversions it previously was free of. Dummy me never connected it to the venerable Firefox web browser. So, Firefox has been trashed from this computer!
Have cameras ready for interesting clouds today as yet more storms approach. Winds at 500 mb (around 18,000 feet above sea level) are forecast to approach 100 kts by tonight (oops, TOMORROW NIGHT! Egad). With winds like that, likely will be some nice lenticulars around to add to your collection. Oh, I already see one downstream of the Catalinas….
Maybe some photos later if the upload problem can be resolved.
Its not resolved…. But, trying to look at the bright side, while this ONE photo was uploading, I got some more coffee, read a book (Cadillac Desert, Marc Reisner, and got a good start on, Mythical Rivers by Melissa Sevigny–both highly recommended for cloud maven readers.
6:27 PM AST last evening, though after the brutally slow uploading speed to WP, maybe its not the same day as I started this upload anymore….
Some more on the upcoming rain and wind event in the next 24-36 h:
From this keyboard, 10% chance of less than a trace (pitiful forecast), in other words, a zero from this storm, and 10% chance of more than 0.40 inches. The average of those two, which helps center a forecast in the forecaster’s mind, great or small, would be, say, 0.21 inches.
But the wind max during this storm event will be the most “interesting” part of it: 10% chance of puffs less than 35 mph, 10% chance of more than 65 mph , in this forecaster’s opinion. The average of those would lead me to think that very momentary gusts will reach 50 mph (averaging those extremes to center a forecast). So, the wind in the next 24-36 h is really the most interesting thing to keep an eye on; stuff will blow around, shingle fragments likely to come off. This is NOT a NWS forecast.
The End
——————— 1“Puffs”: almost instantaneous blasts of a few seconds.
They seem to go together every time we have Altocumulus clouds; aircraft flying through them create holes or canals! Have been photographing this phenomenon since the early 1980s, and I have not seen it so consistently occur every time there was a flake of Altocumulus around as has been the case here this winter! Its likely because our Altocumulus clouds have mostly been so cold, having temperatures lower than -15° C. Mid-level Altocumulus clouds can range in temperature from well-above freezing to below -30° C.
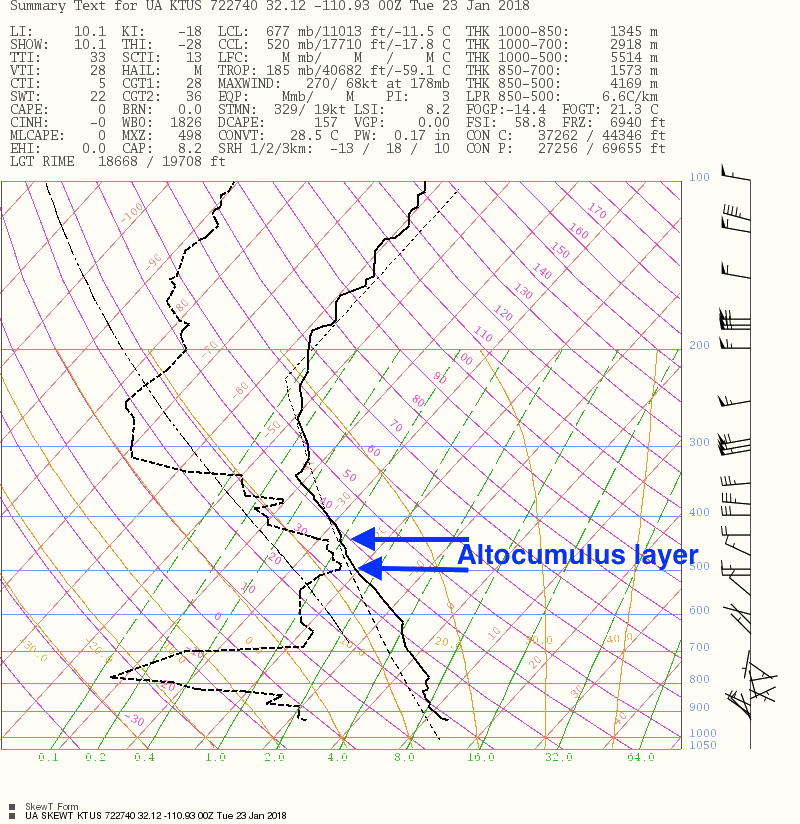
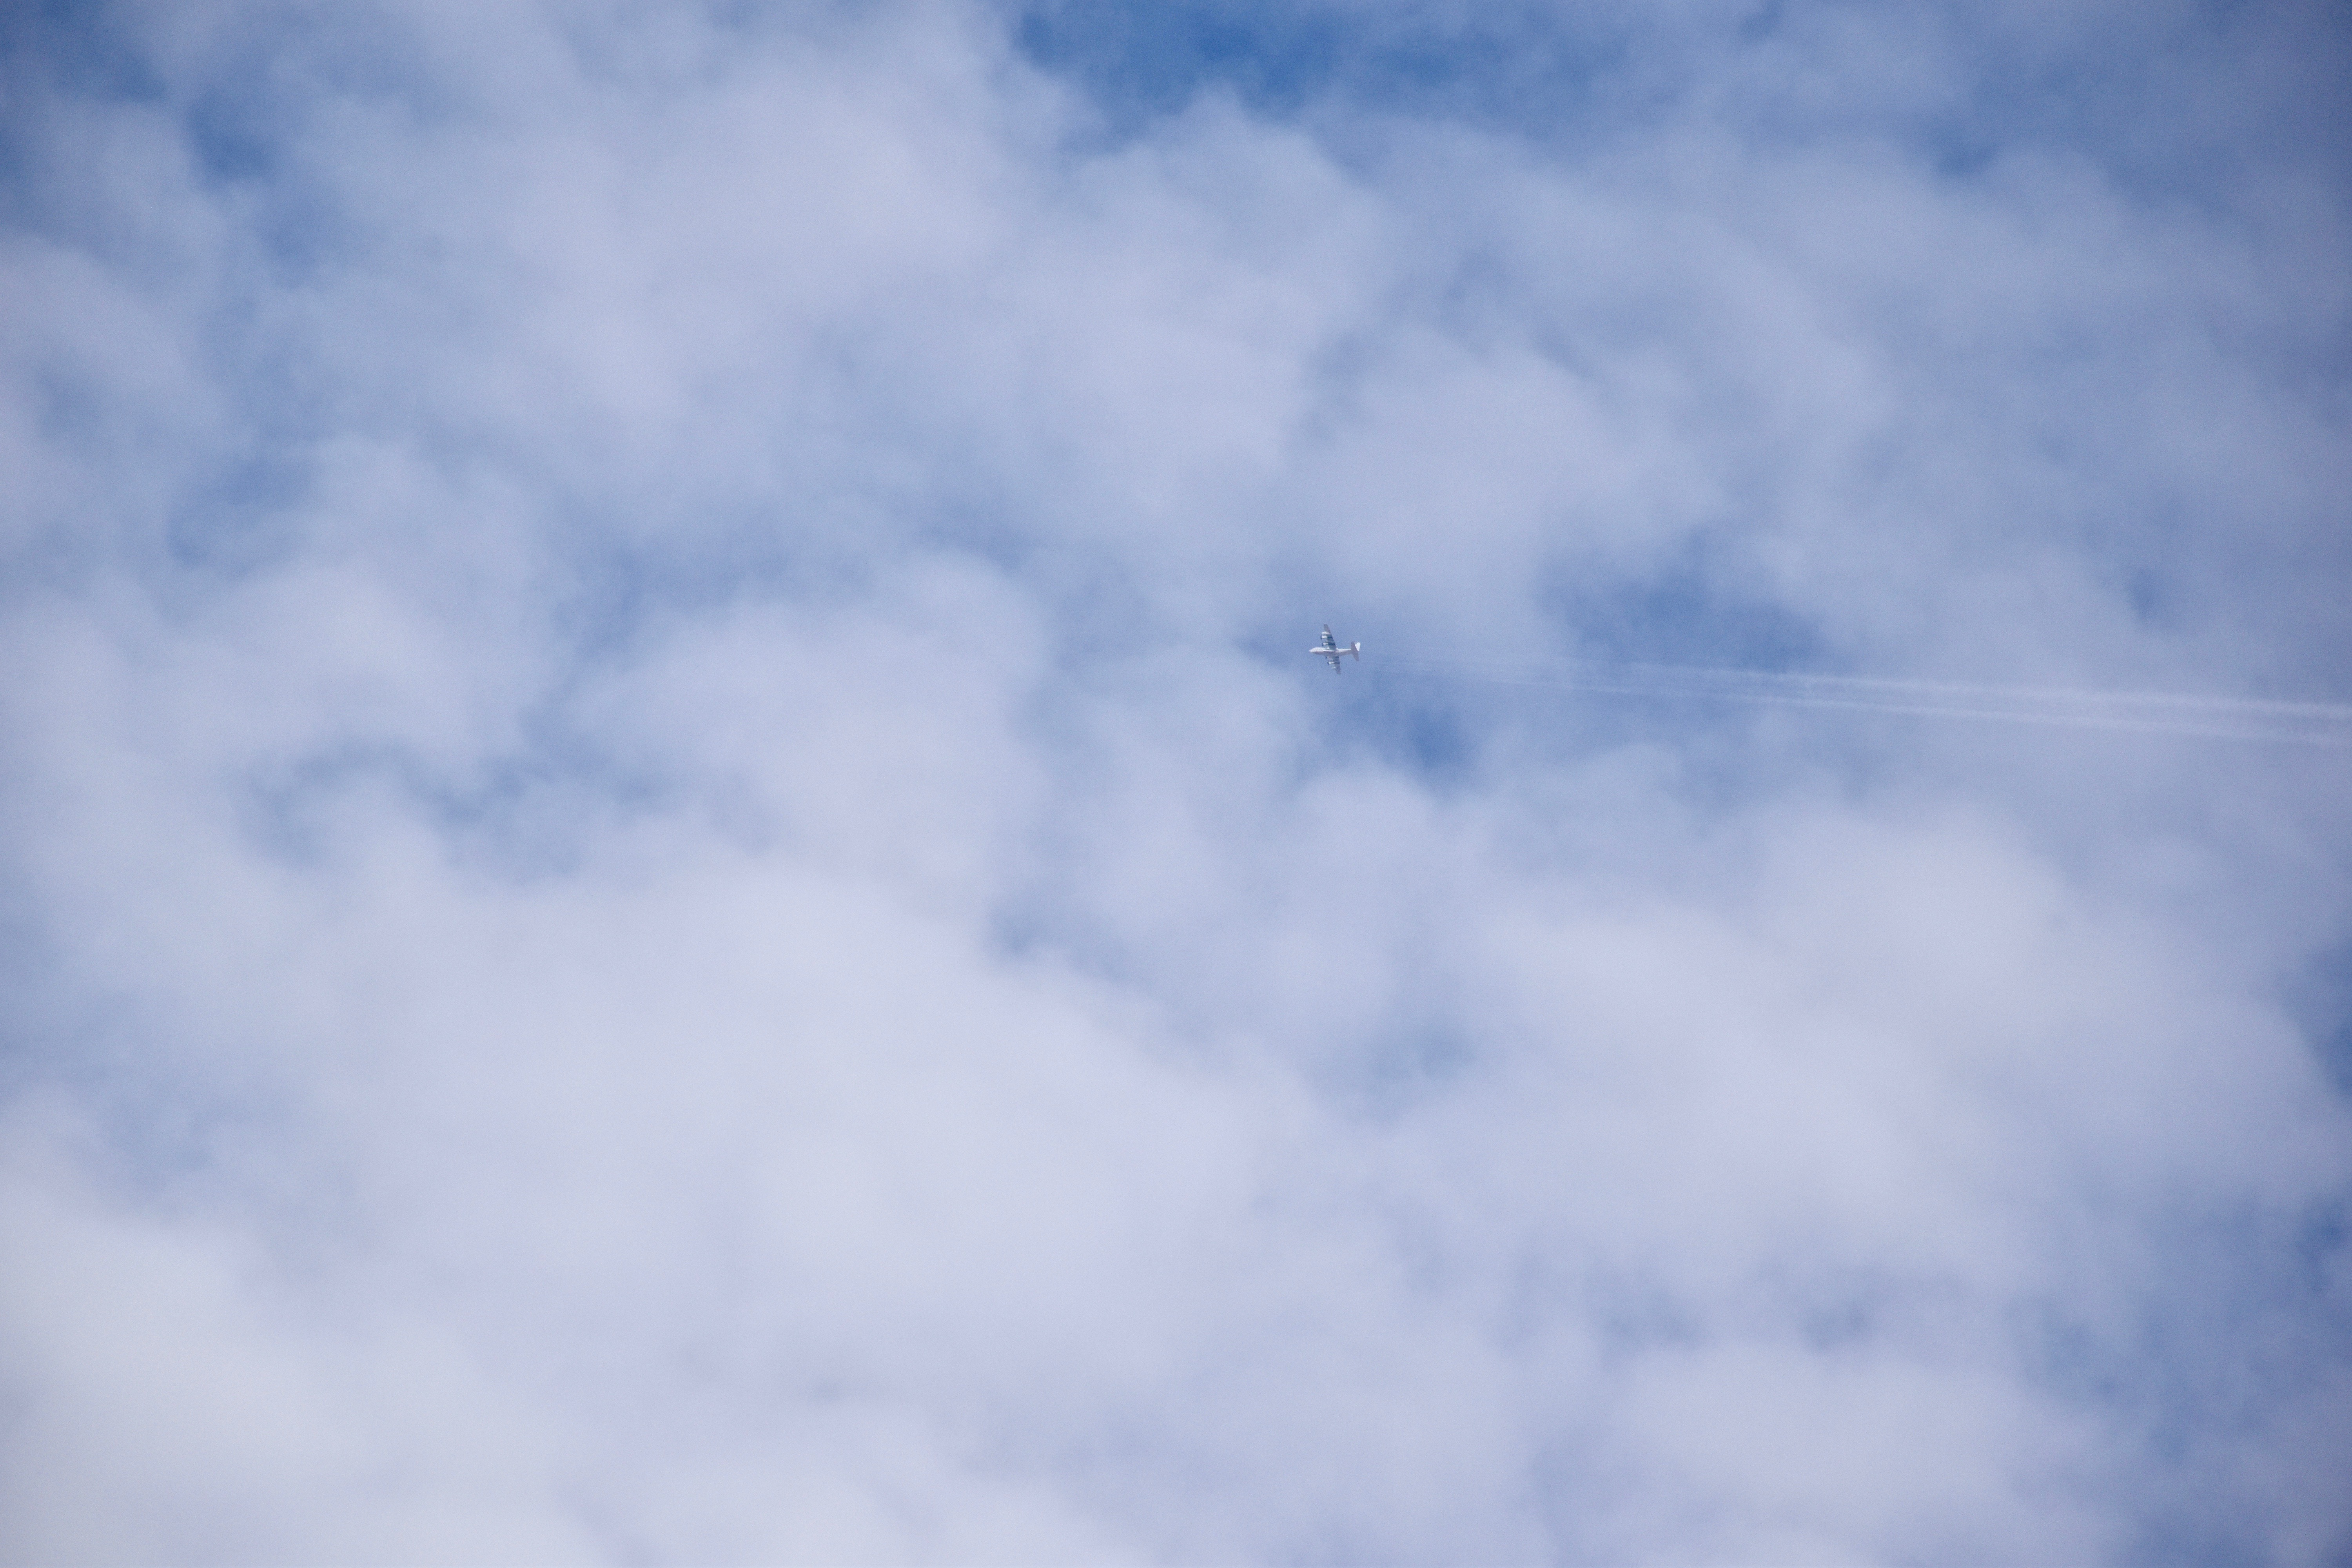
What was unusual about yesterday afternoon, if you caught it, was that you could make out the aircraft producing the “high temperature contrail” (aka, APIPs), a four engine prop aircraft flying just under the bottom of the Altocumulus layer. Even if you see a contrail in the Altocu, you can almost never make out the aircraft type for sure because its too high or in the clouds. But, because of our cool spell, those cold Altocumulus clouds were lower than usual, around 15,000 feet off the ground, or near the 500 millibar pressure level. The temperature at the bottom of this layer was -21° C. See annotated NWS sounding, courtesy of IPS Meteostar, below:
The National Weather Service sounding launched from the U of AZ about 3:30 PM, near the time that the “high temperature” contrail was being produced. A slight amount of Altocumulus was over and downwind of the launch site.
Here’s your aircraft shot, full size so’s you can really zoom in and see those engines:
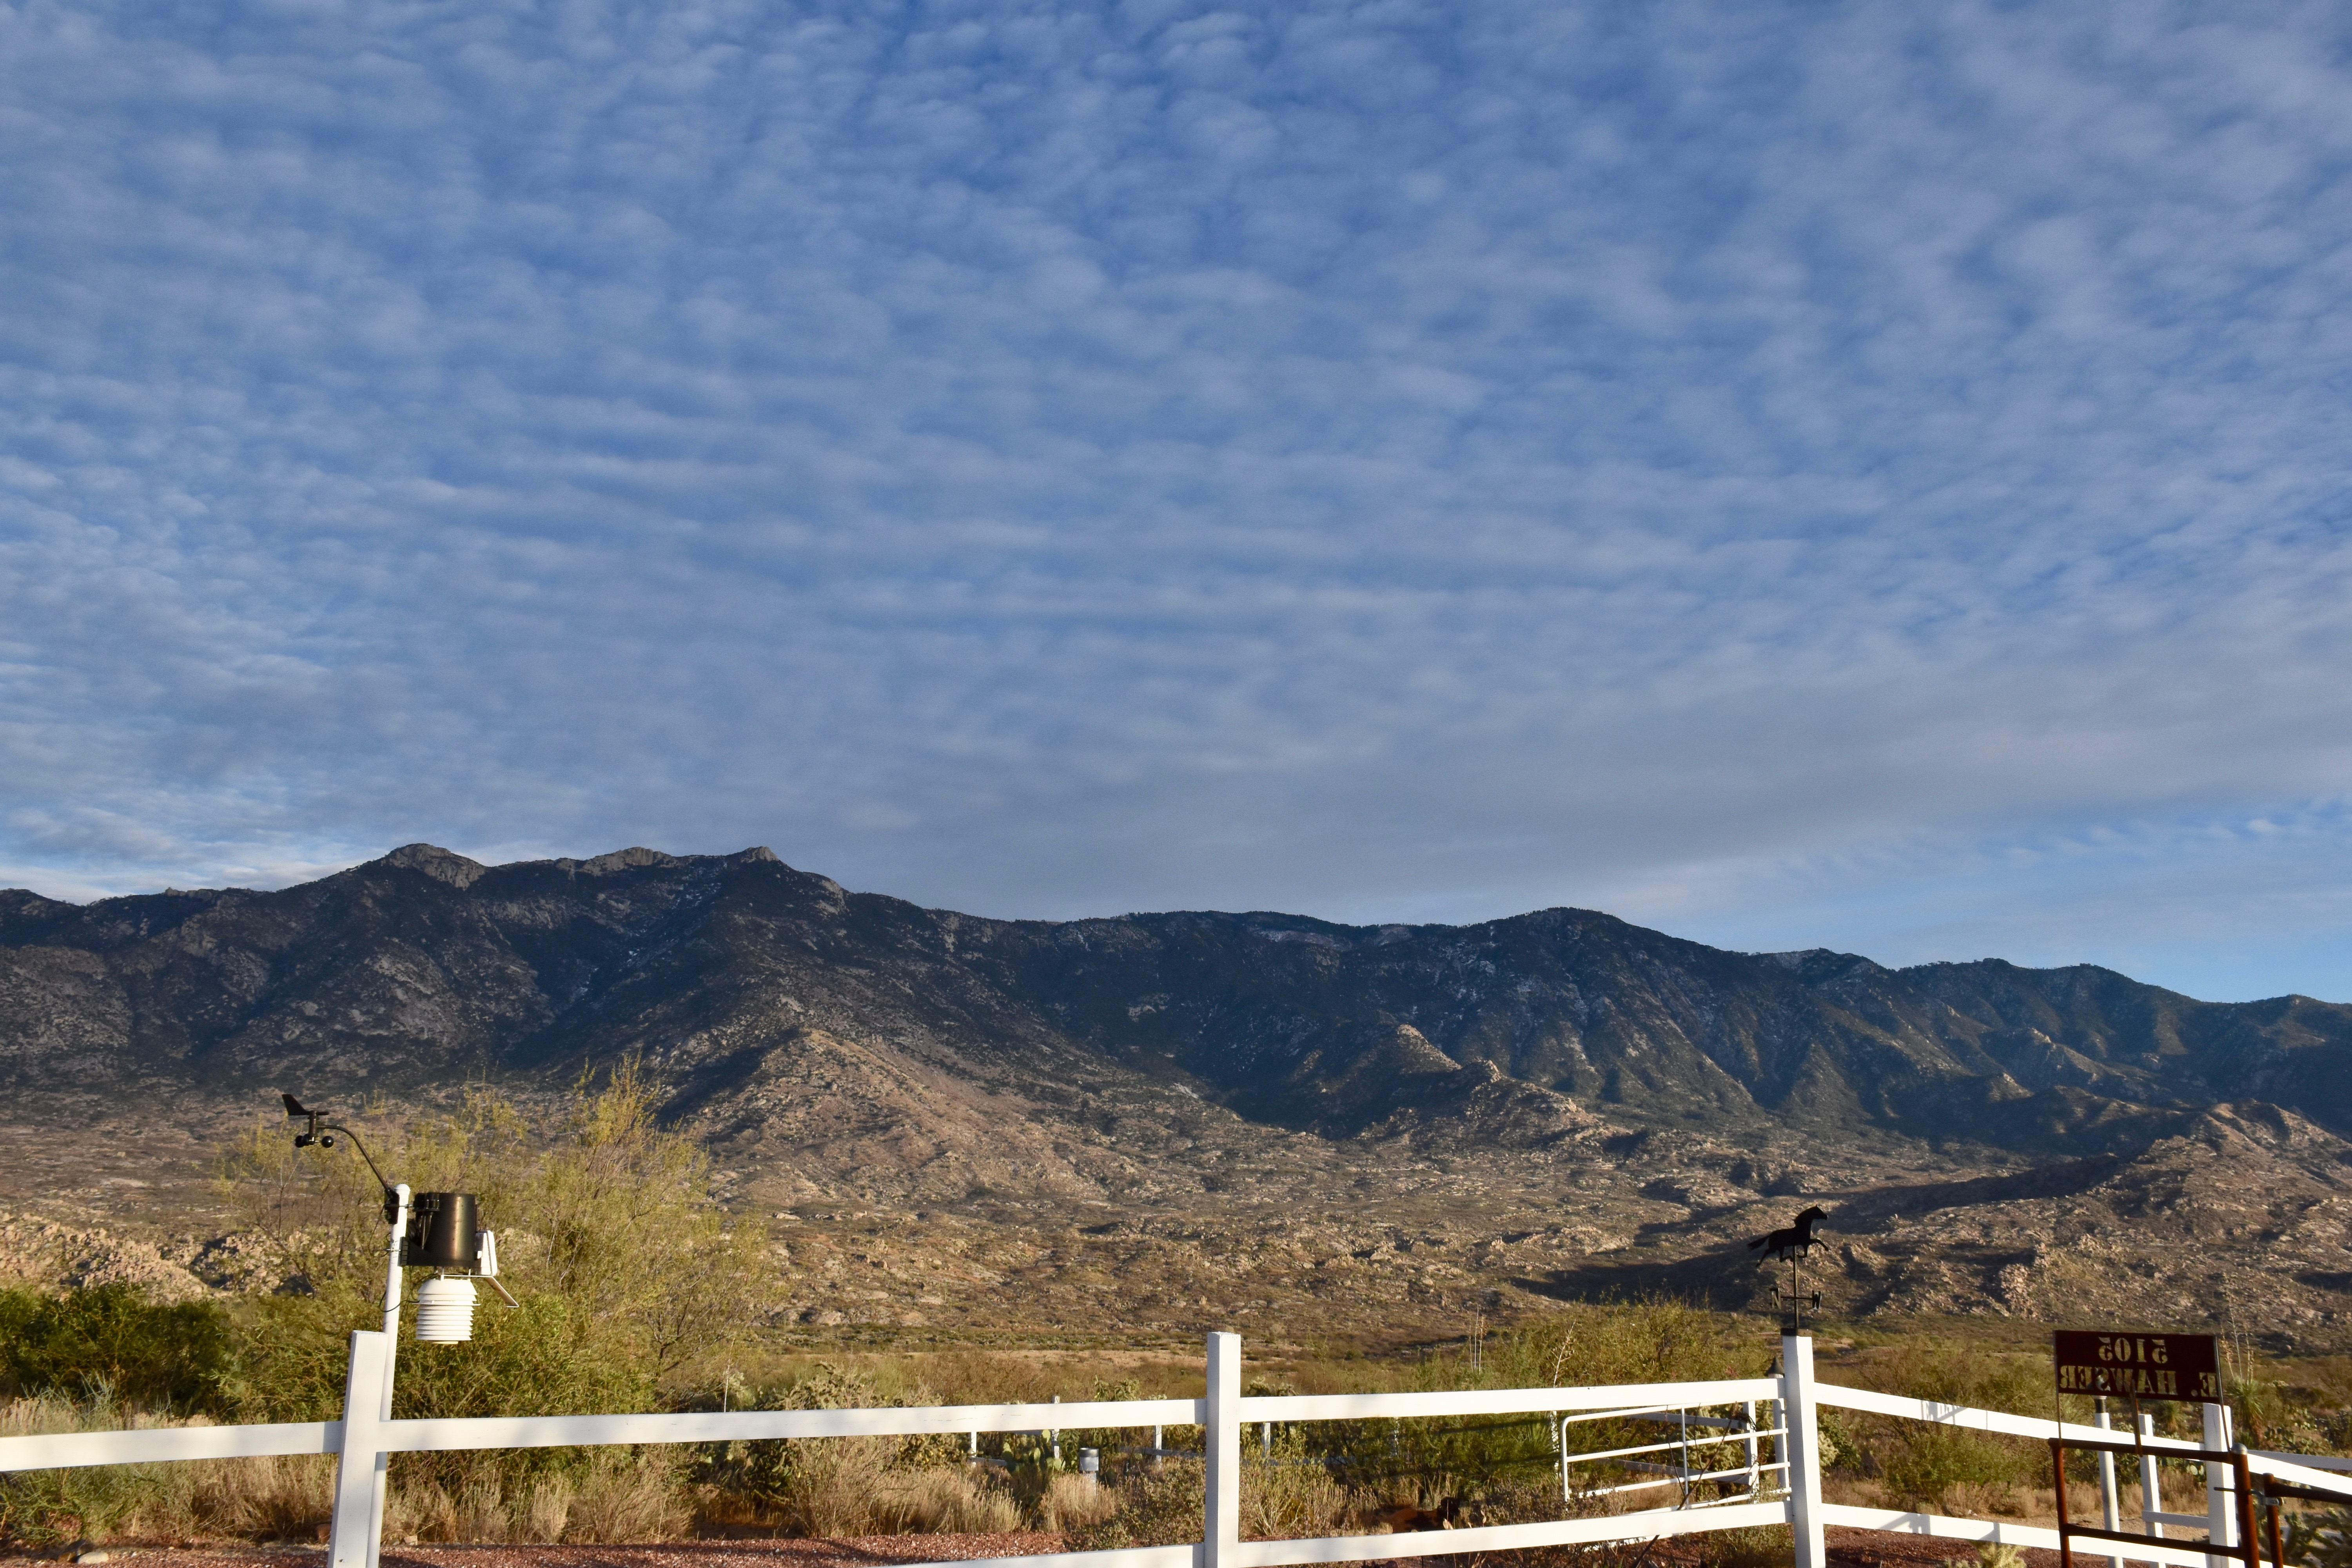
3:37 PM. A four prop engine aircraft flies just below (maybe 100-300 feet is all) the base of the Altocumulus layer and left a LONG contrail.3:37 PM. The long contrail behind that plane. Note that it goes into clear air; cloud droplets not required. Looks exactly like a normal contrail, those produced by jets at temperatures lower than -35°C when the air is moist.3:44 PM. That contrail now extended from horizon to horizon. it appeared that he climbed through this layer on the way out. The broadening with visual evidence of ice is in the upper right hand corner.4:16 PM. Now the classic ice canal is obvious in our Altocumulus layer. More aircraft produced ice is present as well.4:16 PM. Zooming in on a segment of this canal shows that while its completely ice, there are no virga trails showing. Am guessing that those prop engines produced prodigious numbers of ice crystals via prop tip cooling to below -40°C, where homogenous nucleation of ice occurs (producing prodigious concentrations of ice crystals, maybe tens of thousands per liter in the immediate lee of the prop tip). Here the crystals have spread out due to turbulence, but there are just too many competeing for the available vapor to produce crystals big enough to have much of a fall speed.5:12 PM. Due to the low windspeed at cloud level, just 15 knots or so, this ice canal was visible for more than an hour and a half. It was remarkable how close to natural Cirrus looked at that time. It would be almost impossible to assign this ice to the level of the Altocumulus. Check the close up, next.5:12 PM. Cirrus uncinus homogenitus (I’m not kidding. that would be the name for this Cirrus, having been produced by man (well, or a woman pilot, of course).5:13 PM. Unperturbed Altocumulus perlucidus translucidus (the latter, little or no shading due to thinness of elements).5:14 PM. Shadow drama on the Catalina Mountains from those Altocumulus clouds, made even more interesting by the presence of a weather station in the photo.
S
5:58 PM. The setting sun illuminates that last bit of the aircraft-produced ice canal (“homoCirrus” on the right). This was probably the longest viewing time for any such event over one location, again due to the light winds up there.
The weather ahead, WAY ahead
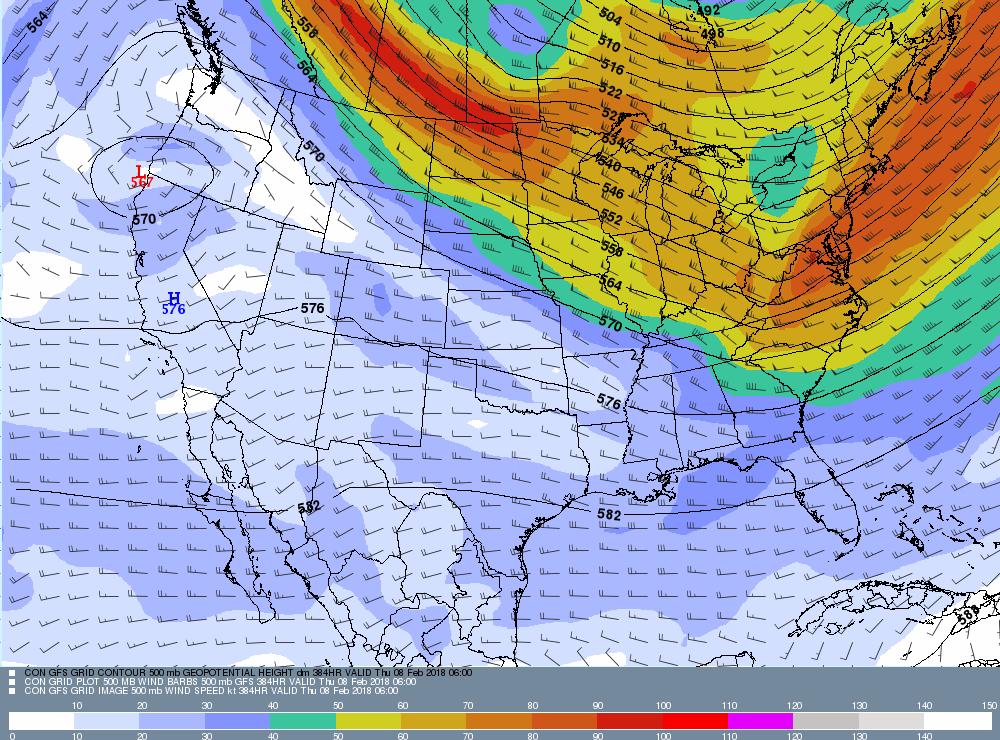
Not a single model run since two days ago has produced a big trough in the SW US, in complete opposition to the interpretation of spaghetti ensemble output at that time. This would be, IMO, one the greatest busts of all time (not for me, of course), but for spaghetti ensembles (I was only foretelling what they told me), spaghetti considered to be one of the great forecasting advances of all time when computers became powerful enough to produce them in a timely manner.
If we believe these later model runs, it will be relatively hot and dry here, not cold and wet, as was suggested here.
But being of a stubborn nature, Cloud Maven Person is not yo-yo-ing on his forecast just yet. Surprises are almost certain in these model runs, since spaghetti still supports troughing beyond 10-12 days… Standing by for model yo-yo-ing….
A laugher (???) below from our very latest computer run (from IPS Meteostar again). This map in incredible in the lack of jet stream activity over most of the US!
This 500 millibar map is based on global data from 11 PM AST. last evening. Its valid for February 7th, 11 PM AST, way out there. This is a remarkably quiet map for wintertime in the US! Can it possibly be right? Hope not, at least in our area.
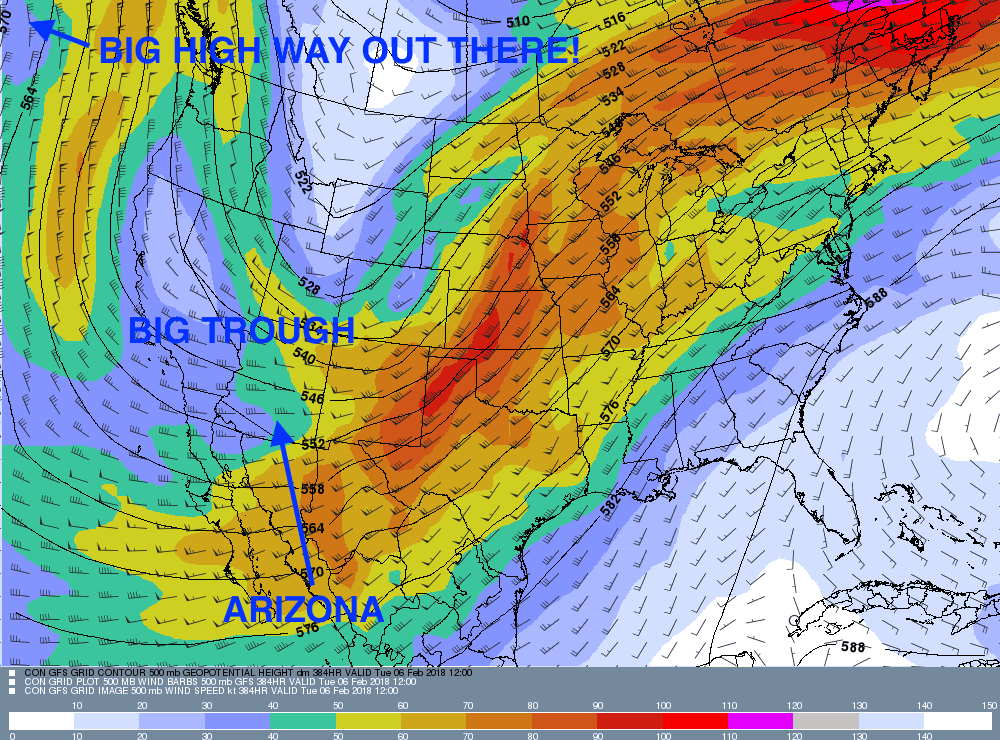
Yesterday, after I finally saw the model run based on global data from 5 AM AST for Feb 6th, CMP (the writer) was gloating that bit. The troughy, cold spaghetti for AZ, that which had been excitedly written about yesterday, was being confirmed; the interpretation right on, it seemed. Why even look at more model outputs until later January, I thought.
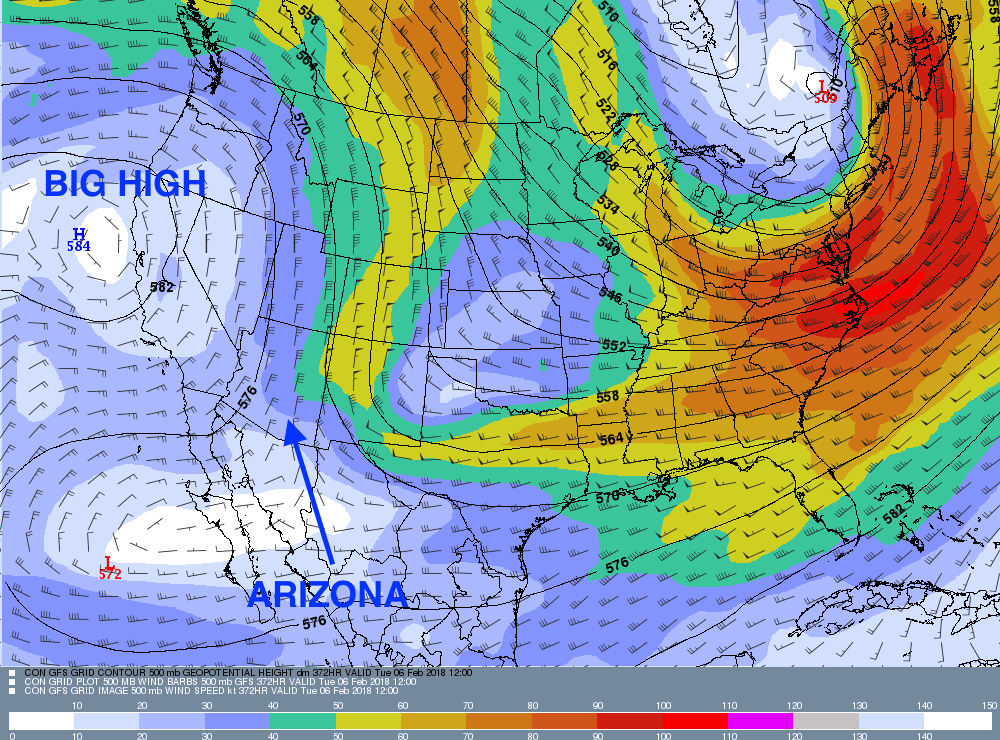
Then, just now in the pre-dawn darkness, I examined the computer outputs from last night’s 5 PM AST global data, also for Feb 6th, 5 PM AST. That is, global data crunched just 12 h later than the first panel I was gloating over, feeling really great about.
But, a completely, ghastly different weather regime had popped out!
How could this be? We don’t know. Relatively small changes would be expected, but the model outputs should gravitate back to where spaghetti placed the high and lows aloft. But this change was ridiculous, and must be rejected.
Some people, like neighbor and big professor “emeritius” of meteorology at Colo State U, Bill Cotton, refer to such differences as “delta model”. “Hence”, if that word is still used, today’s title.
(For snowbirds who have just moved to Arizona, the maps below have been annotated to show where you are relative to the rest of the US).
Yikes!
The first regime is cold, maybe some snow down in Catalina at some point about this time (early Feb), whilst the 2nd regime for the same time is suggests warm conditions, and definitely dry; no rain nowhere.
CMP (the writer) spoke of a high probability, based on ensemble spaghetti, of cold and lots of precip chances here in Catalinaland beginning at the end of January through the first week of February So, what’s up with that, this dichotomy?
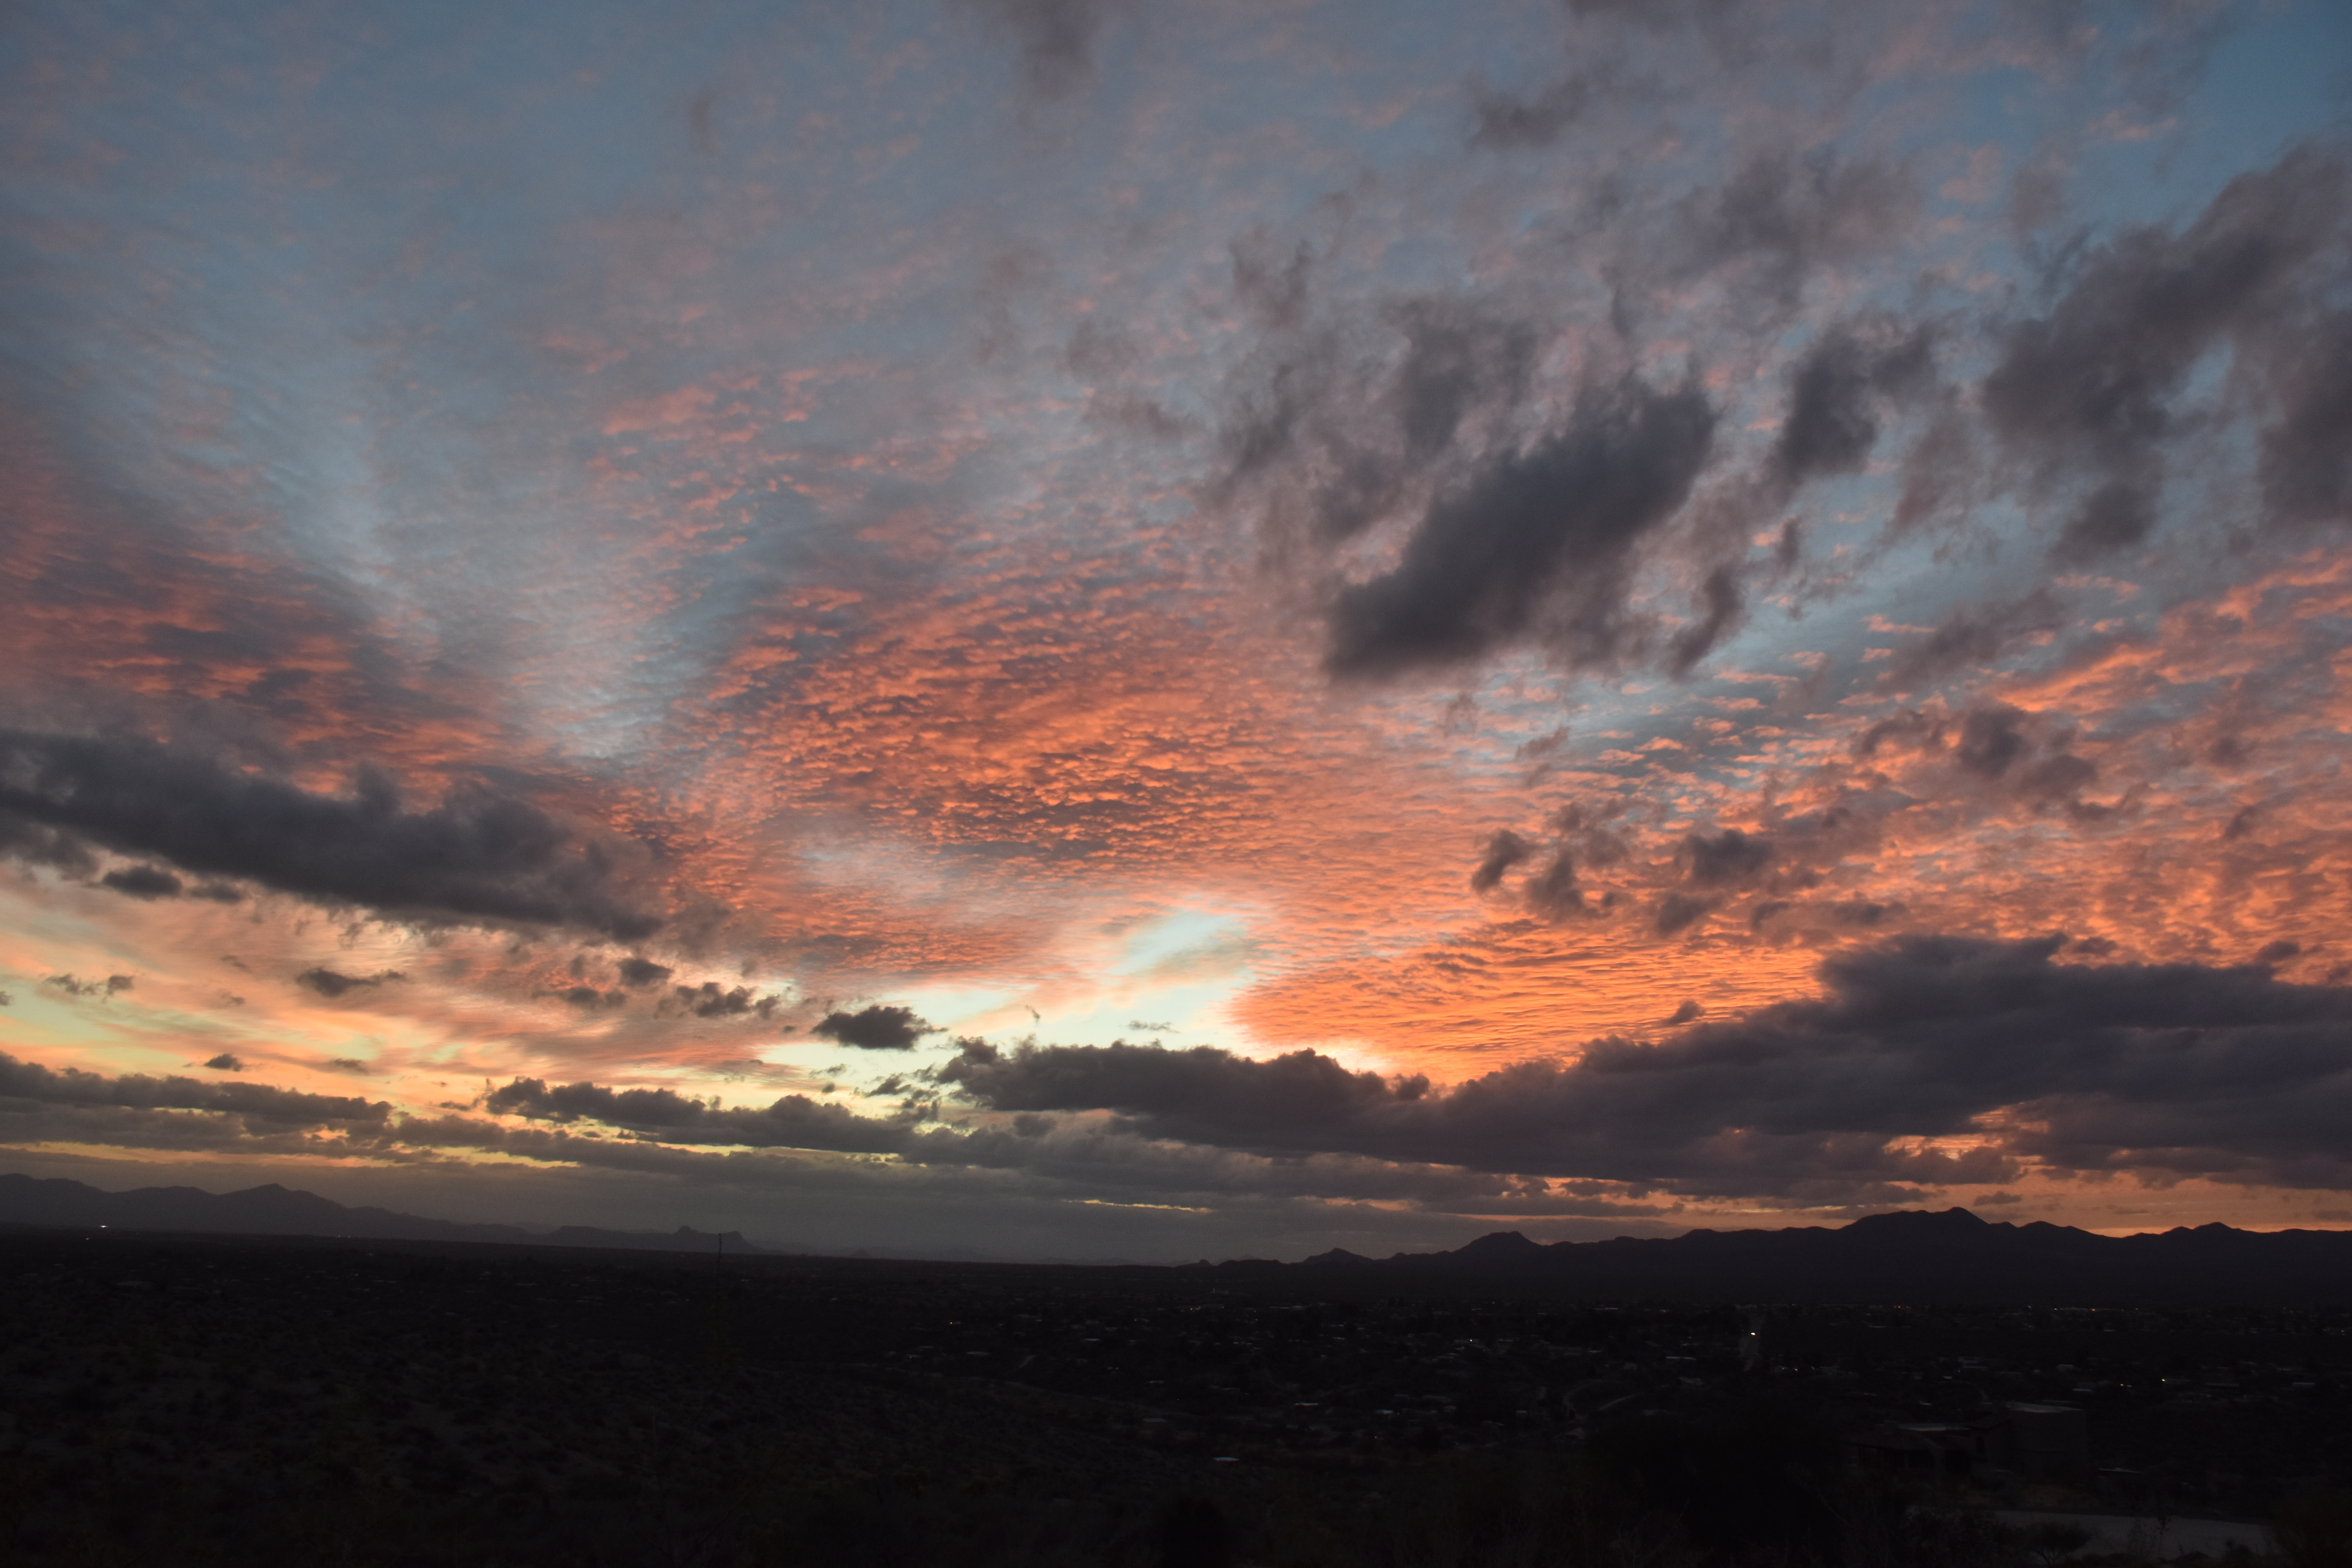
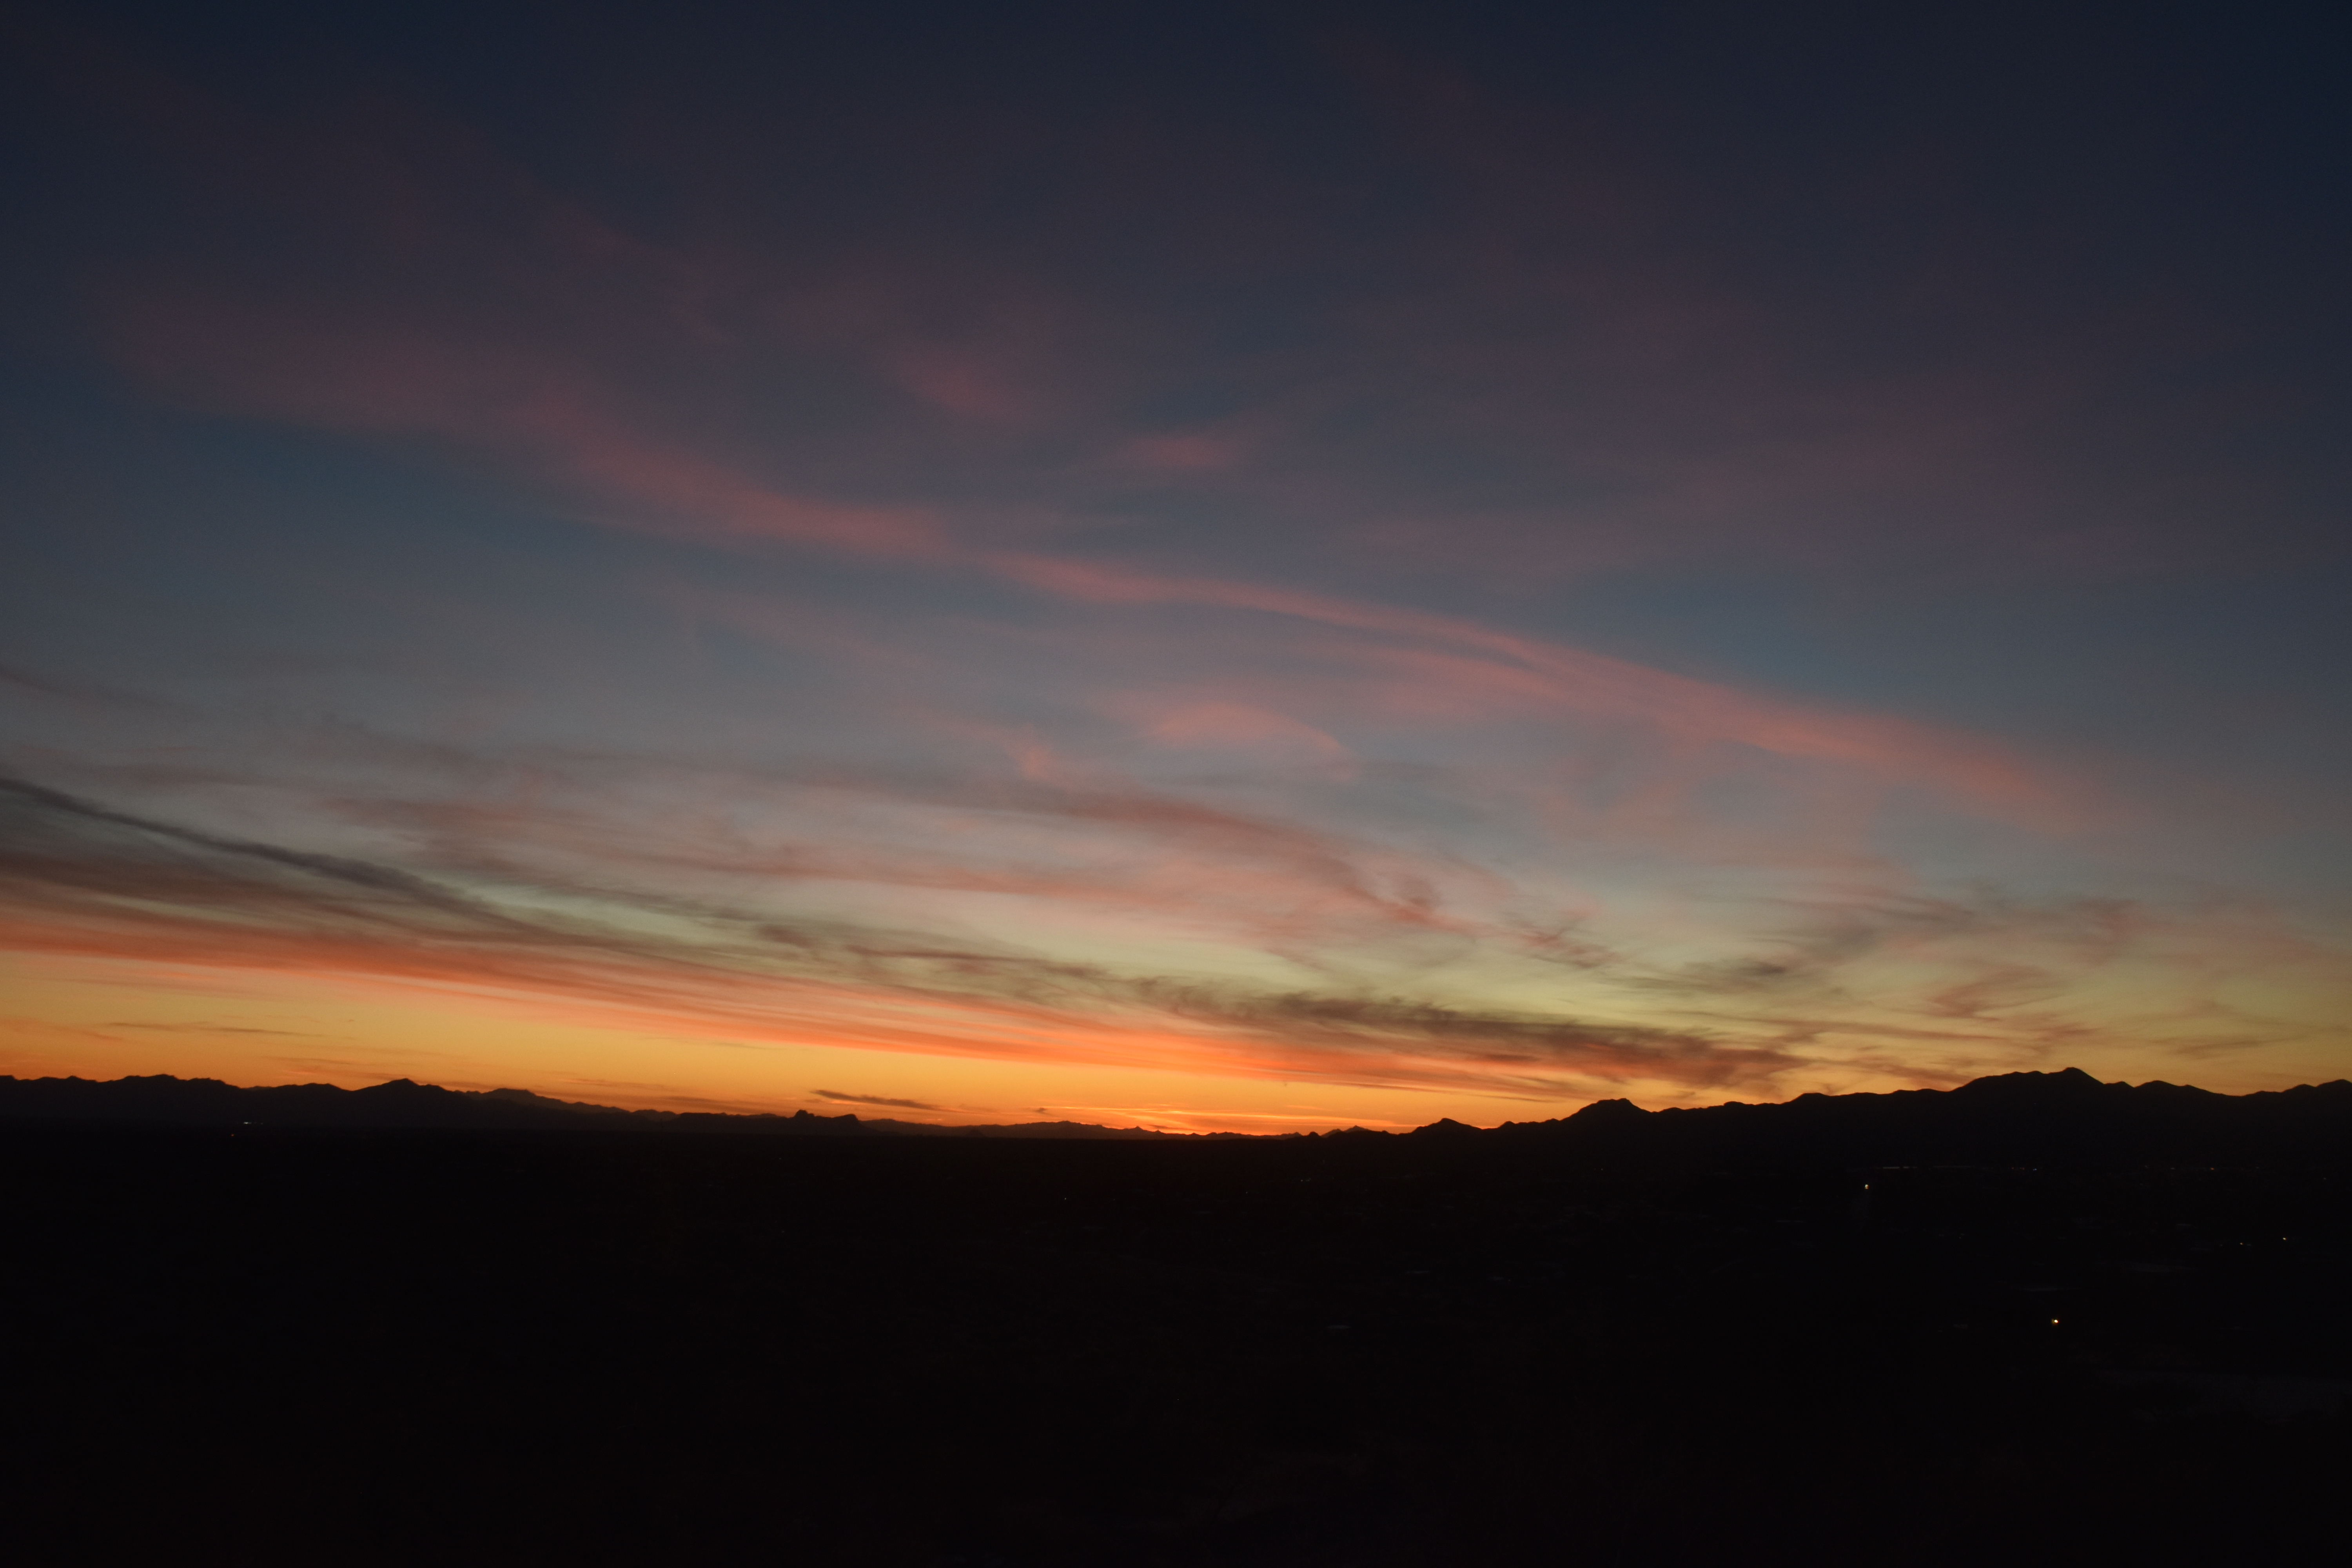
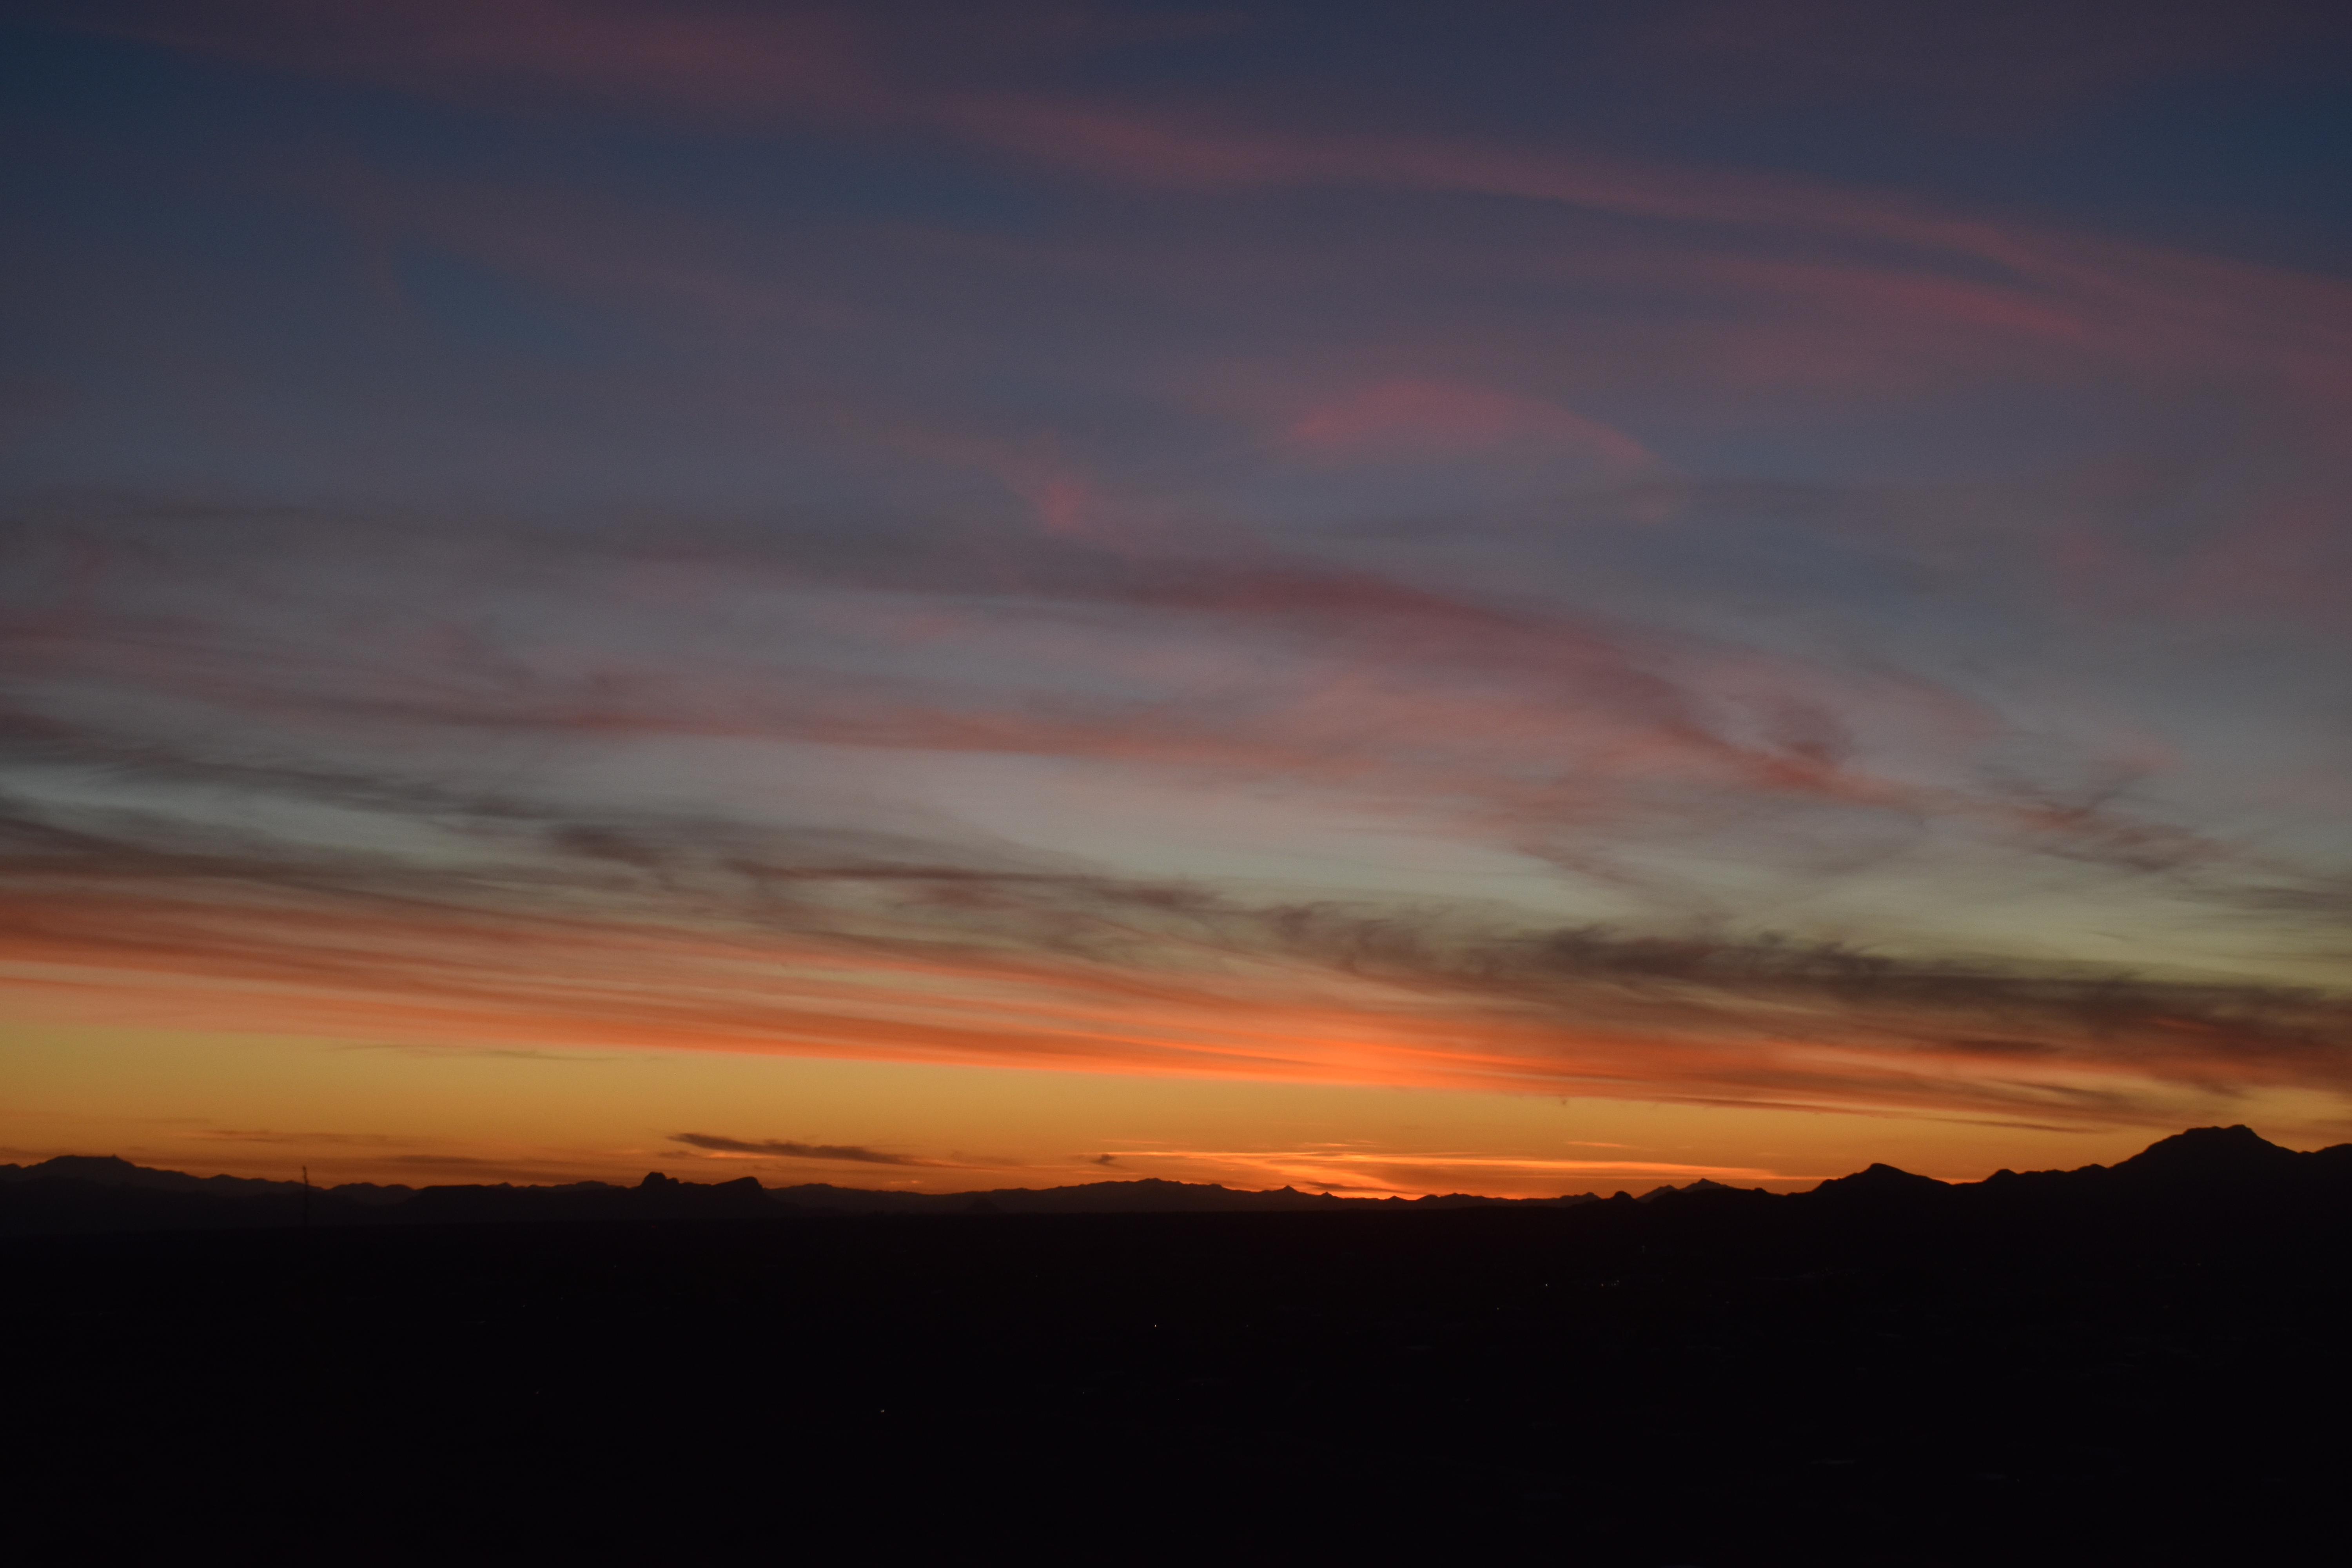
Moving on to a new topic, let us look at last evening’s sunset rather than ponder what happened to the weather computer model, that is, which panel above is likely correct1:
6:09 PM. Cirrus uncinus and other forms of Cirrus provided a beautiful sunset highlight.
The End.
—————————————
1The first regime above, the troughy, cold one, is strongly supported by ensemble outputs whose crazy-looking output plots are fondly referred to as “spaghetti”. The second panel served up from just last night’s 5 PM AST global data is not.
Have not looked at last night’s ensembles, but will ignore the bottom run anyway; will not panic as weaker elements might, that is, change my overall interpretation of troughy conditions in late Jan, early Feb., that is#2, reverse course now, predict drought and warmth for early Feb. , that is#3, “yo-yo”, as forecasters describe reversing course, confuse the public, lose credibility, where are my pills?
……yet. :}.
Still, “egad re this delta model”, as Bill likes to say. Its astounding! A total joke! The later one to be totally and completely rejected!
In no way did I expect to see what’s in the bottom panel, which is now above here! Trying to not panic real hard. (more kidding)
Still, how can there be an outlier of that magnitude as we see from last night? Must be a real bad error somewhere (maybe 2 kts of wind, 1.5 deg in temperature, wind direction, 5 decameters in geopotential height, etc), not an itty-bitty error as ensembles start with. Maybe Russian2 hackers did something, the North Koreans, or the Chinese? Just kidding
with weather noise and pseudo-paranoia, your Catalina cloud-maven of sorts.
Speaking of Russia, my great-grandparents emigrated from the Ukraine, here’s the cover of my latest book, published a few years ago. Well, its not my book per sé, but all the cloud photos in it are mine! How great izzat?
A book about flying. I asked that my contributions be dedicated to A. M. Borovikov, the great Russian cloud physicist. Did a lot of airborne stuff in the 1950s and 60s. The cover photo above I took while in KWAJEX in 1999, a tropical cloud study featuring several research aircraft centered at Kwajalein Atoll, Marshall Islands. Of note, seeing a monument to the bravery of the Japanese soldiers (fair enough), and seeing a Japanese military plane land there during our six weeks. Gorgeous clouds! Kwajalein Atoll is the terminus of missle launches from Vandenberg. Alerts on TEEVEE tell you when they’re coming in. Unlike in Hawaii where people panic when missles are coming in, folks on Kwajalein go out to “see the show.”
0.22 inches was, indeed. how much rain fell in the form of drops from Nimbostratus clouds yesterday as a modest little rain band generated by a rapidly moving trough swept through during the afternoon. Regional precip values can be found here. Our local area got the most, up to about a quarter of an inch, as often happens in marginal storms.
Yesterday’s storm marked the beginning of the new, more normal weather regime for southern Arizona, as has been blabbed about here in recent weeks. No more week after week of droughty weather with temperature far above normal, the kind of weather that has marked this whole fall and winter so far! I. e., “Thank you very much, a snowbird might say, but get the hell out!”, the rest of us might conjure up, thinking about the needs of our desert’s wildlife and vegetation.
Indications are now that below normal temperatures and above normal precip are ahead for us and all of Arizona in late Jan and early February.
The evidence for these claims?
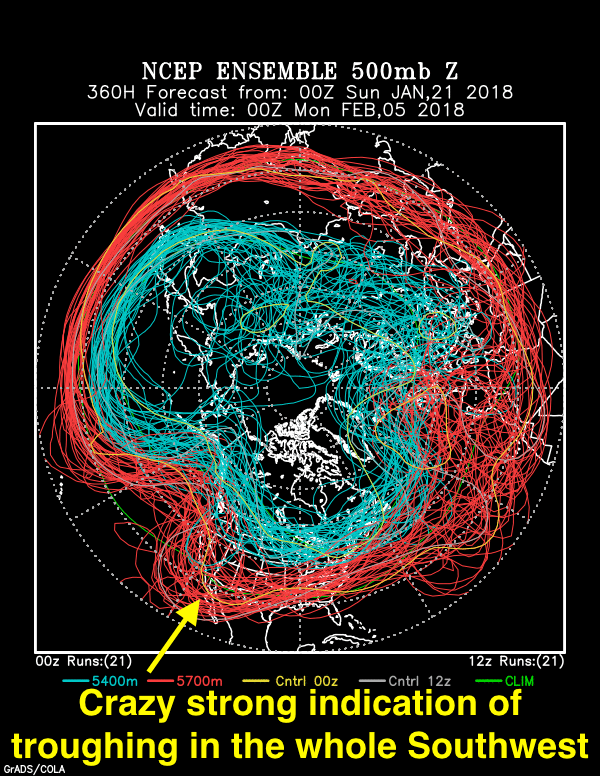
Below, the stunning, jaw-dropping evidence for this seemingly outlandish assertion in the form of an ensemble (spaghetti) plot generated by NOAA last night. I have followed these charts for almost ten years now, and I cannot remember when such a strong signal (clustering of flow lines) 15 days out has occurred before in our region.
So, excessively excited this morning when I saw it! Its been annotated with excitement text.
This troughy pattern begins to take place on January 30th. Until then, a strong but dry cold front with a lot of wind comes by in a few days, on the 25-26th.
Valid at 5 PM AST, February 4th. You can pretty much count on a trough hereabouts in two weeks. Since the blue lines, the colder portion of the jet stream, do not dip down this way so much, our troughiness likely would be in the form of something we call a “cutoff low.” A full latitude trough extending from the “blue jet” up there in Canada, instead of a “cut off”, would be excessively cold. We probably don’t want that anyway.
Yesterday’s clouds
The whole interesting, if excessively gray story is shown below:
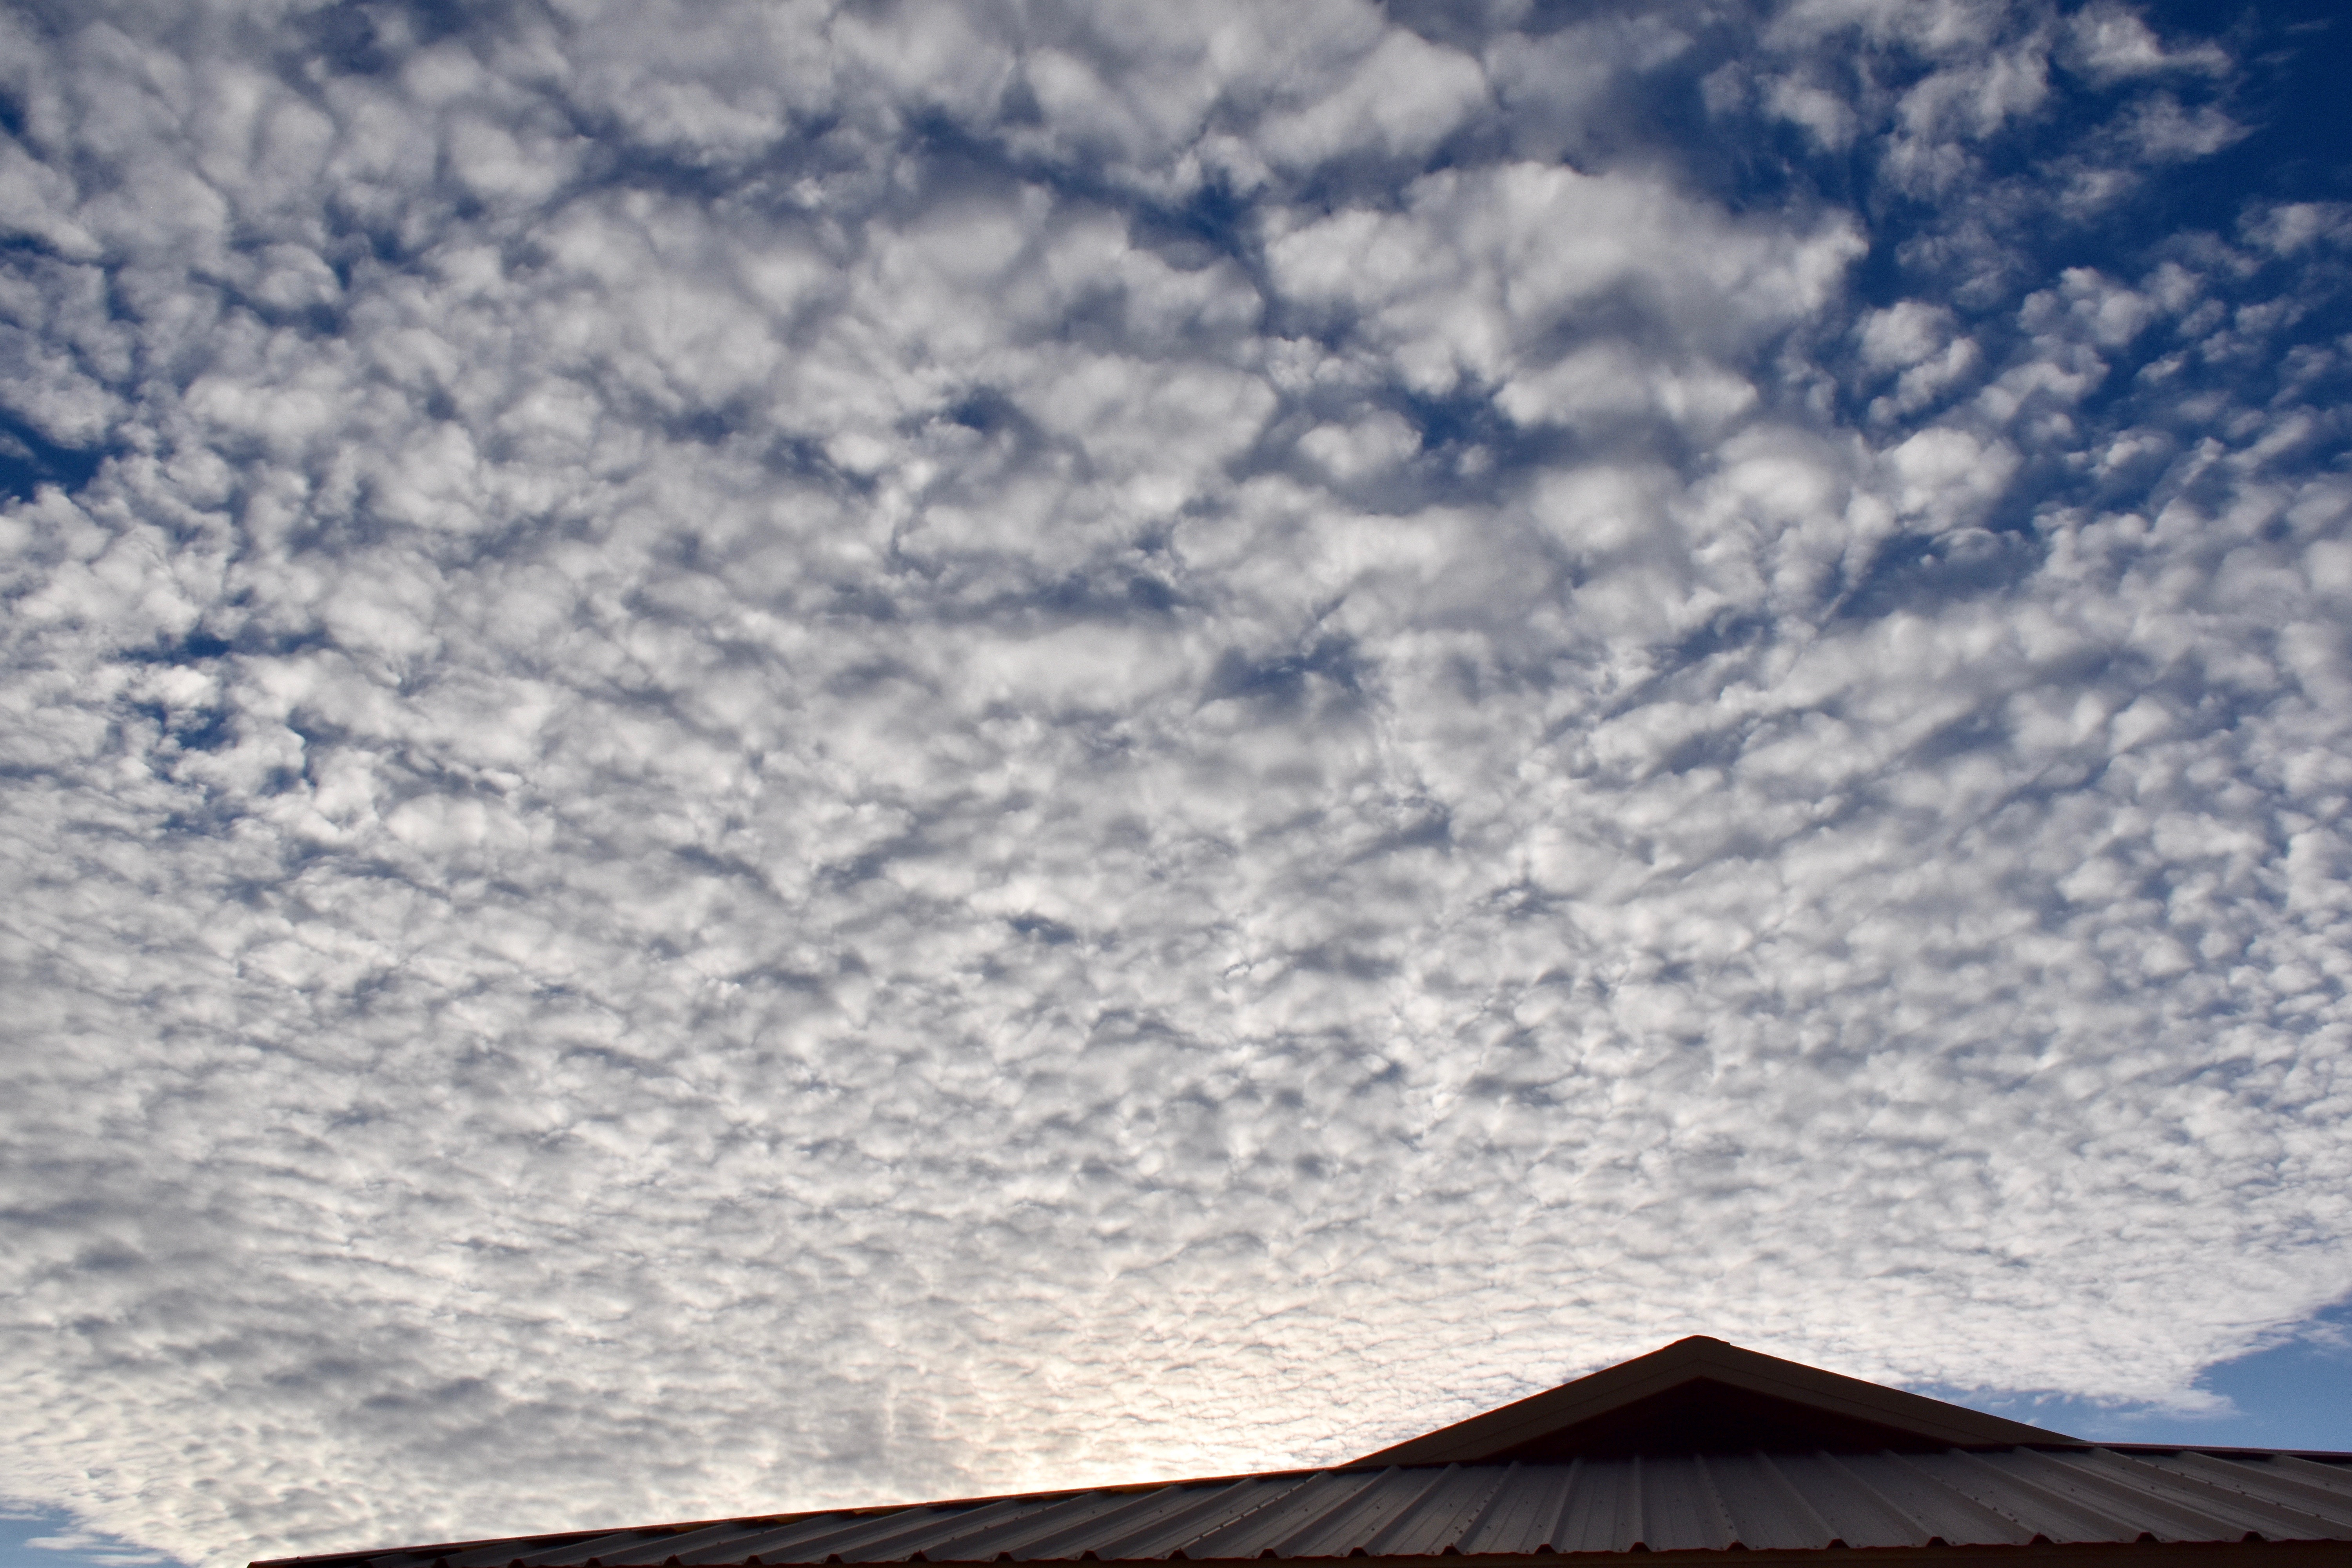
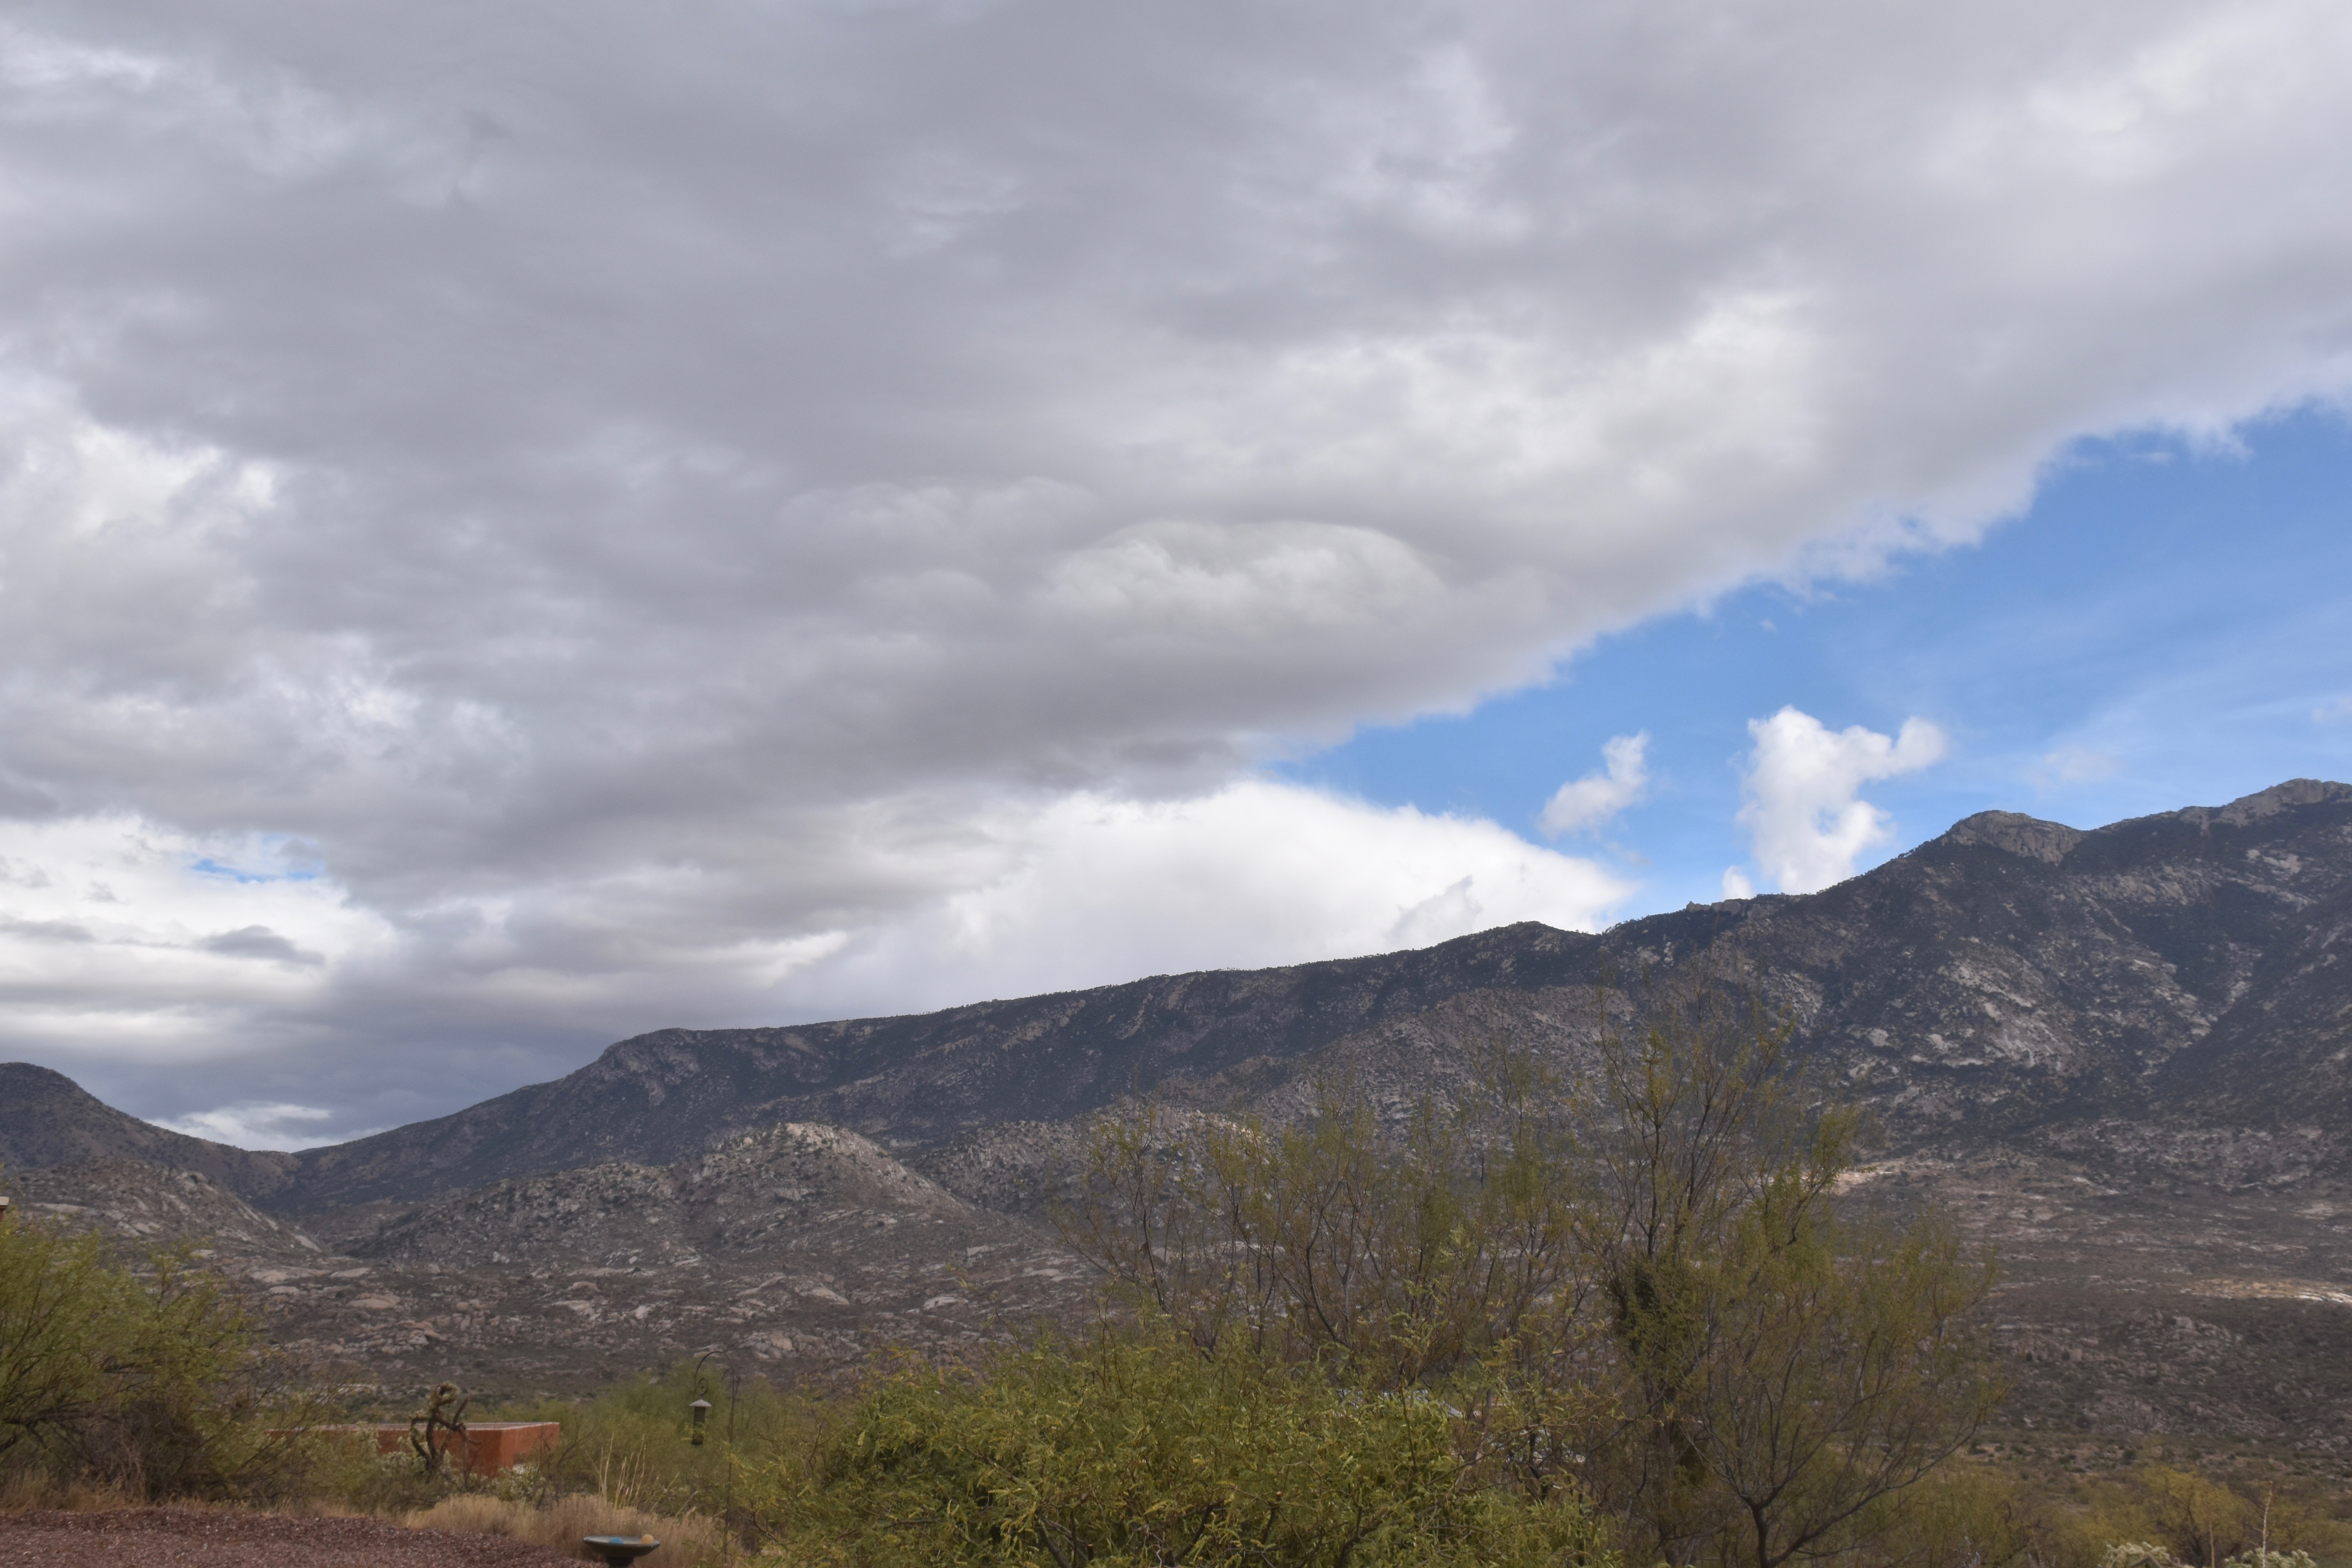
7:24 AM. It was breezy already, and with Cirrus underlain by Altocumulus lenticularis clouds in the lee of the Catalina Mountains, you knew that a storm day was ahead without turning on your favorite TEEVEE weatherman.8:53 AM. With Cirrus and Altocumulus spreading rapidly from the SSW, lenticulars downstream from the mountains, the wind gusting to 25-35 mph, you knew a great gray cloud day was in store!11:32 AM. Before long, an entire sheet of Stratocumulus spread over the sky, making you sure that rain would fall.12:50 PM. First drops begin to fall on Sutherland Heights. That layer of Stratocumulus appeared to be deepening as it approached from the SSW to where the tops were getting just cold enough upwind of us to produce ice and snow that melted into those sparse drops. Not enough ice /snow formed to hide the bases, though, in virga.1:26 PM. Snow begins to fall on the Lemmon.2:04 PM. Lower Stratocumulus clouds begin to show up below the original deck that overran us.
3:16 PM. Pretty and dramatic. Stratocumulus piling up over and upwind of our Catalina Mountains/Pusch Ridge.3:19 PM. Oh, so pretty.3:27 PM. Crazy, I know, but I thought these scenes were so pretty!3:28 PM. As that rain band approached there were some nice lighting highlights.3:40 PM. Here comes that rain band across Oro Valley/Marana.4:19 PM. A truly great scene for a desert; mountains partially obscured in precipitation.4:19 PM. Nimbostratus. Its hard to get a better photo of rainy Nimbostratus than this. Drops coming off the roof, NOT raindrops, can also be seen. This was at the peak of the rain, too! Very exciting.5:54 PM. Sunset Stratocumulus, hold the ice. Yet, that Stratocumulus was cold, way below freezing.
The weather way ahead
The title sums up where we are now. Will we go have more rain? Oh, yeah. But not right away, as you already know.
What an amazing and “productive” little rainband that was just after midnight! And more rain is likely with weaker bands just upwind here at 4 AM. Could we really approach an inch? Amazing. Didn’t seem possible in this small mind that we could amass that much. For a full regional rain table, go here to the ALERT gauge records.
Now, after this ends, a long dry spell has to be endured, at least until around the 20th of Jan, at which time we hope the troughs and rain threats at least, will begin to barge in every few days, namely, and pattern more typical of winter sets in.
Yesterday’s clouds
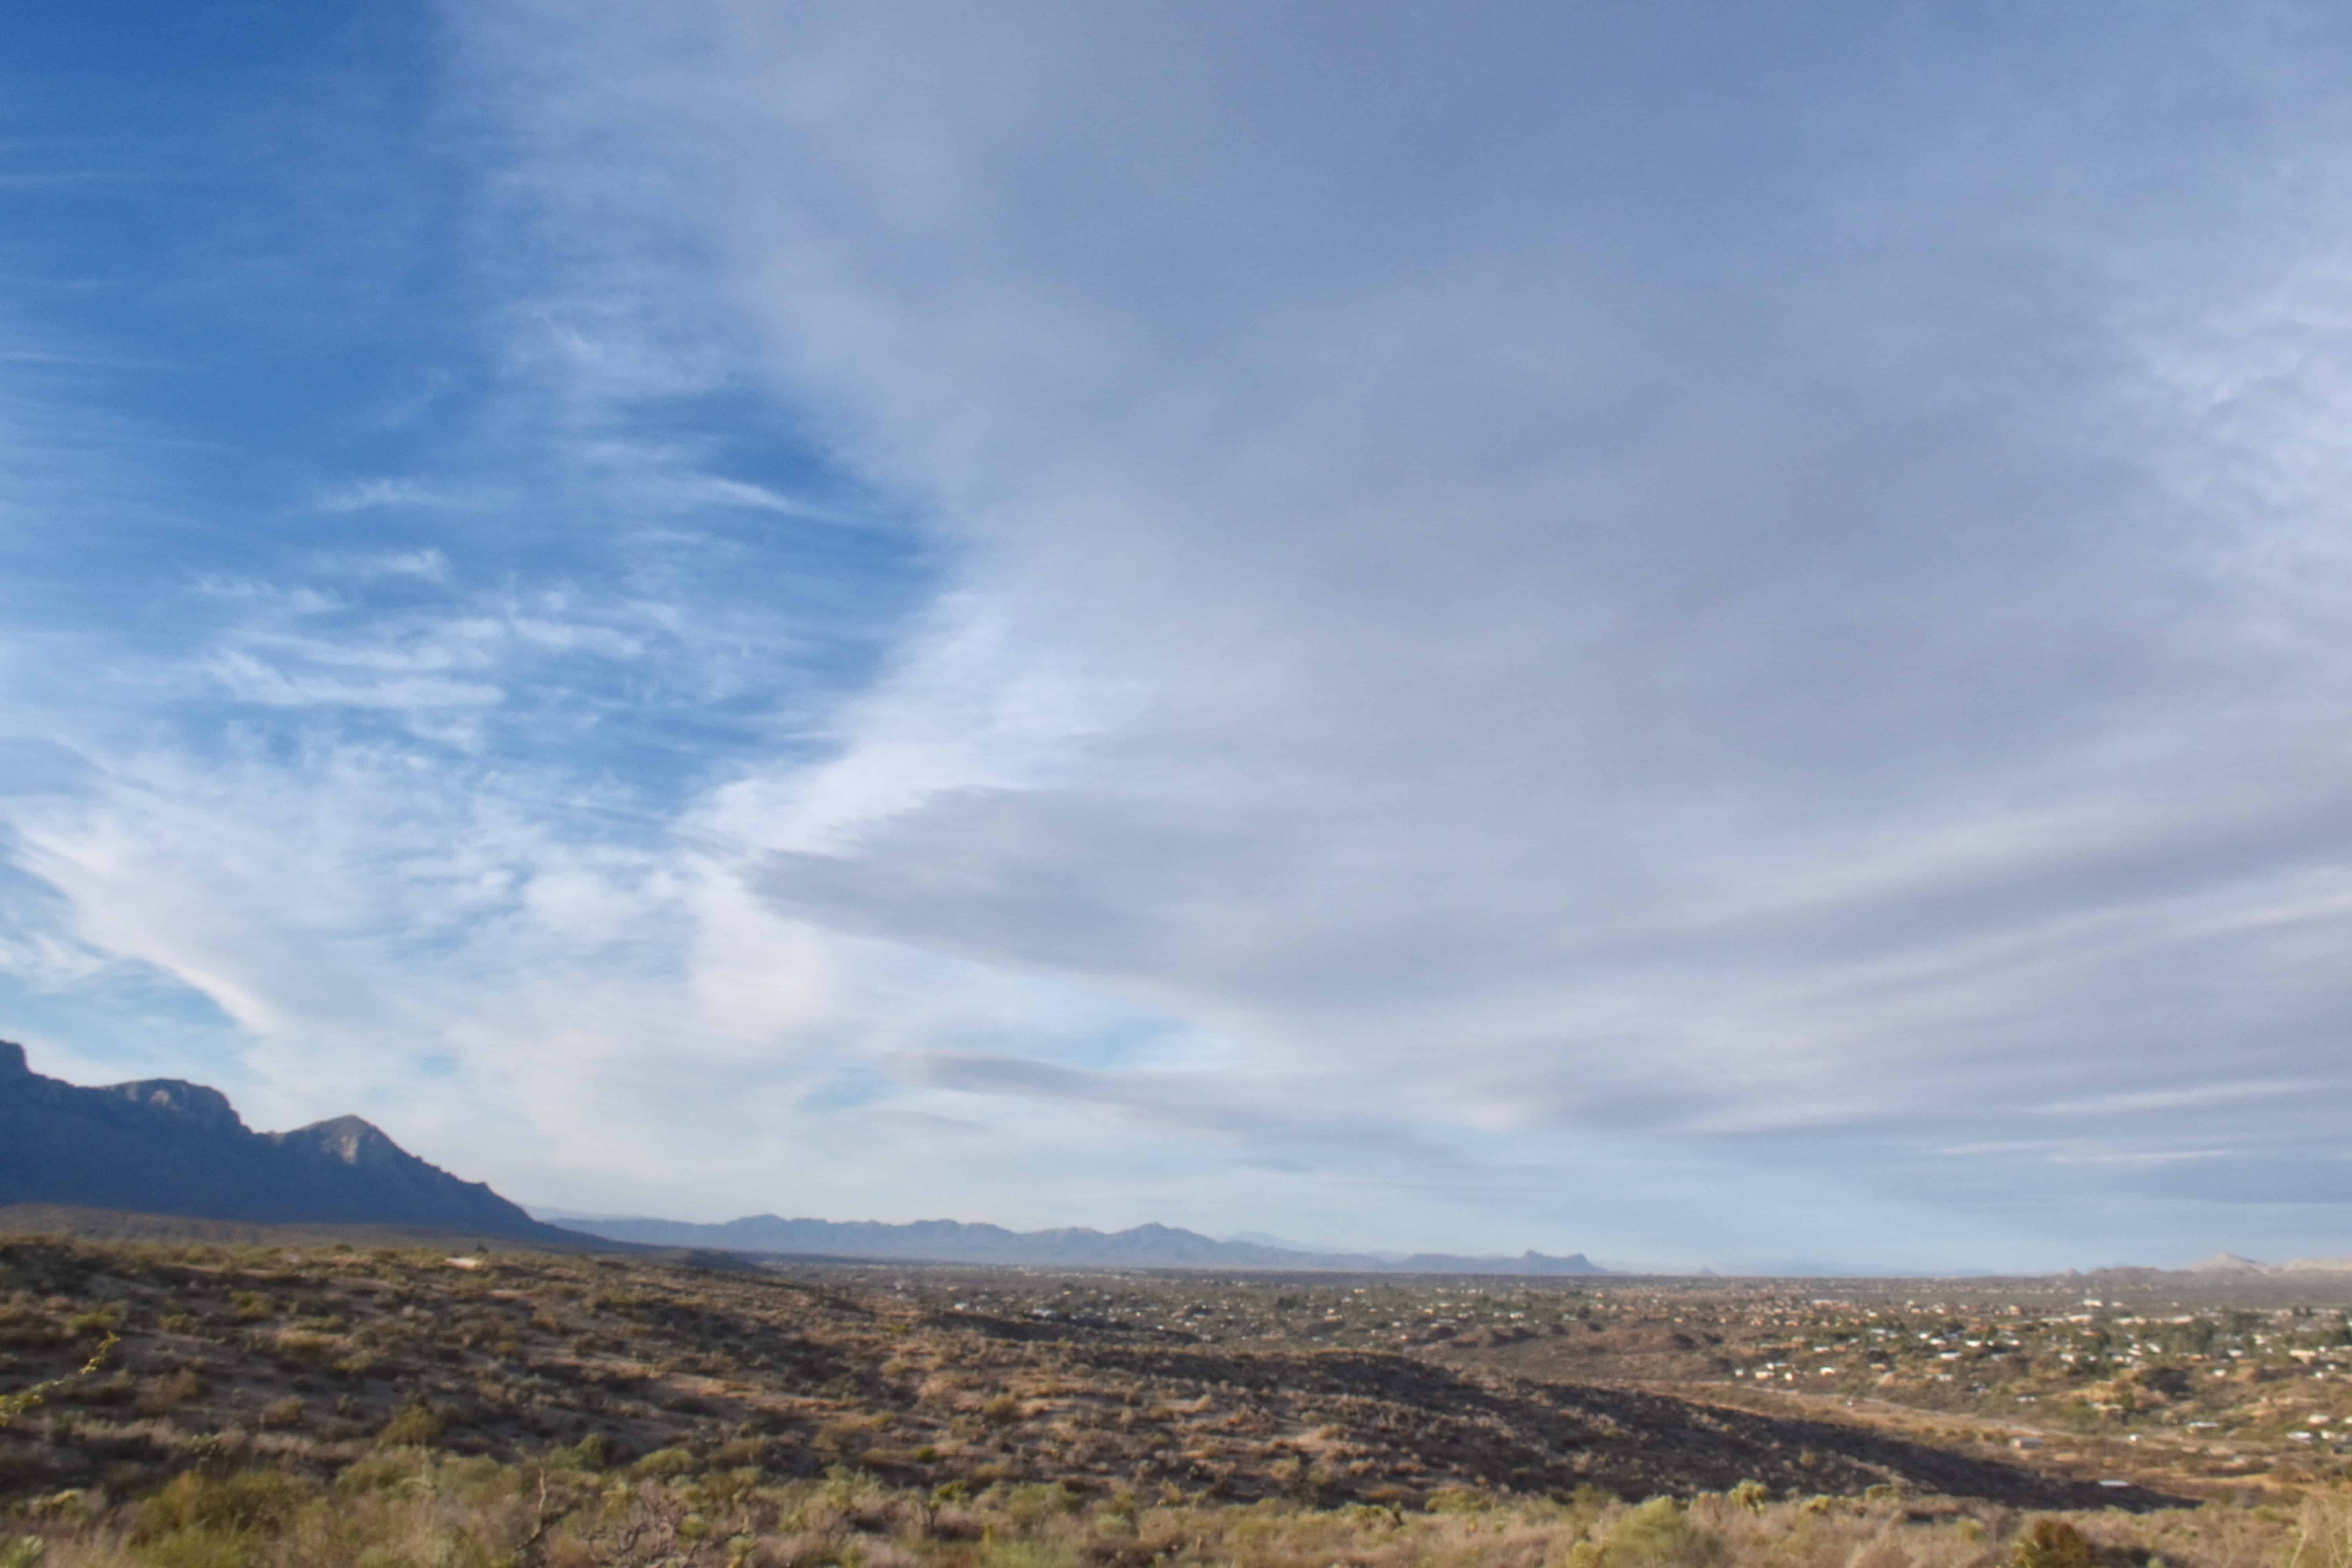
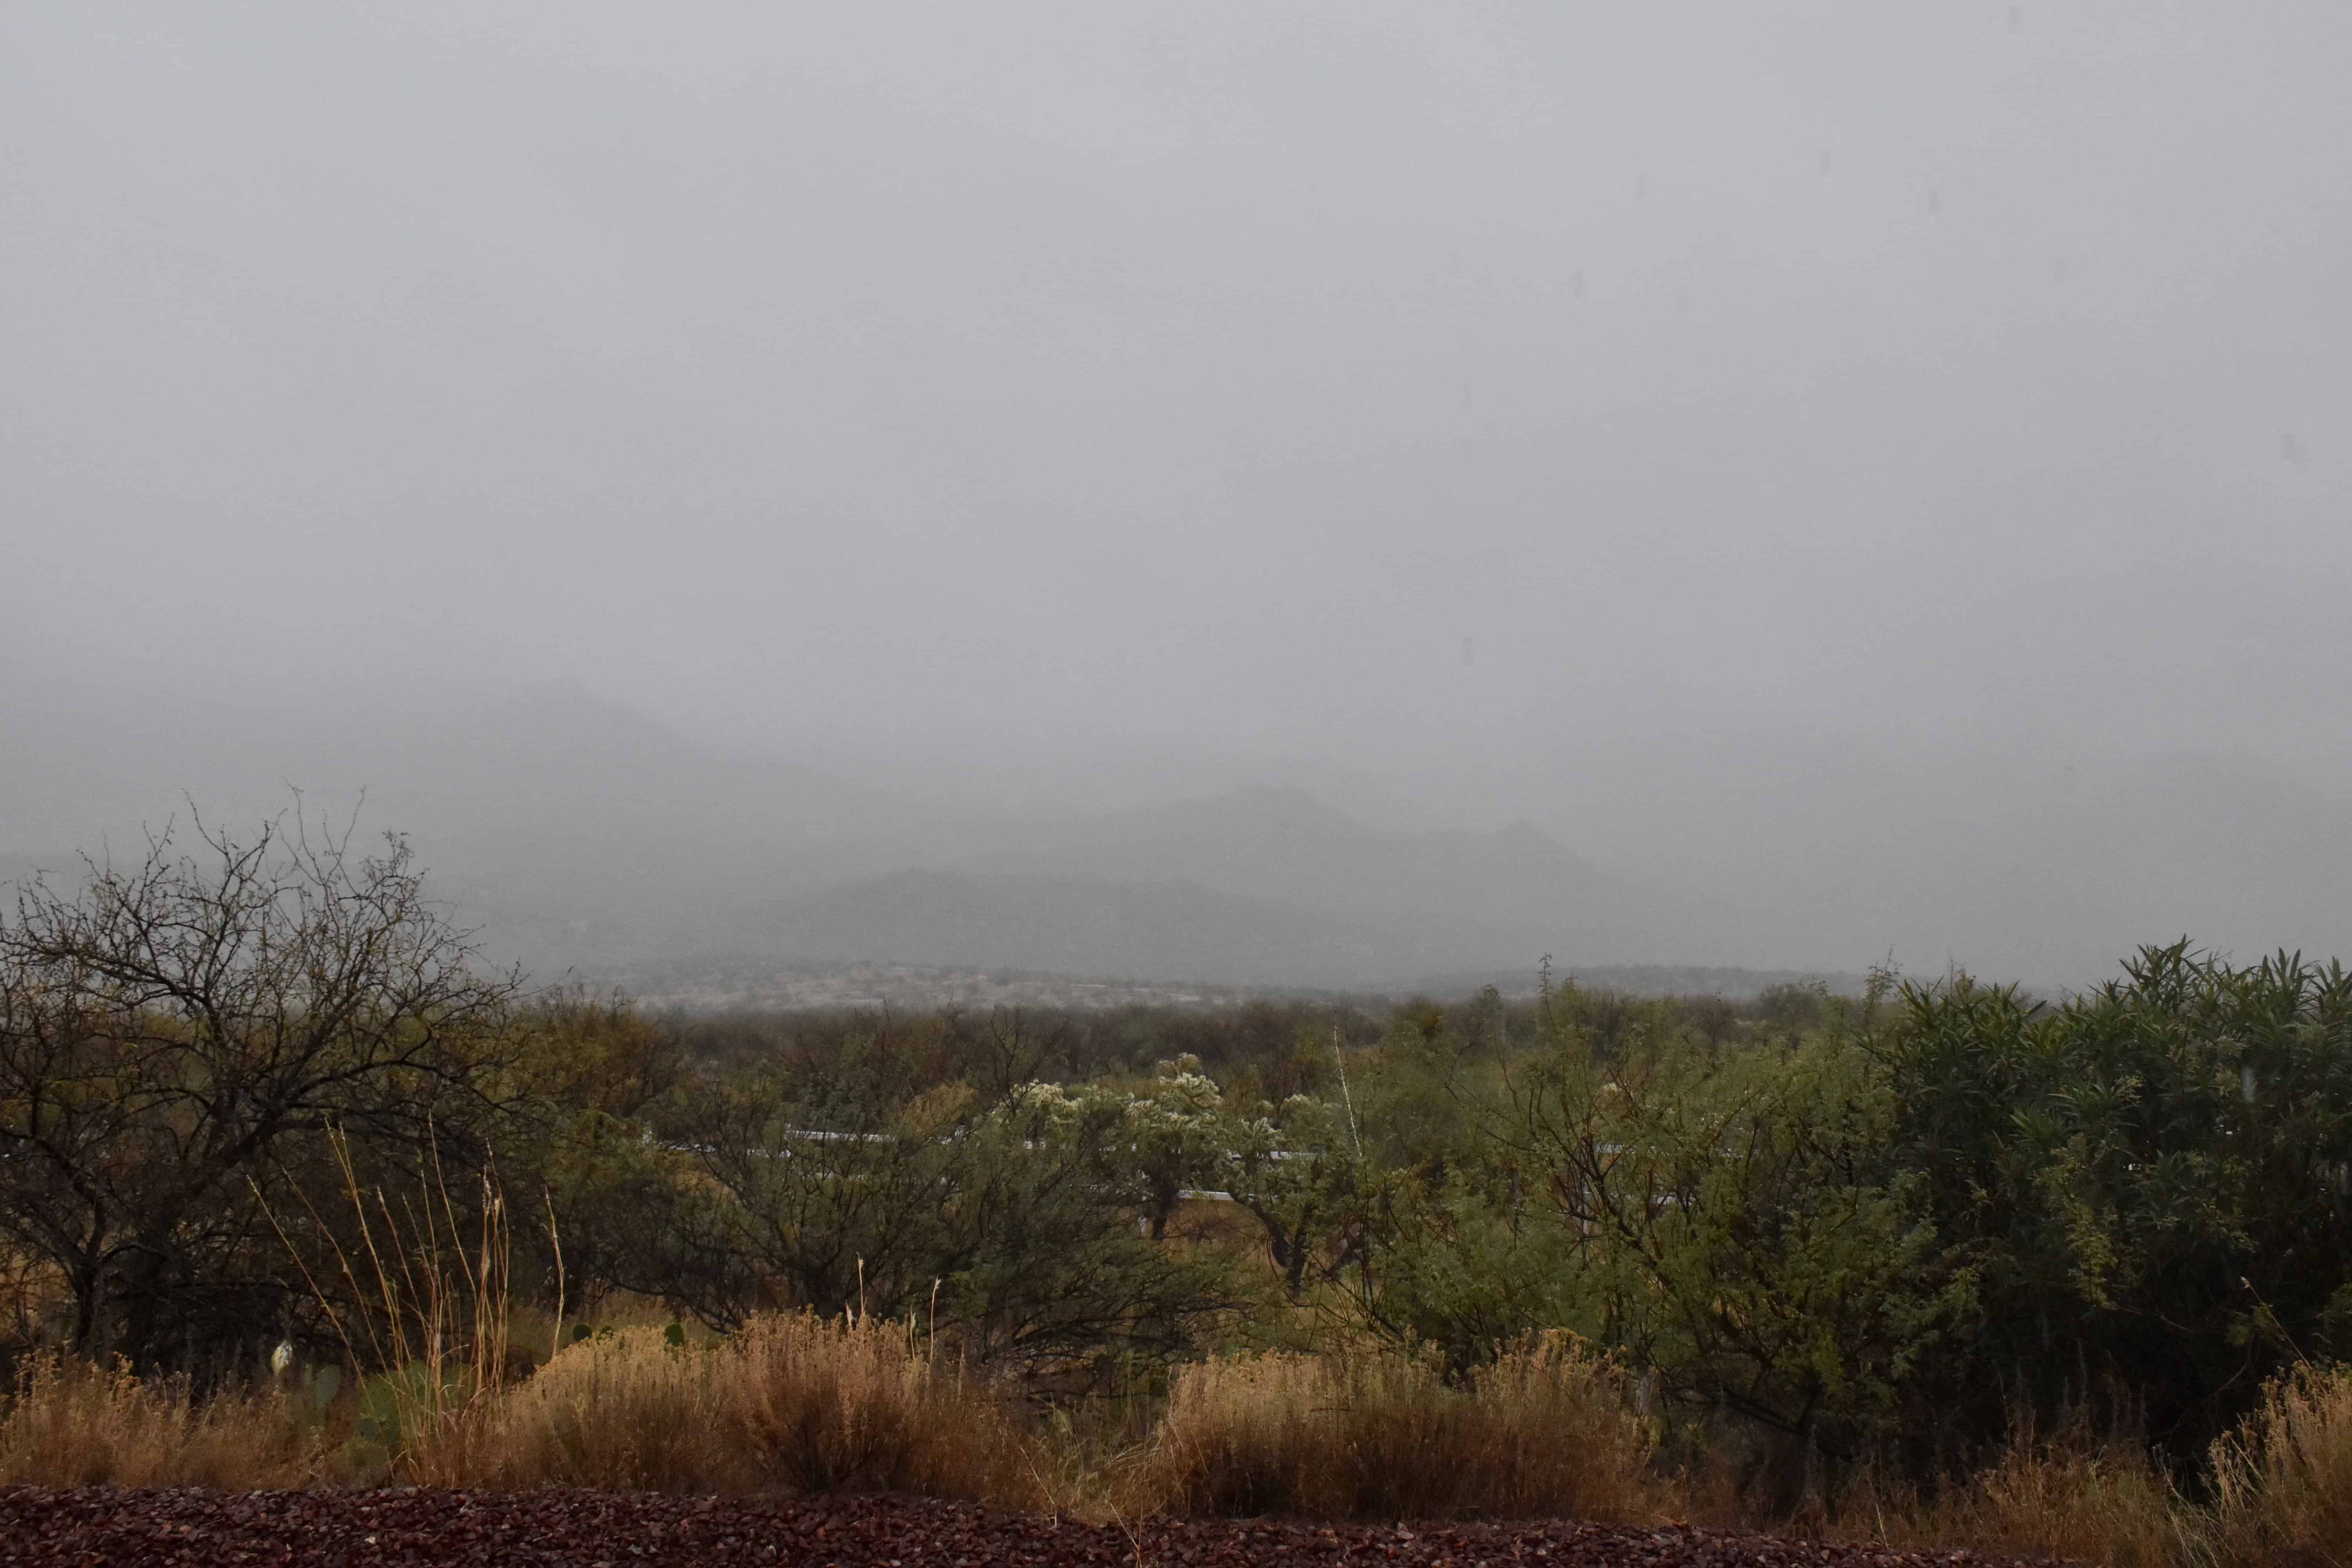
8:31 AM. Typically lenticular clouds form in the lee of the Catalinas as storms approach. Lenticular clouds are good signs of deteriorating weather ahead since they are usually accompanied by strong, moistening winds aloft.8:31 AM. Zoomed view of one lurking just beyond the crest of Ms. Mt. Sara Lemmon. The higher clouds were Cirrus (which can have grayness when the sun is low).10:24 AM. Wasn’t long before this deck of Stratocumulus raced over the sky, adding that feeling that rain is a comin’.11:32 AM. Some tendency to form the new supplementary cloud feature, termed, “asperatus undulatus” is shown here at the base of the Stratocumulus deck.1:13 PM. Got excited when ice began to show up, with virga and light rain showers here and there. Can you see that icy top receding from the Catalinas? It wasn’t that high and cold, either.1:14 PM. Nice highlighted view of Biosphere 2, with light rain showers in the background. Whodda guessed Bio2 would get 1.93 inches overnight? Not me!1:59 PM. Light rain showers began to fall from that Stratocumulus layer, now pocked with buildups (Stratocu castellanus?) as temperatures aloft above cloud top cooled. The haze is due to rain falling from overhead. It did not measure.1:59 PM. Looking upstream and the Stratocumulus deck whose tops were just ascending to the ice-producing level as they approached Catalina from the SSW. That clearing on the horizon maintained throughout this cloud and shower period suggesting it was caused soley by the lifting of the air as it approached the higher terrain of Catalina and the mountains. It was soon to disappear.3:02 PM. Falling apart.3:49 PM. Gone. Yes, once again, the clearing before the storm. A storm is approaching, 100% chance of rain within 10 h, and yet, the clouds are disappearing! This is a common here; a dry slot in the moisture field OFTEN precedes storms here. To some folks it may mislead them into thinking the storm’s a bust. But not to us CMP’s, who seen this happen over and over again.5:09 PM. Temperature’s in the low 70s; its getting to be a nicer day by the minute. Where’s that storm?5:43 PM. Our storm and cold front marches toward us from somewhere over the horizon, though visually you’d never know it. Wonder if the native Americans knew this odd sequence–probably.
The weather ahead
After the last drops fall today, we’ll suffer through another dry spell and warm up though about the 20th when a major trough passes by.
The End
Oops…. Have cameras ready for a great day of cloud shots once the sun breaks through.
I was thinking how great yesterday was for you. Started out with a spectacular sunrise (lasted just a couple of minutes), and then you could watch for pretty much the WHOLE day, orographically-formed Altocumulus opacus and castellanus transition to ice crystal clouds (in this case, Altostratus with virga and some mammatus) right before your eyes!
Sunrise:
7:16 AM. Flecks of Altocumulus clouds below Altostratus.
After sunrise….this odd scene below of an extended Altocu lenticular cloud:
7:33 AM.12:24 PM. Altocumulus opacius shedding ice as they moved westward across Oro Valley.3:01 PM. Altocumulus castellanus forming just upwind of the Catalinas, moving toward the west (to the left in this photo). No ice is falling out yet, though tiny ice crystals are likely starting to form.3:01 PM. Looking farther downstream from the prior photo. Some ice is beginning to show up and fall out (center and left side of photo).3:02 PM. Looking still farther downwind, those Altocumulus clouds are mostly glaciated, that is, mostly consist of ice. This transition has taken about 10 minutes of travel downwind. The sounding near this time, indicated that tops a little downwind of the U of AZ campus release site, were about -27°C (-17°F). However, tops were likely rising some small amount in this region downwind of the Catalinas, and so were almost surely, even a little colder than that.4:33 PM. Nice example of what some of the Altocumulus castellanus looked like yesterday. That tallest turret will fall back. Its partner is just to the right, one that was previously as high, but fell back, its load of ice crystals drifing down. Some of the ice in the taller one is still being held up there until it, too, collapses. A error in aircraft sampling can occur if you don’t realize that tops have collapsed from lower temperatures, such as when collecting ice concentrations in the collapses one. You could easily assign a cloud top temperature that was too high; would not reflect the temperature at which they really formed.
5:38 PM. Altostratus with nearly straight lines of lower hanging virga in the distance. One cannot help but wonder if the passage of an aircraft enhanced the ice falling out and that’s why they are so linear. There were quite a few aircraft-induced lines of ice yesterday, but all developed in cold Altocumulus clouds. There’s one over there to the north….5:33 PM. Lppking over there to the N and you can see a rivulet of ice falling below that patch of Altocumulus. one of many yesterday, though this is the prettiest one. You can also see that there is something “wrong” here. The trails below appearing to be slanting toward the west and the flow was from the east. This indicates that the flow was stronger at lower elevations, an oddity.
Brain’s been pretty empty lately, not much to say except “same old same old”, as here.
But then some wild computer forecasts came out last evening that were worth mentioning in light of the fires that have plagued southern California.
Why?
Because they suggest that a belt of tropical flow will break through under the gigantic ridge that has blocked storms from the entire West Coast over the past weeks.
Sometimes, as most weathermen know, such persistent ridges get too big for their britches, that is, over-extend to the north, and then fracture, letting through moist tropical air from lower latitudes of the Pacific ram into the West Coast. Often the very greatest rains in California are associated with such patterns, as you could guess since there is so much water with those lower latitude-originated jet streams that strike the coastal mountains head on. Here’s the concern, this output valid for Christmas Day:
This from last night’s 5 PM GFS global model run, valid for 5 PM AST Christmas Day. What is shown is that the tropical input is about to combine with a trough over the Bay Area. When this happens both are energized.
Rain is forecast to have fallen in southern Arizona before this point, however; our measly 0.01 inches so far here in Sutherland Heights so far in December will likely be added to along with a switch to uncomfortably cold weather.
Of course, we look for support in these longer range forecasts by having some spaghetti–that is, take a look at what we call “spaghetti”, those crazy plots in which the model starting conditions are tweaked that bit to see how the model runs change. Here are some plots, also from last night’s model.
As you can see in this first plot for the evening of December 22nd AST, the clustering of blue and red lines off the West Coast, that our blocking ridge (composed of a deep mass of warmer air) is extruding all the way almost to where Santa Claus lives, yes, that far to the north. In fact, so far that it will be unsustainable over that distance fromt the deep tropics to almost the North Pole. At this point, cold air is pouring down the east side of that ridge and into the Pac NW and eventually down toward us. Does that extremely cold air make it here? Not sure yet, but its something to watch out for before that ridge fractures and allows warmer, moist Pacific air to reach us. So much uncertainty, so much fun! I am really pumped up about all this uncertainty!
Valid at 5 PM December 22nd. This is really strong support for a major trough in the SW, and likely rain in southern AZ, Sutherland Heights around this time.
Below is the spaghetti dish for the “breakthrough” flow situation shown in the prog output valid for Christmas Day with some annotation on it.
Looking at the above, I think we can count on a breakthrough flow pattern from the Pac. Where it barges into the West Coast will be subject to question over the next week or so. That really can’t be determined right now.
I am sure those in southern Cal hope, if there is a breakthrough from the Pac, it comes in farther north than shown in the model run here today! Patterns like the one shown in that run can routinely produce 10 inches in a day once they get going should something burst through at low latitudes.
The brighter side would be that the chances of a significant rain here droughty southern AZ would at last increase.
Hope you saw them and recorded them in your cloud and weather diary. I’m thinking that at the next Cloud Maven Junior meeting we should devote a lot of time to this issue. It was a rare day yesterday that the WHOLE day had that phenomenon occurring as aircraft penetrated those clouds, usually on ascent or descent. Sharp descents/ascents produce holes. See the sequence below if you don’t believe me (ppt from a recent talk):
Yesterday’s clouds: lots and lots of aircraft-produced ice
(btw, see note below about pop-up ads in this blog, ones that started to appear after downloading latest WP software)
6:44 AM. Altocumulus at sunrise. As we say so many times here in old AZzy, “So pretty.”Also at 6:44 AM. From a smartphone, color not so great, though not bad either.U of AZ Wildcats balloon sounding, launched at about 3:30 AM yesterday. Those Altcumulus clouds were way up there for Altocu, 22,000 feet above Catalina, 25,000 feet above sea level.because they were so high, were so cold, AND were composed of supercooled liquid water, they ripe for aircraft to create ice going through them, likely on climb out and descent from TUS and perhaps PHX as well, Davis-Monthan. What was unusual, was that it was happening most all day as the clouds filled in some. They remained liquid, high, and cold.7:23 AM. Wasn’t long before aircraft made their presence known in this cold, cold layer.6:54 AM. I should point out that a colder topped Altostratus layer was present to the N. Its not represented well in the TUS sounding. That layer was all or mostly all ice (the rosy colored segment of this photo).7:37 AM. An unperturbed view of Altocumulus perlucidus (“Mackerel sky”). Are there any mackerel left? Also, from a cloud viewing standpoint, these are much higher than one would guess. The fact that aircraft were making ice in them is a clue that they were higher than we would normally think of a “middle-level” cloud. I like patterns like this. I thought you would like to know that about me.9:03 AM. Slicing and dicing. An aircraft has left a contrail through a Altocumulus line . What’s really unusual here is the ice contrail so far outside the liquid water cloud. It is thought that hole-punch and ice canals are limited to regions where there are liquid droplets, and so this is quite an anomaly, one that suggests the humidity was almost 100% with respect to water outside the cloud boundaries. Also, can you just make out the partial 22° halo, indicating very simple ice crystals like columns and plates? Streamers of tiny ice crystals are also evident, trailing to the right, below the contrail? This shows that the wind decreased rapidly with height just below the flight level, but was still from the southwest to west.9:24 AM. Coming at you, another ice-canal has formed SW-W of Catalina, a favored locale for the formation of these canals on days like this.9:40 AM. What’s left of it is almost to Catalina. Note streamers of ice. Below, a close up of a couple.9:40 AM. The intensity and narrowness of these streamers point to an artificial origin. So, even if you didn’t see the canal, and here, some of the clouds are reforming at the top of the streamer, you would make a good guess that this was not natural ice. Sometimes the canals can fill back in if the air is in overall ascent at cloud level.9:57 AM. Here’s what those contrails in Altocumulus look like as they first appear. Can you spot’em? There are two.1:45 PM. Another aircraft-produced ice event as the Altocumulus increased and became thicker, making detection of these events less obvious. Sometimes a canal clearing is very muted.4:12 PM. Aircraft-induced hole punch cloud with ice below the hole. Can you spot it? See close up below.4:12 PM. Close-up of that hole punch, ice mostly below the Altocumulus layer.4:35 PM. That hole punch cloud 35 min later. The long trail indicates high humidity well below the Altocumulus layer in which it appeared.The 3:30 PM balloon sounding from the U of AZ. A study in ambiguity.The day ended with an unusually bright sun dawg, mock sun, or parhelia. So bright it did, again, suggest a plume of ice from a prior aircraft passage through extra cold Altocu or Cirrocu clouds. But, just wild speculation here. Hope you don’t mind.5:41 PM. Nice sunset, but one strongly impacted by clearing from aircraft-produced holes and lines of ice, the ice now mostly gone.
The End
——————About those nuisance ads—————
Note to me and the two other people that drop by my cloud or “clod” blogulations: The embedded pop-up ads are due to a WP third party plug-in that needs to be repaired. It will likely happen today.
After consultations about ads…
Oddly, those pop-ups and blue highlighting and double underlining do not seem to be present outside of my personal view of my own blog, this according to hoster, “godaddy.” Even using a different browser other than FIrefox does not show them as I have just verified.


