A New Decadal Climate Oscillation Detected in Past Data a Long Time Ago? A Fool’s Journey? Namias Reacts

Purpose of this post of ancient, unfinished work with the humorous title:  Could it inspire someone to continue it in a more sophisticated way than I have?

Named climate/weather influencing  “oscillations” have become so numerous in the scientific literature (e.g., Atlantic Meridional Oscillation, Arctic Oscillation, Pacific Decadal Oscillation, El Niño-Southern Oscillation, Atlantic Oscillation, Quasi-Biennial Oscillation, Madden-Julian Oscillation, etc.)  one is tempted to ask humorously, “Doesn’t everyone have one?”

Well, I do, but this research is incomplete.
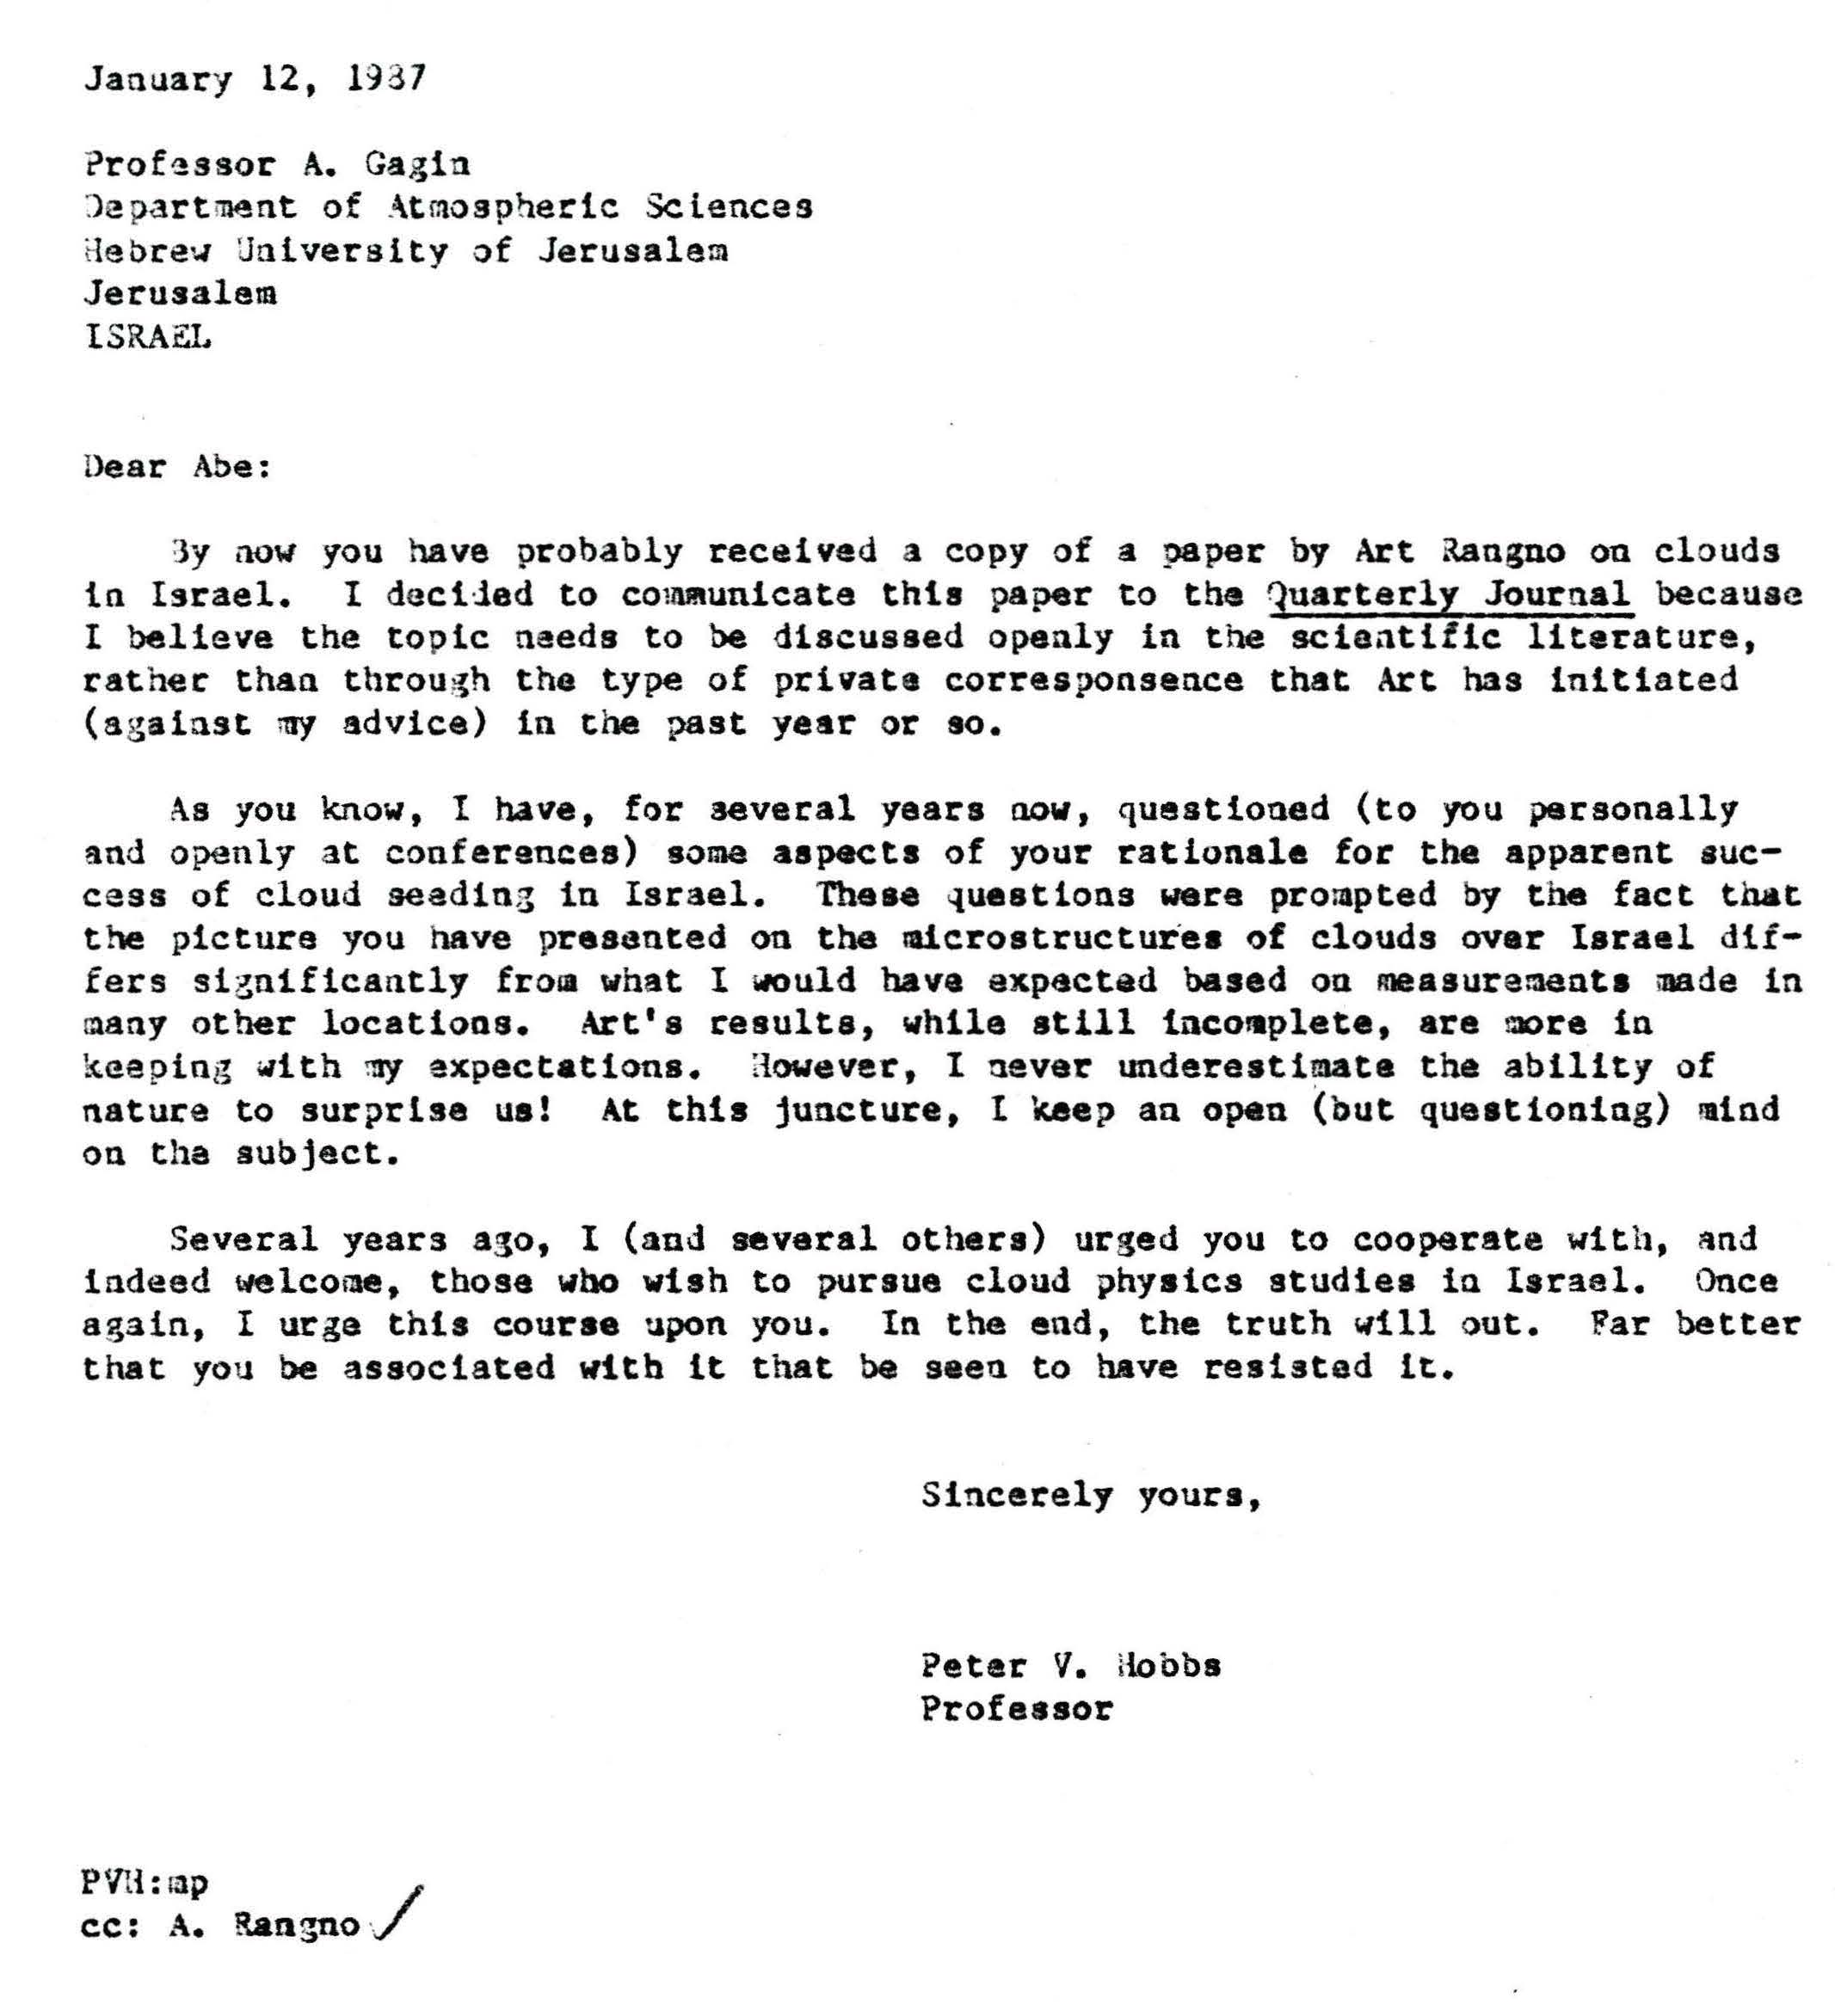
  And it may ne bogus, illusory; it seems to lead to a dead end.  Still, “we” journey on, hoping these early findings, incomplete as they are and needing to be updated, will nevertheless bring someone a Nobel Prize in meteorology.  (Also still waiting for some kind of science prize or medal from Israel for the work I’ve done there in exposing faulty cloud seeding results and descriptions of non-existent clouds supposedly ripe with seeding potential (Rangno and Hobbs 1995, Rangno 1988).  But, as the Prunes sang, I had too much to dream last night.

https://youtu.be/-xRRT92Fpgs

Let us begin this story from the beginning.  Let us explore how a gigantic amount of work, consuming work, really,  thousands of hours of personal effort, can lead to a dead end. Maybe.

The oscillation story begins in an undergraduate  climatology class I took at San Jose State College in the late 1960s.  Each of us was assigned to do a climate research project.  I chose to do something on Los Angeles Civic Center rainfall, something I had been charting since childhood.  I graphed the days with measurable rain over the period of record for the Civic Center  going back to the 1877-78 “rain season.”  In California, the period of July 1 through June 30 is deemed the “rain season.”  That was the way rainfall data were presented in the newspapers.  The California “rain season” is similar to the water year precipitation totals widely used in the western US for the period of October 1 through September 30.  If you are a meteorologist in the West, the calendar year is generally eschewed in place of rain season or water year since the latter capture the character of whole winters and better account for snowpacks in mountains.

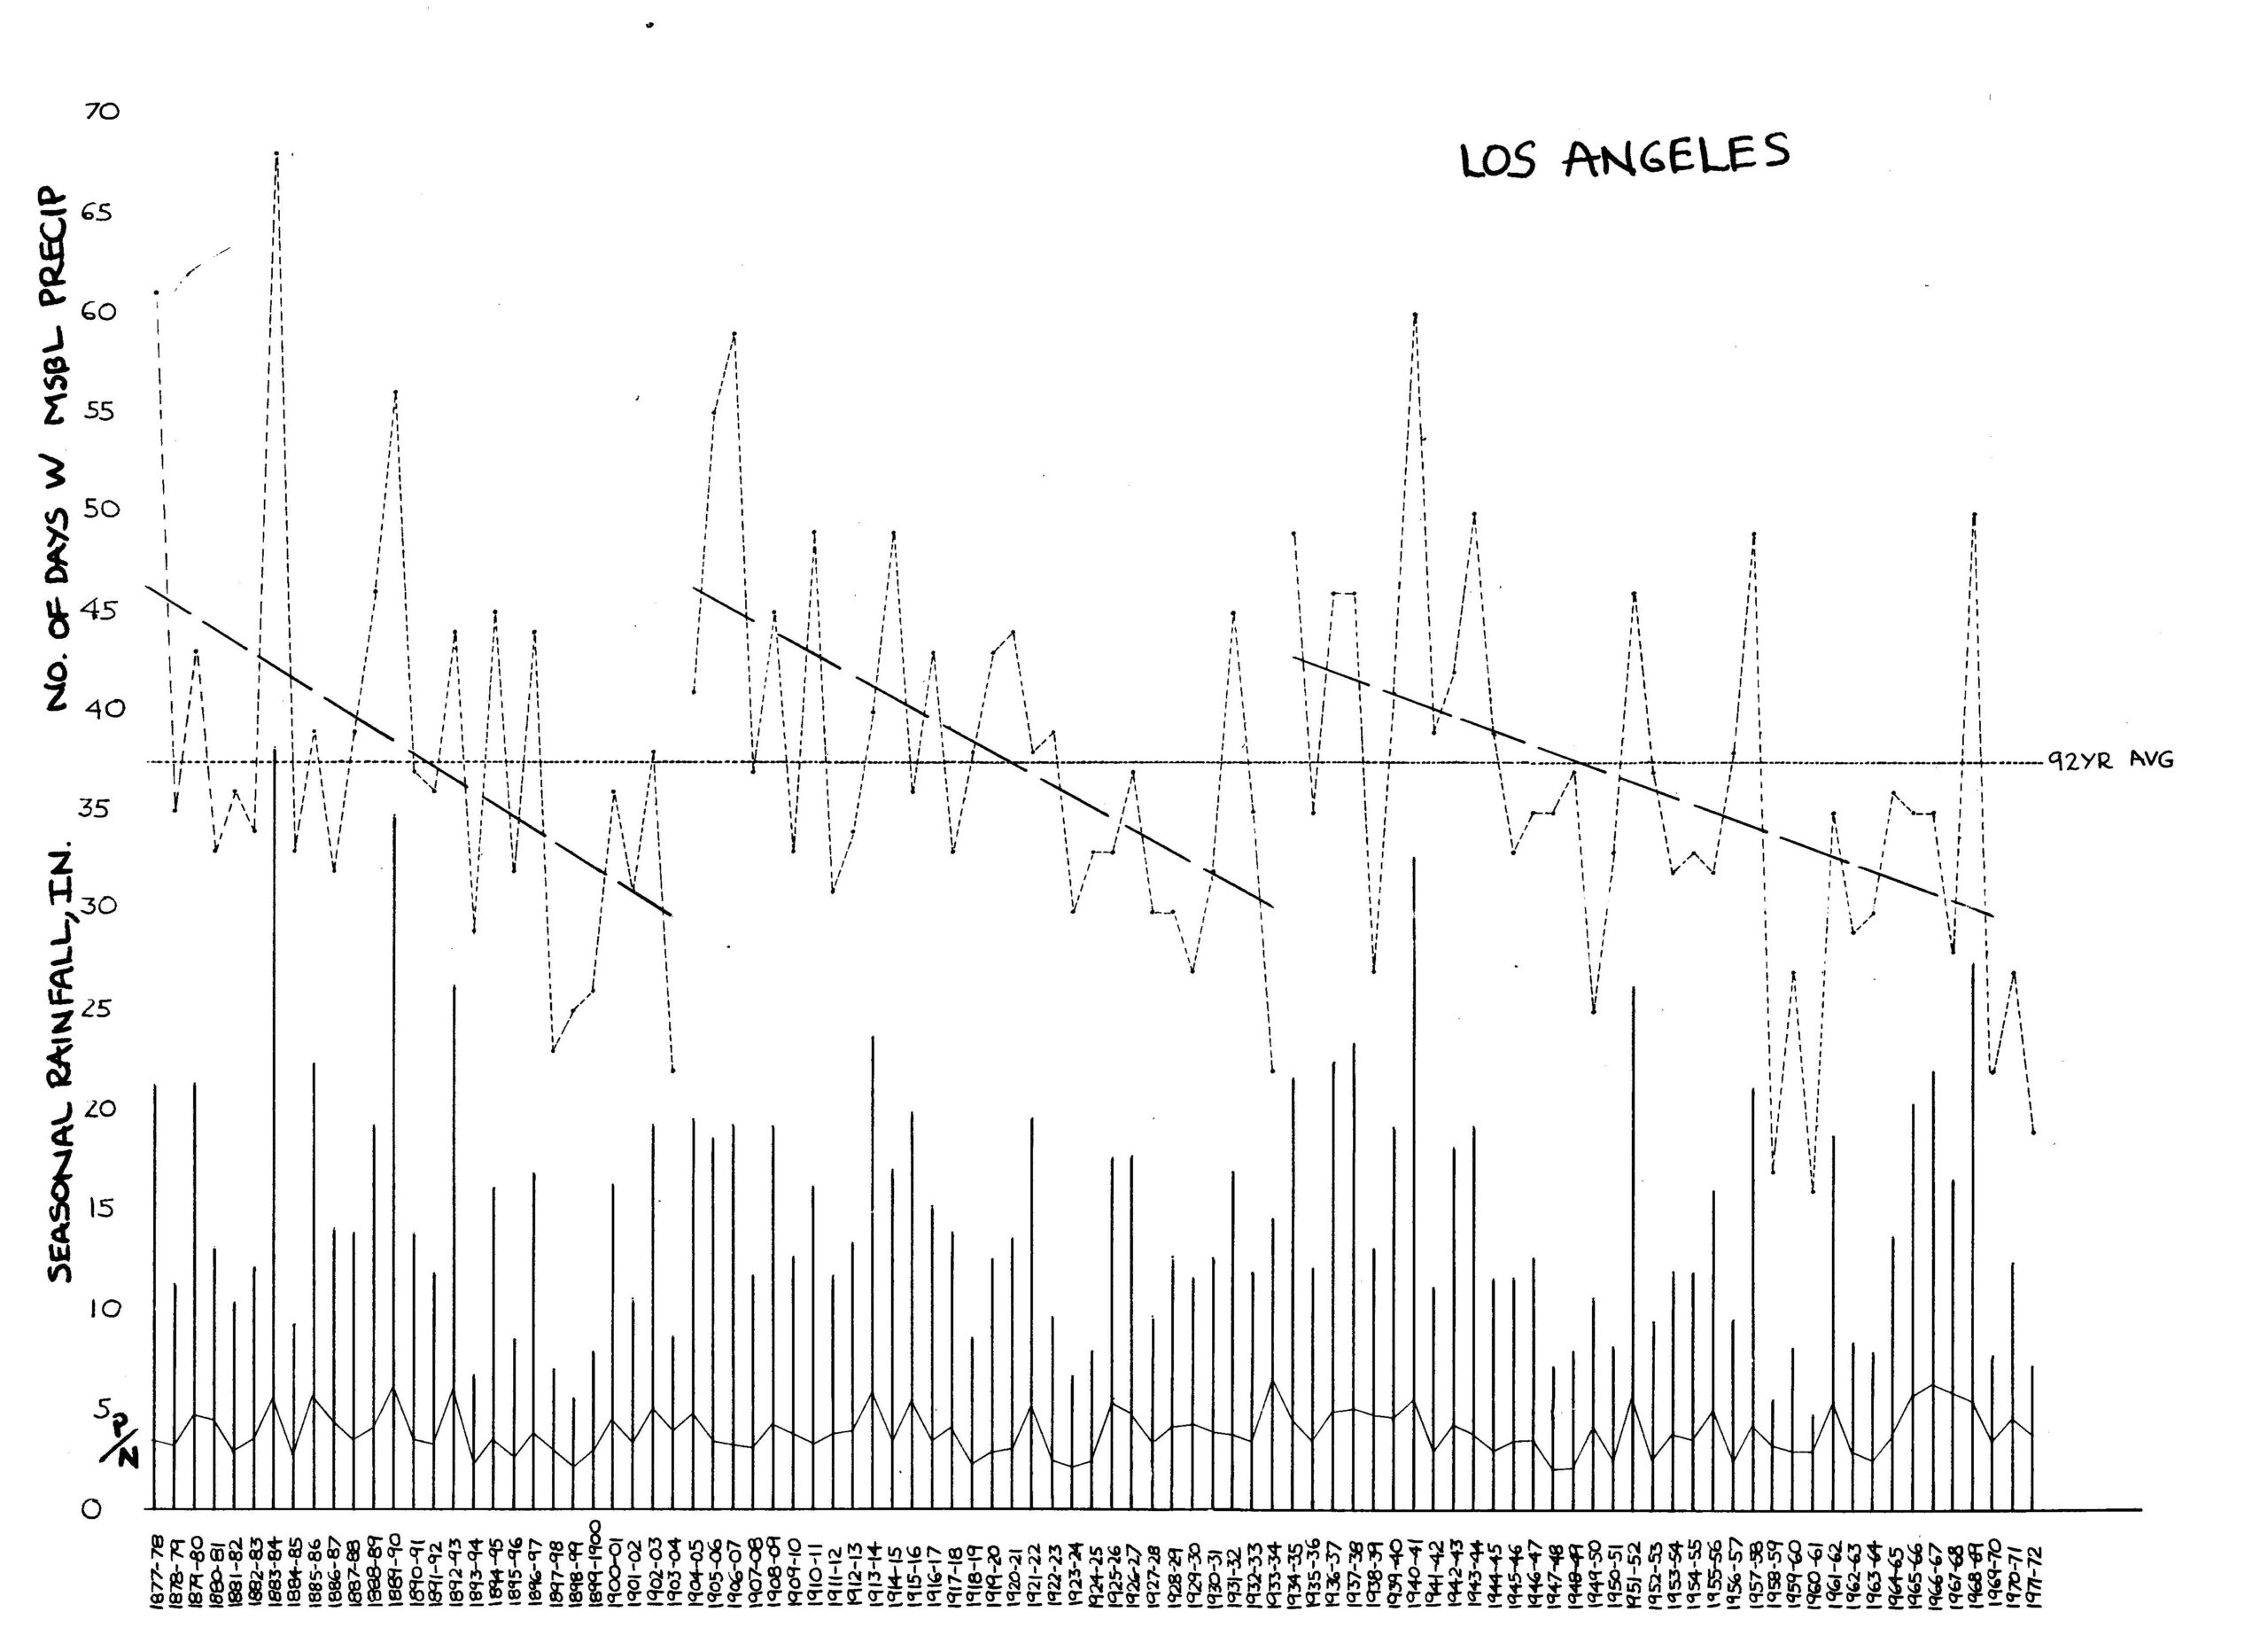
I saw an interesting phenomenon in the plot of days with measurable rain; there appeared to be an “instability”; a jump to much wetter conditions after a decades long trend of declining days with measurable rain. After reaching what appeared to a minimum of days with measurable rain, there was a  sudden jump in the next season to one having considerably more than the average.  But, it wasn’t just one season that had many more days with rain!  It was most of the next ten rain seasons that had above average days with rain.  This had happened in my plot on three occasions; the season following 1903-04, the season following 1933-34, and lastly, the season following 1976-77.  Namely, it wasn’t just a one-shot wonder, a season long singularity.

I was EXCITED!  So excited I eventually sent my Los Angeles Civic Center plot to a famous professor of climate and weather at Scripps Institution of Oceanography, Prof. Jerome Namias. I had read his papers in the Monthly Weather Review.  (I had begun subscribing to this journal when I was 13 years old. By this time I had seen that these same three jumps had occurred at San Luis Obispo, Santa Barbara, and San Diego.  There was no evidence of this phenomenon at San Francisco; it faded to the north.

If you’re a Los Angeles or Southern California “precipophile” like me, you might well guess immediately why I wasn’t so much interested in rain totals as with days with measurable rain.  A couple of huge storms can hide the character of a whole rain season, but the character of a rain season would be called out by days with rain.  An extreme example:  on New Year’s Eve, December 1933 into New Year’s Day, 1934, Los Angeles received it’s greatest 24 h rainfall:  7.36 inches!  Approximately half fell in December 1933 and a little more than half in January 1934.   The season’s rainfall total that year was 14.64 inches, or just about average.  HOWEVER, the DAYS with rain was two standard deviations below average! That’s “what done it” for me, that extraordinary rain day and why rain totals might hide the real character of a winter’s rain season.

Naturally, there is pretty high correlation between the days with measurable rain and the season’s total.  But from day one, I was convinced that the days with measurable rain was a better indicator of circulation changes over the years while rain amounts added “noise.”  Here is the correlation between rain amounts and days with rain for Los Angeles Civic Center:

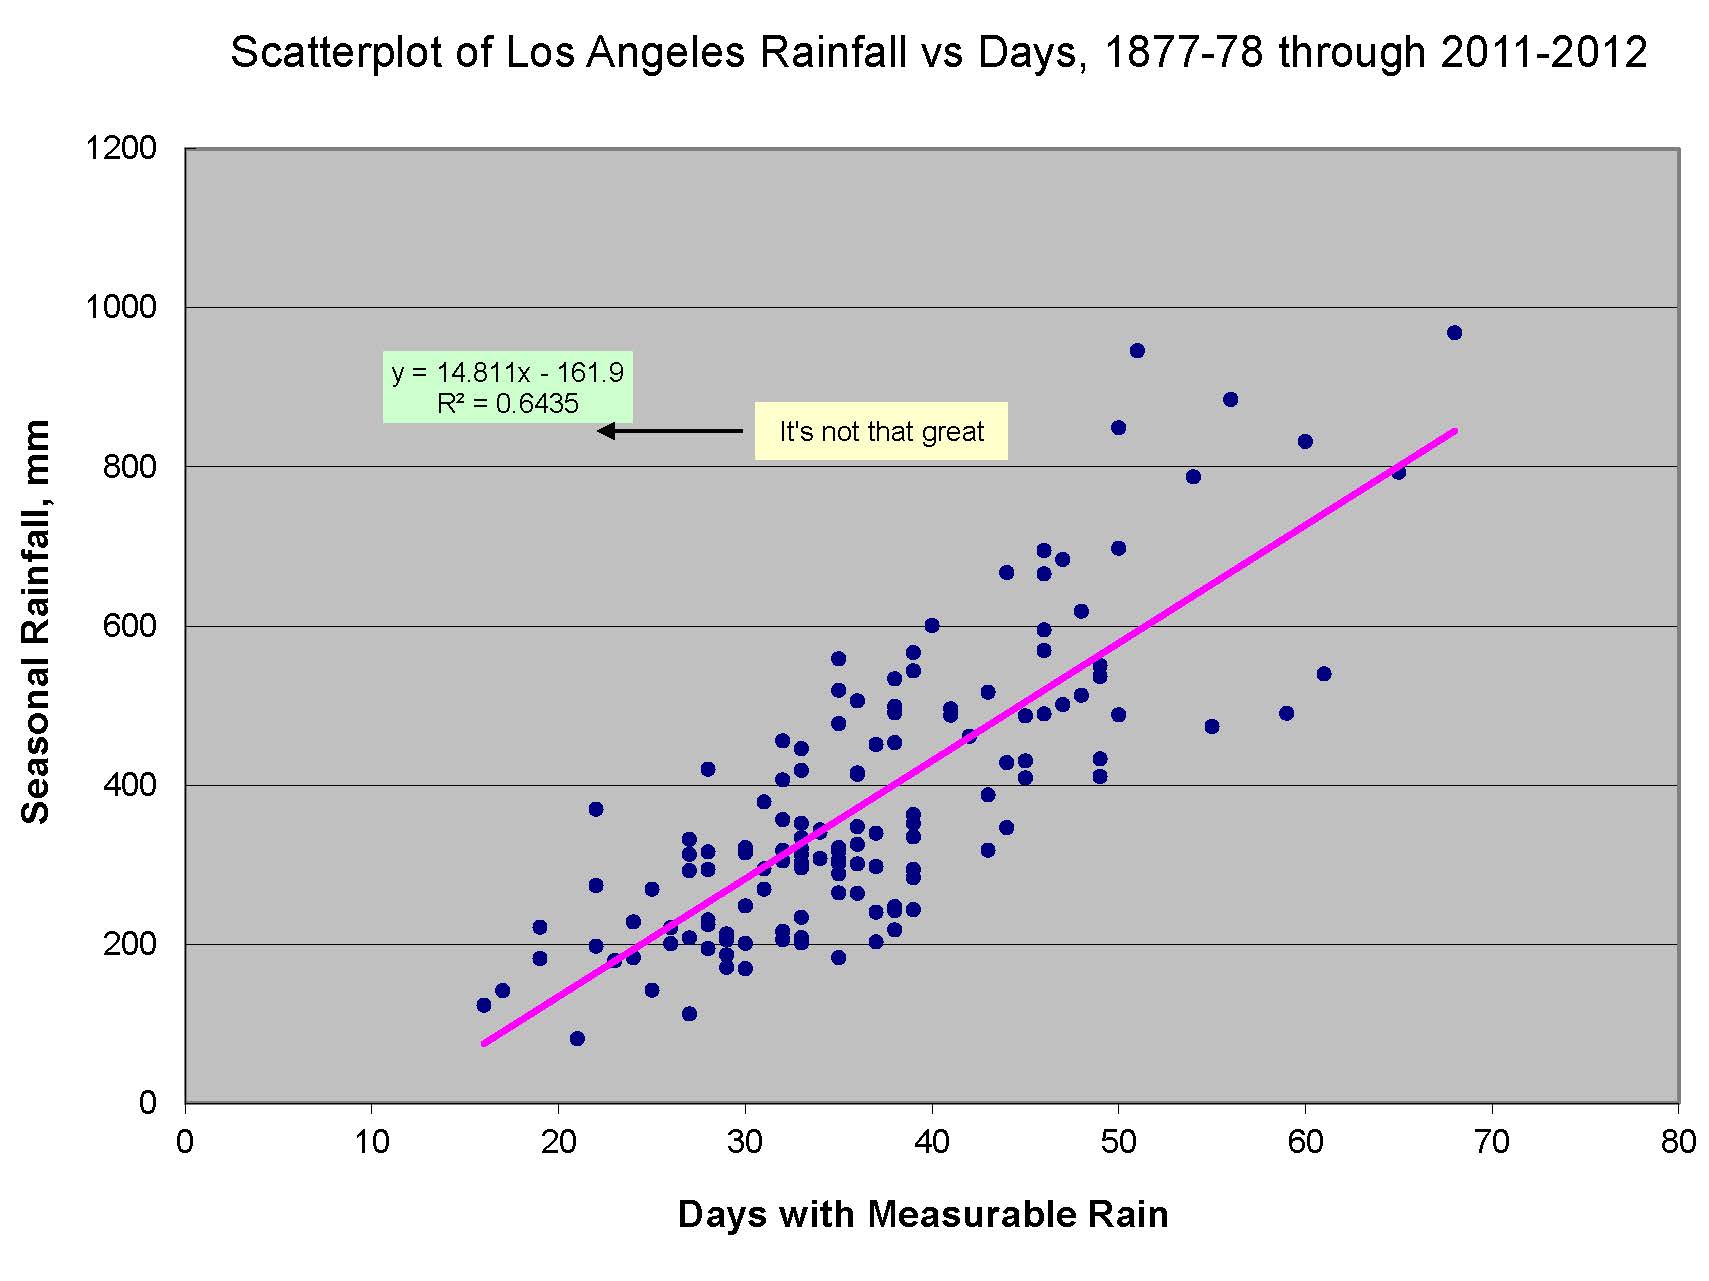
Professor Jerome Namias seemed to be excited, too.  Here is his reply to my graph of LA rain frequency over the period of record.

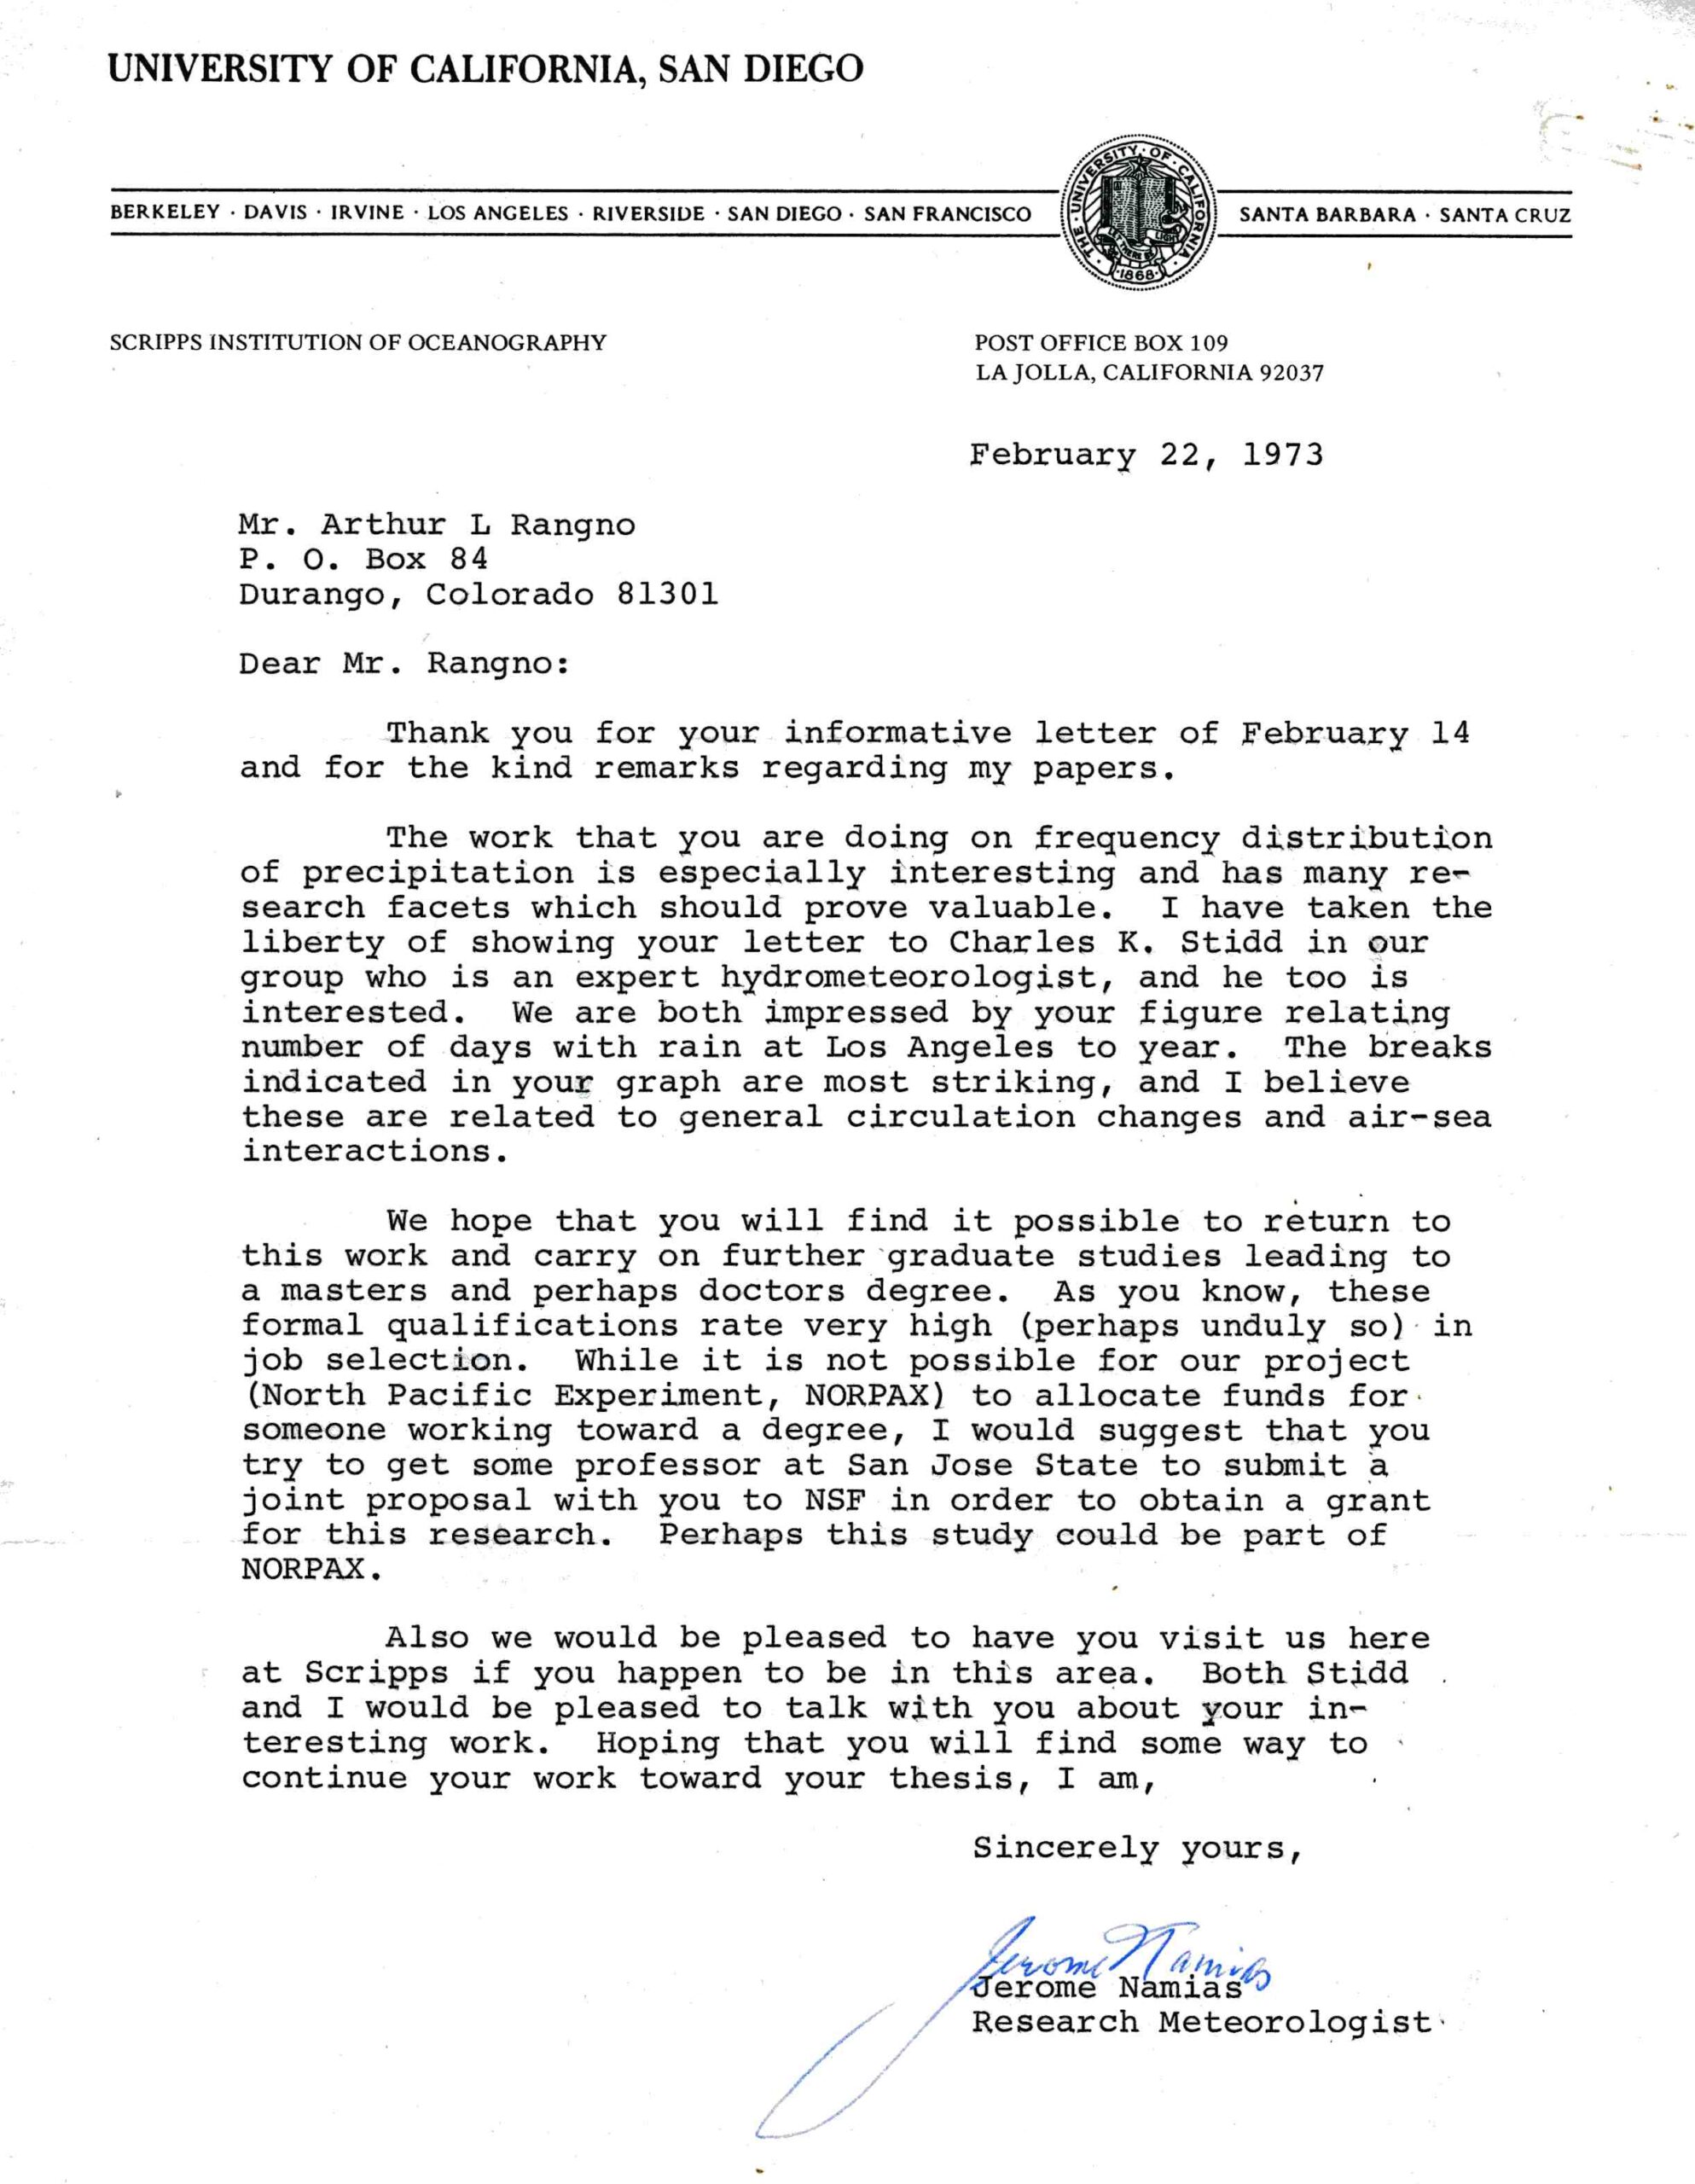
Here’s the plot that started it all and that Namias and Stidd found interesting.  It didn’t look like “white noise.”

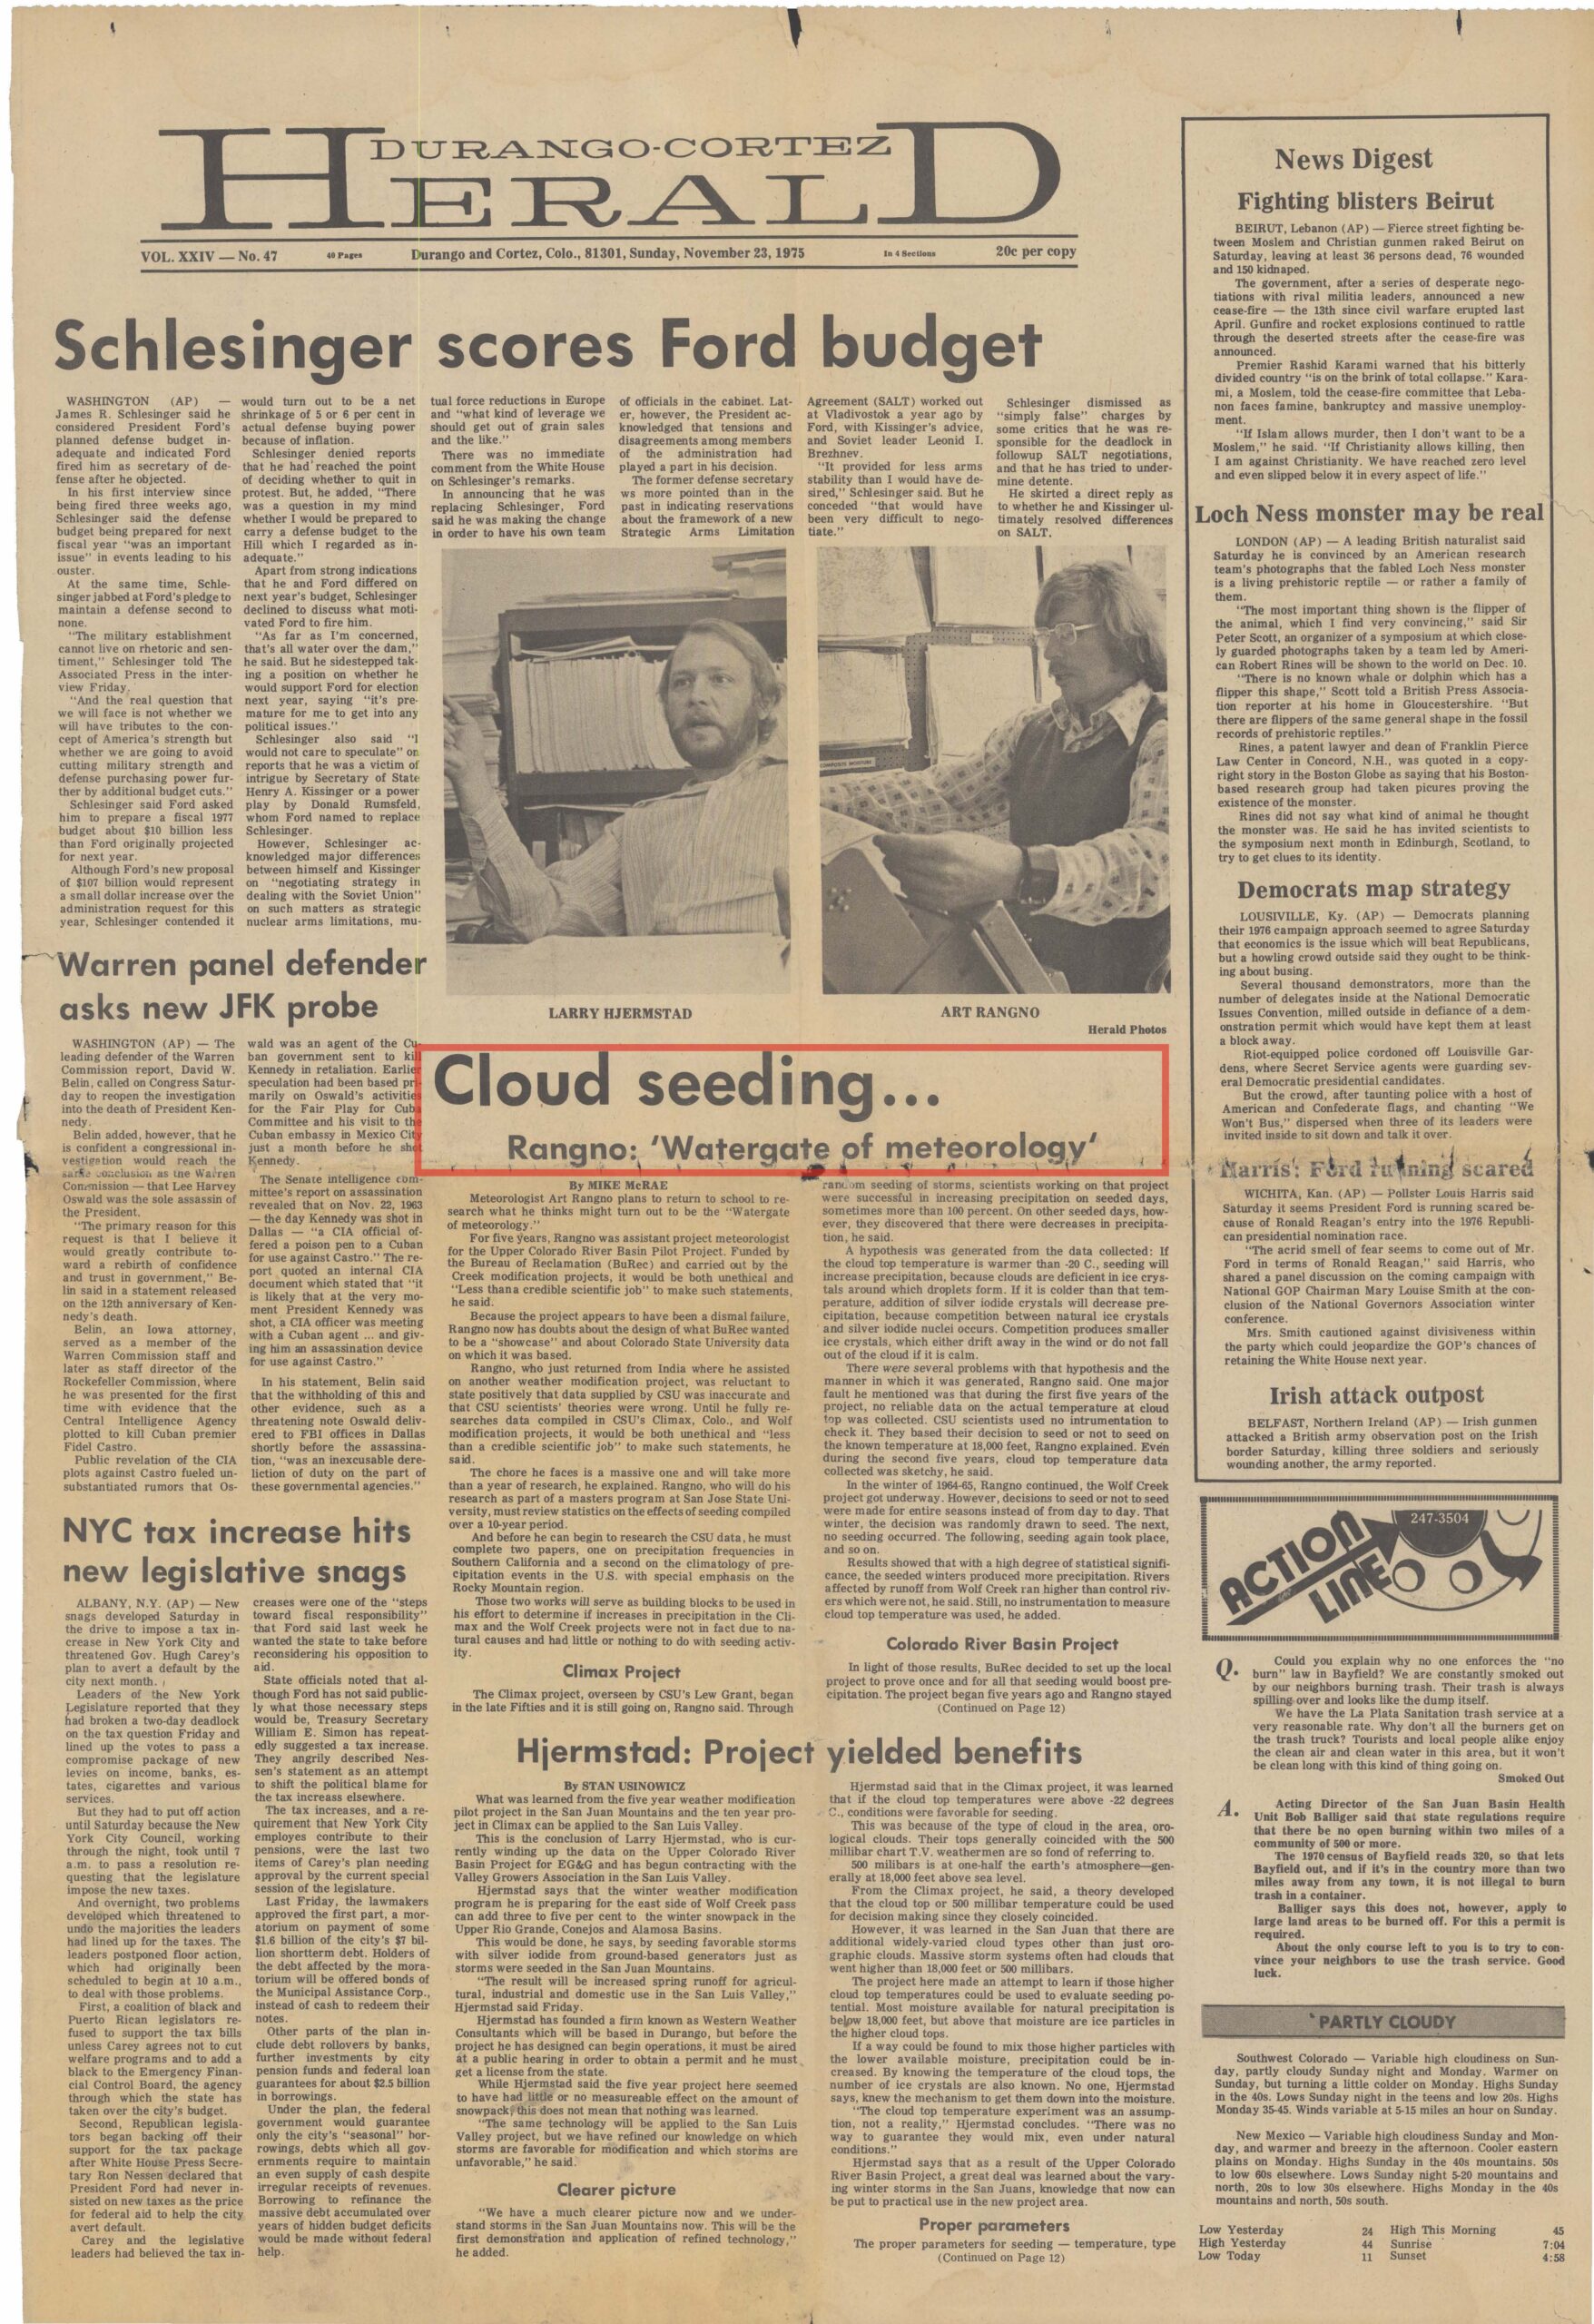
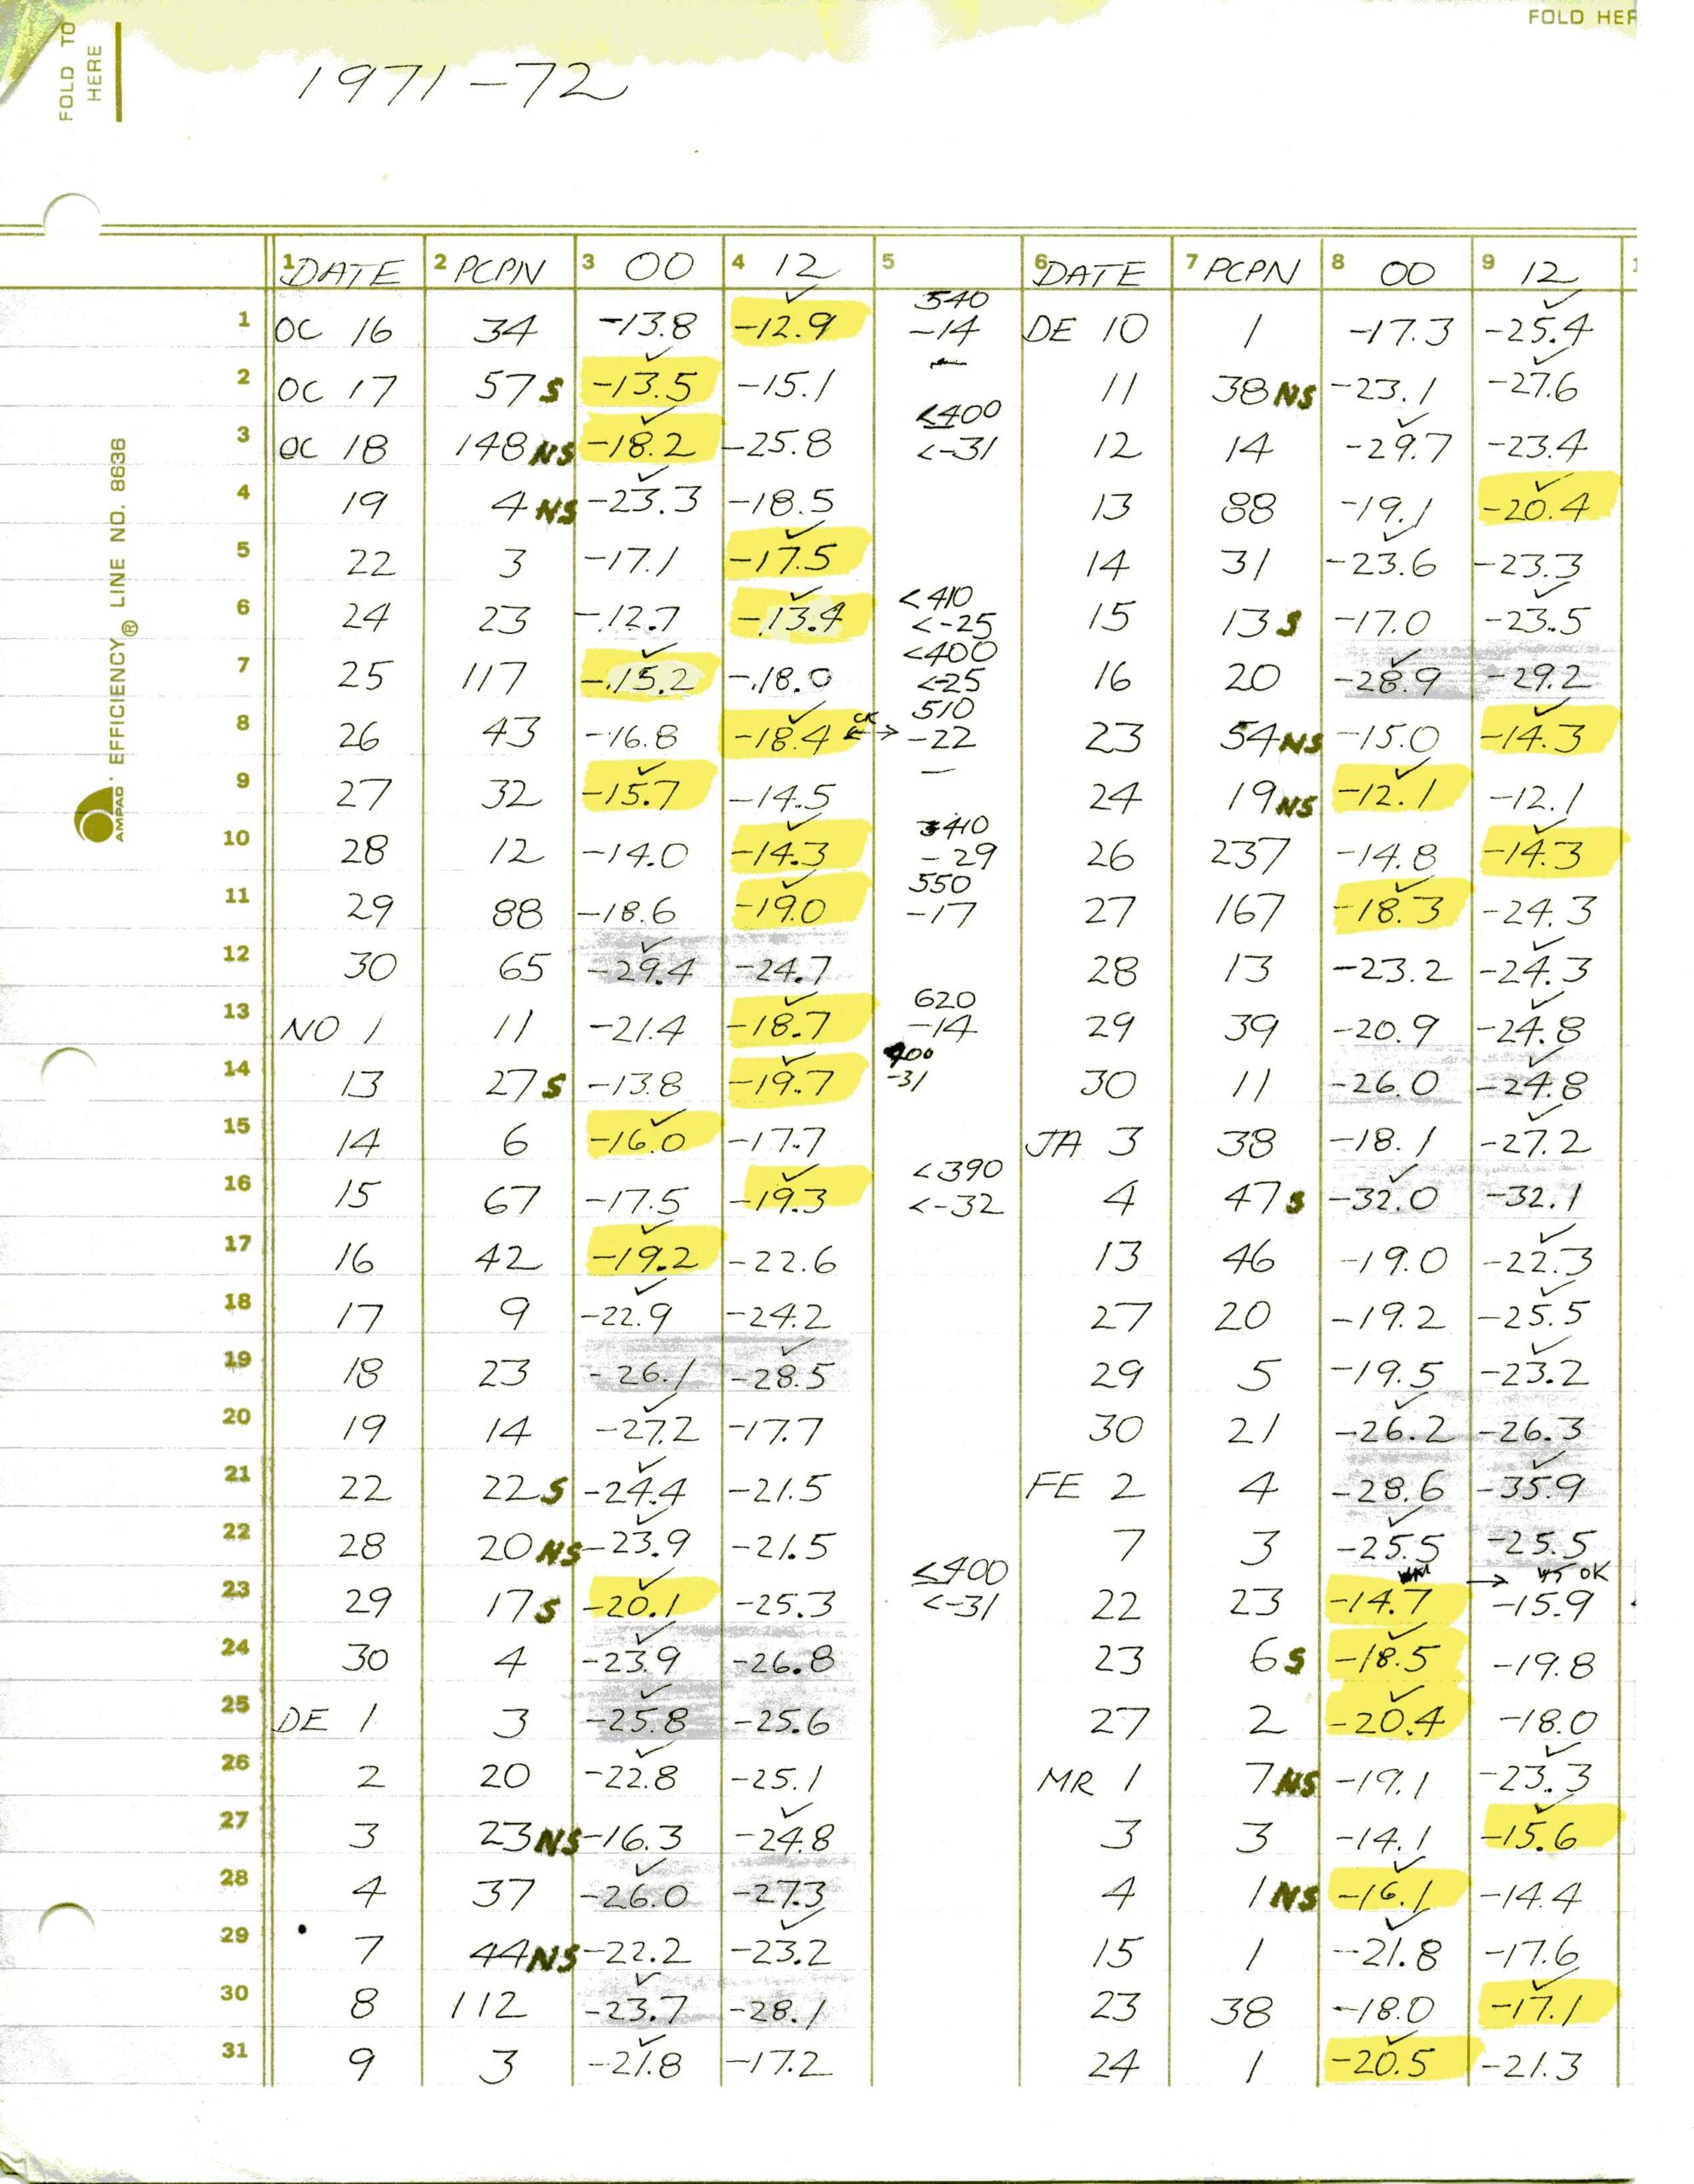
By the time I corresponded with Professor Namias, I had been hired as the Assistant Project Forecaster for the nation’s largest randomized orographic cloud seeding experiment, the Colorado River Basin Pilot Project.   I was living in Durango, CO, where the project’s headquarters were as I continued my research on a possible oscillation.

I was hoping that my work would eventually qualify as a Master’s Thesis from the meteorology department at San Jose State College (despite poor grades in grad school).  As an aside to the reader: I had no business whatsoever in being in grad school taking classes like “numerical methods,” “advanced hydrodynamics.” etc.  But I loved my campus life in those days of campus trash cans set on fire to protest the war, album protest rock, the marches, the demonstrations, the be-ins, the draft card burnings, to pinch a quote from National Lampoon’s “Bob Dylan’s Golden Protest” parody:

Over the next couple of years I added to my Los Angeles dataset with ones from San Francisco, San Luis Obispo, Santa Barbara, and San Diego.  These stations all had records that went back even earlier than the one at Los Angeles.  All but San Francisco, whose record exhibited what one might call, “white noise,” exhibited the trend I had seen in the Los Angeles record!  It was amazing to see.
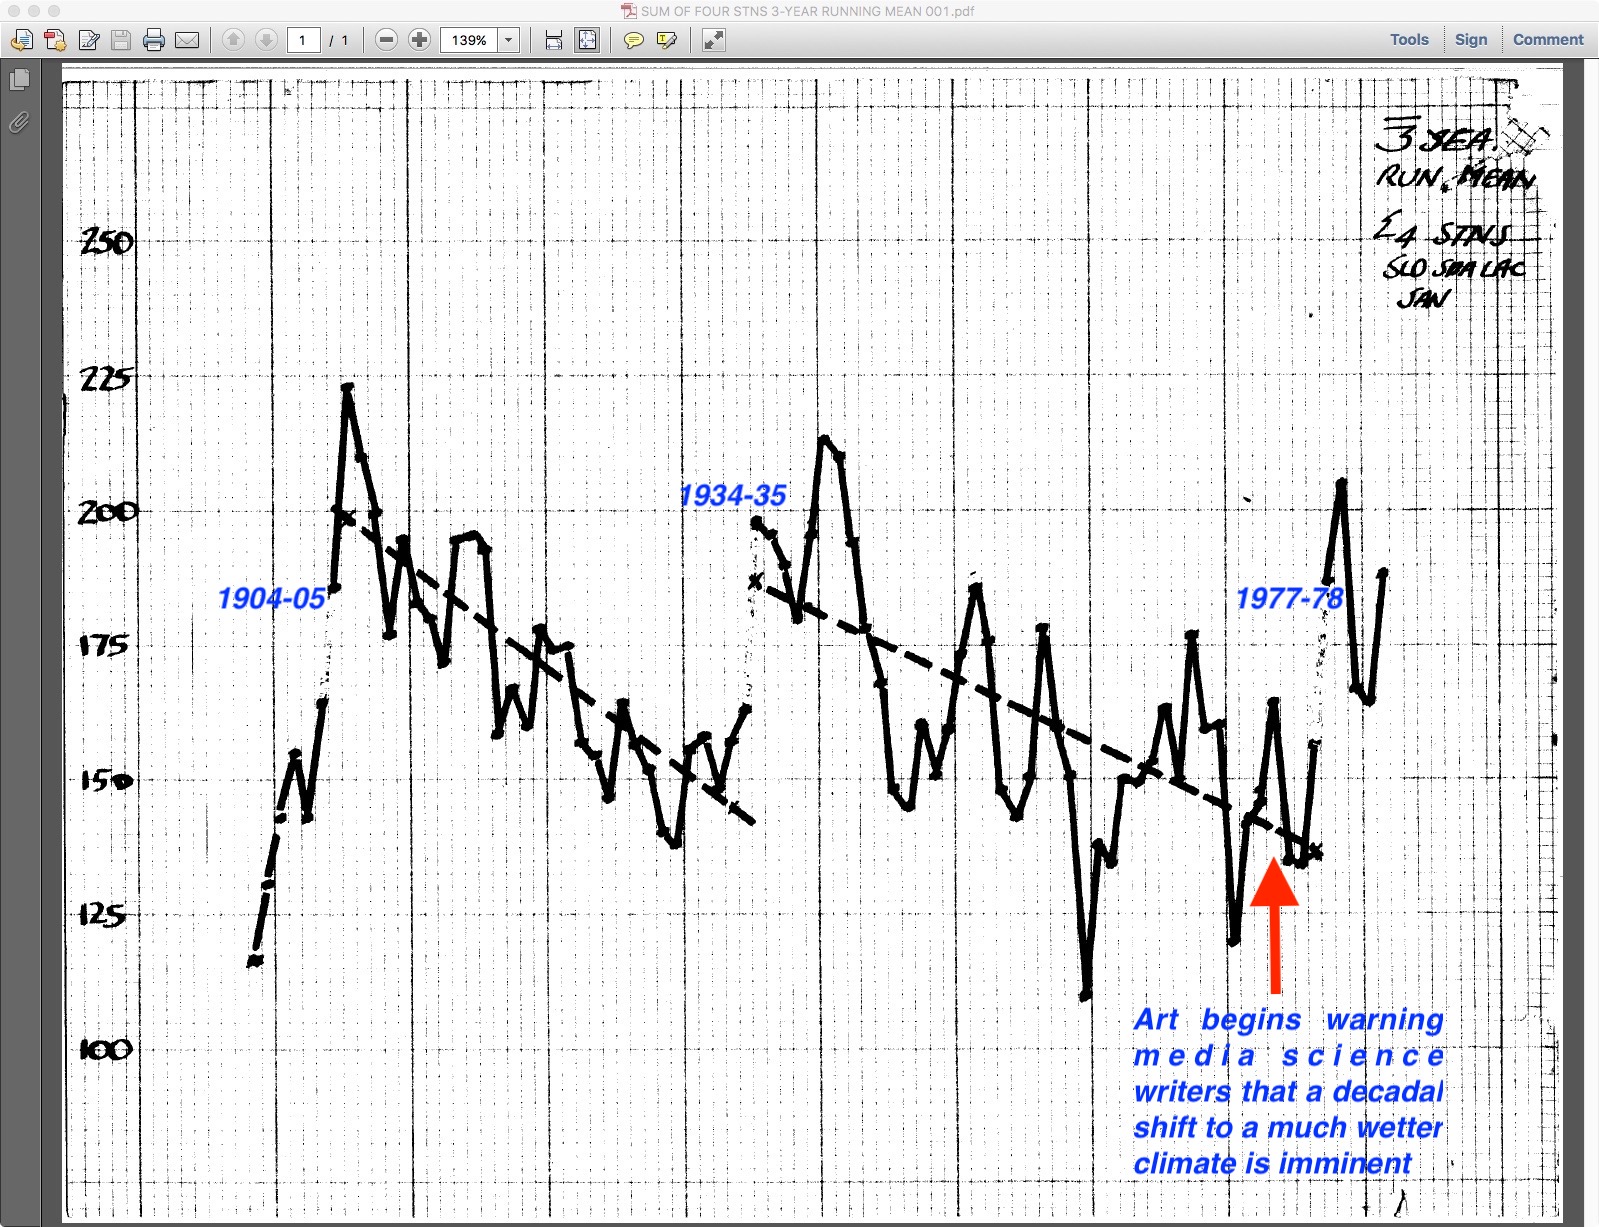
Below is a running, 3-season average for SLO, SBA, LAC, and SAN through the early 1980s.  Sadly, I was not paying attention when scanning this original diagram and parts are not shown here, such as the abscissa comprised of the rain seasons.  The ordinate is the number of days with measurable rain at these four stations with a running mean of 3 seasons of those totals.  It ends with the 1981-82 season, far right.  For those in the know, the following season,  1982-83 featured a giant El Niño and that, combined with whatever was going on in what I was charting,  produced numbers of days off the chart!  I was so happy!  The Great Salt Lake was about to overflow, too, from this incredible wet spell that accompanied the shift to a more frequently rainy regime.

Since the rain at these locations is associated with cold troughs in the wintertime westerlies, I imagined that the circumpolar westerlies gradually retracted over the years, then hit some kind of tipping point and sprung back to more a more southerly latitude before beginning the same slow retraction over decades.

In the 1950s and 1960s,  the Los Angeles forecast office used the 564 decameter geopotential height contour as a divider of rain; heights at or below that contour was where the rain was and no rain was the rule for heights greater than the 564 decameter contour.   This key contour was used as an aid in forecasting rain as troughs approached and entered California.

The last shift to wetter conditions I found happened after the 1976-77 rain season.  With the 1977-78 rain season, it became much more frequently rainy along the central and Southern California coast for most of the next seven years.

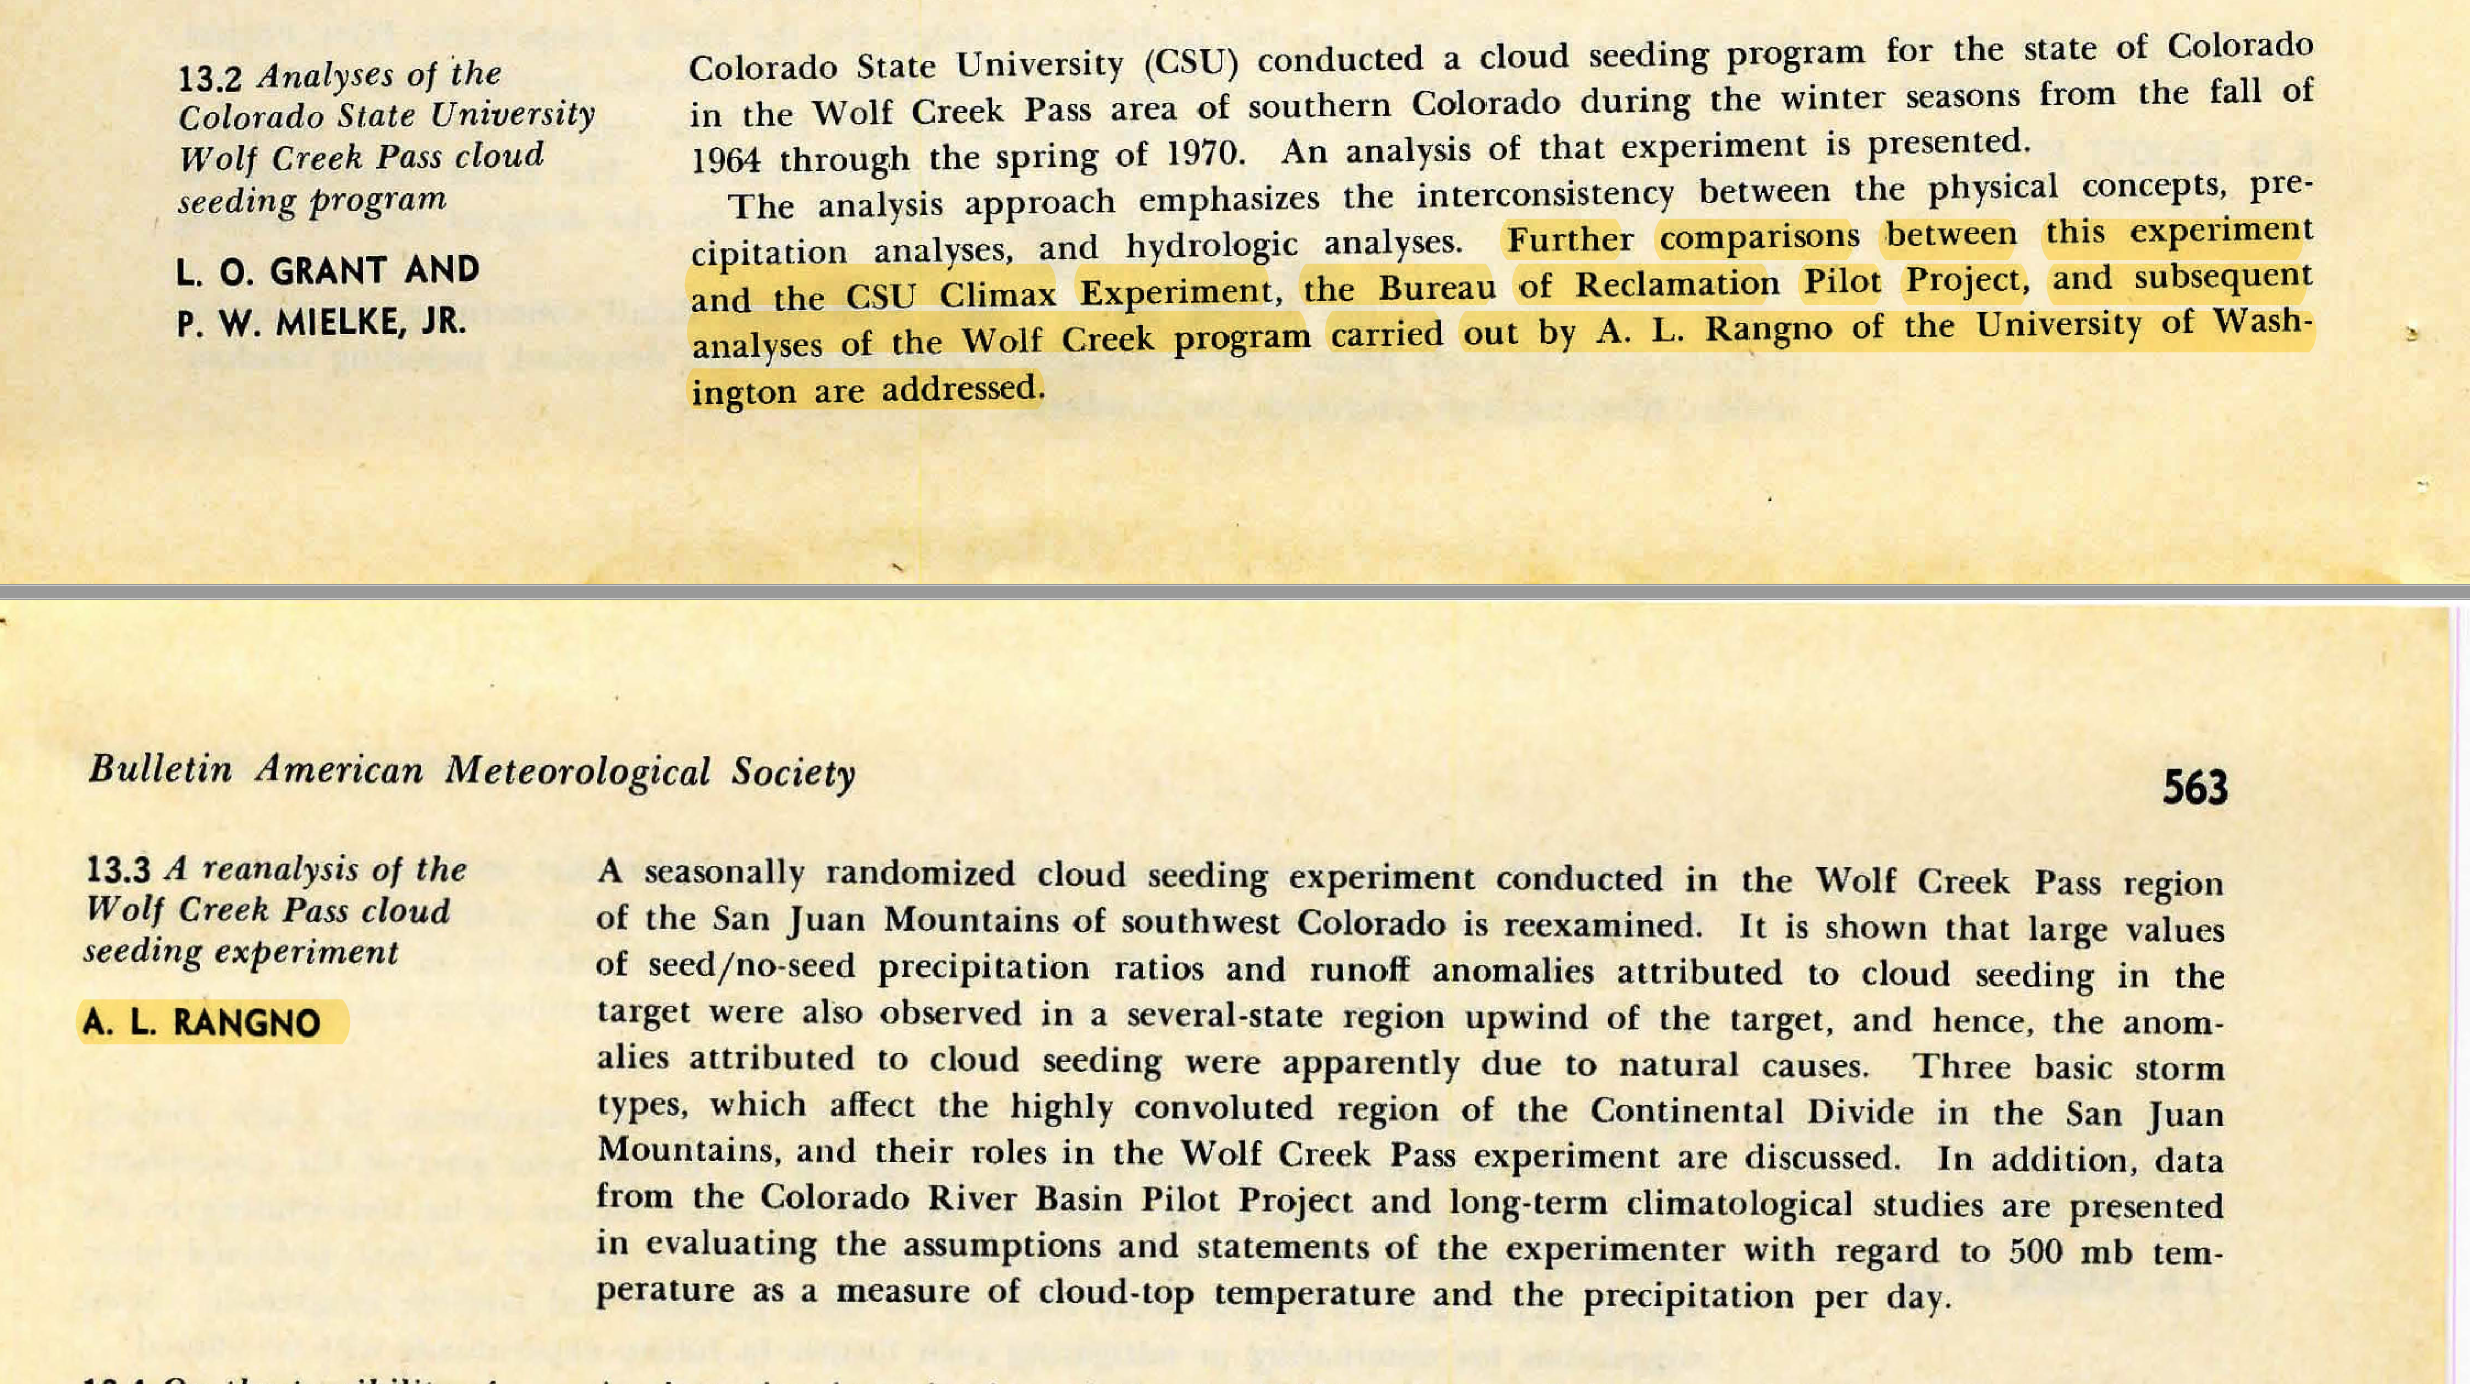
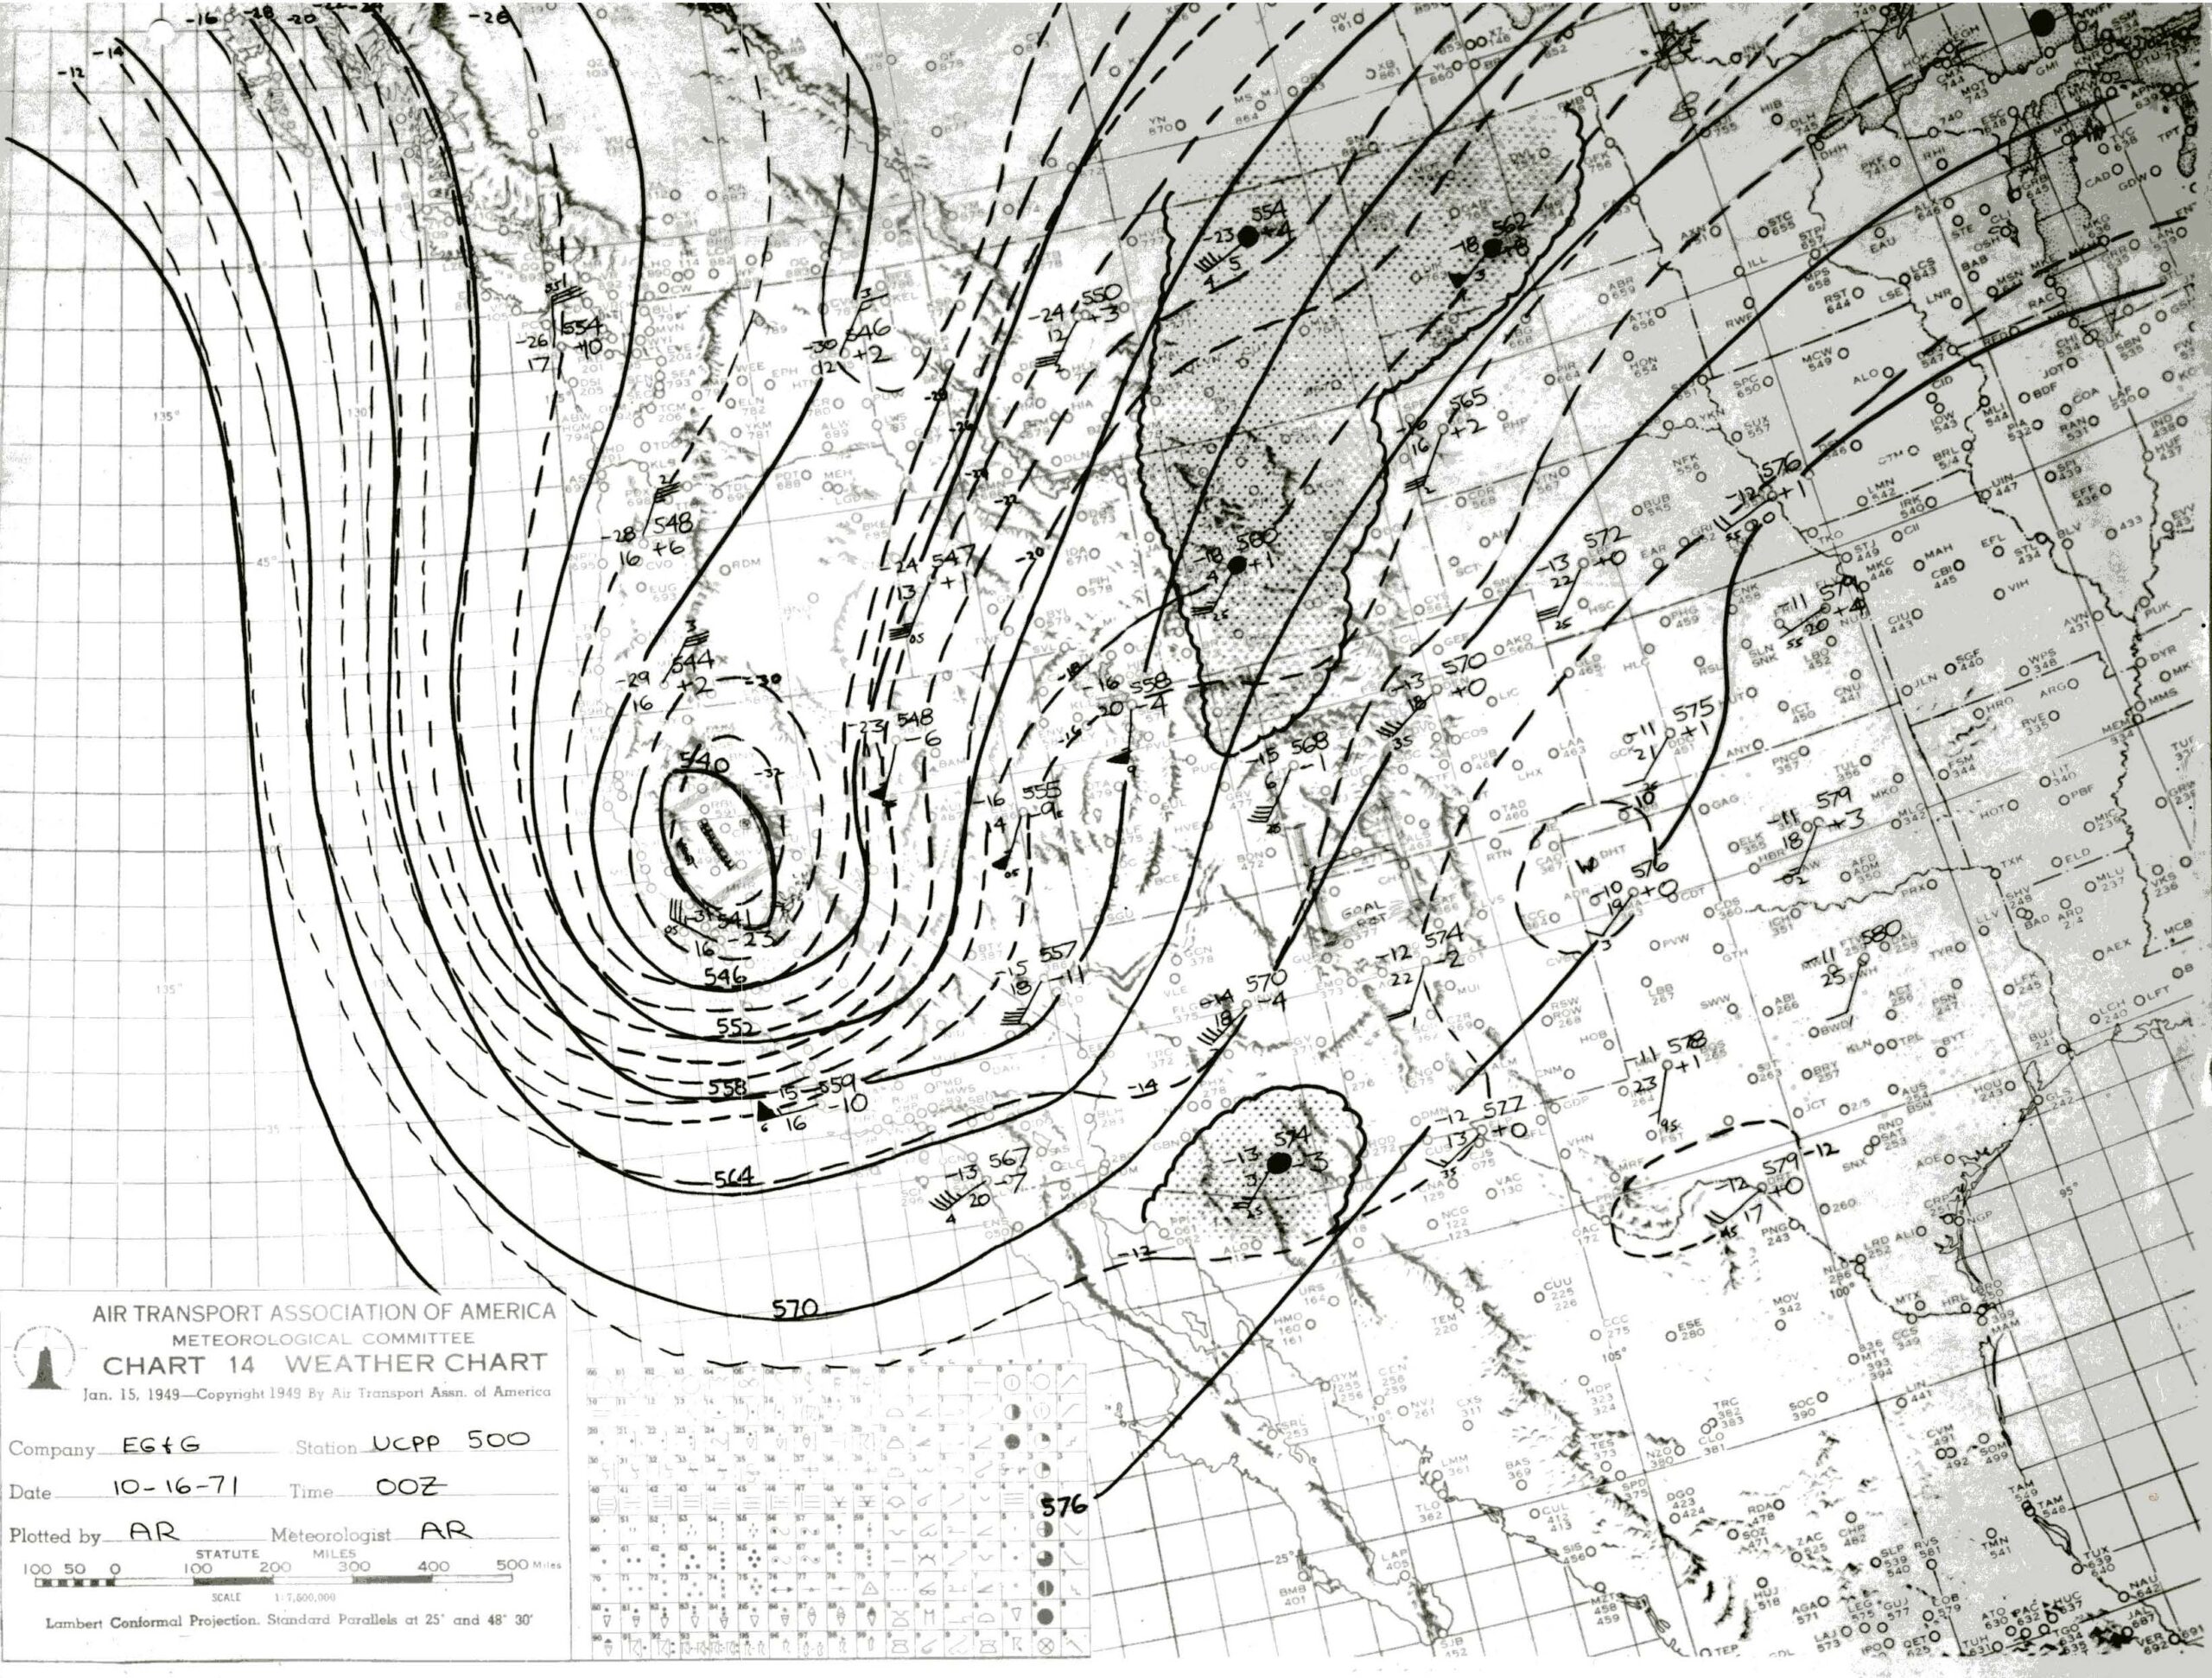
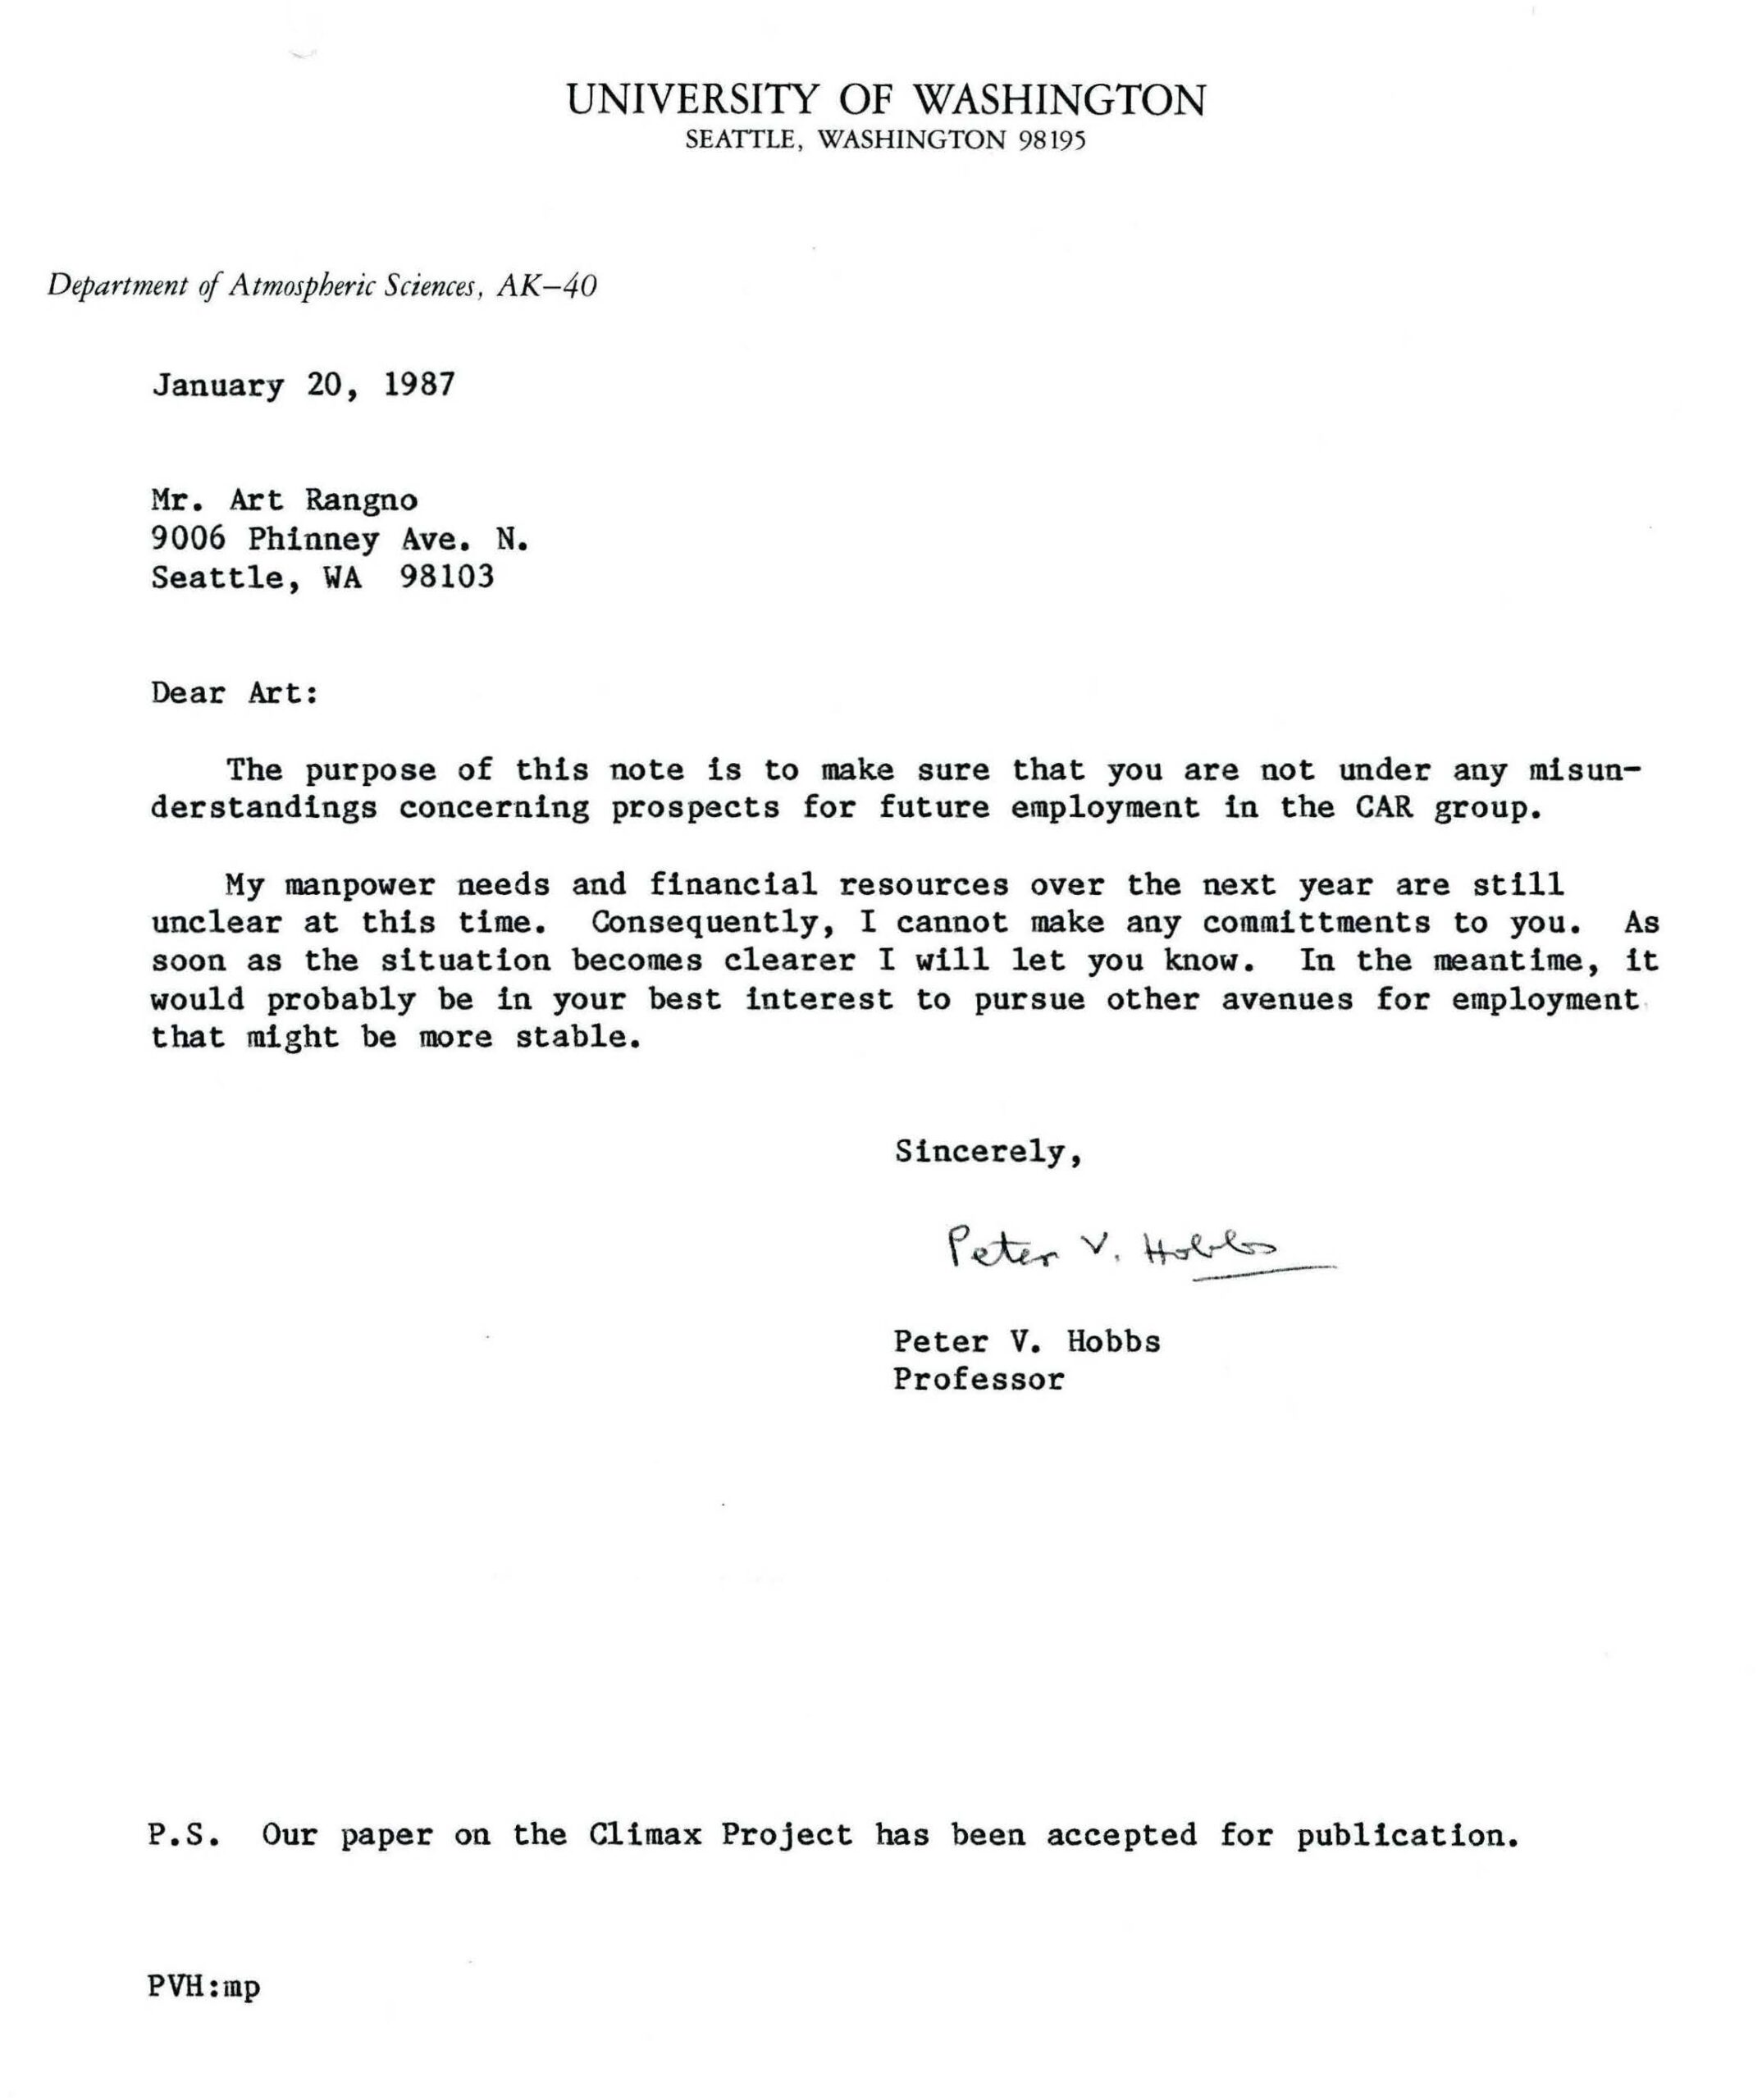
My California rainfall study ended a few years into this transition to wetter conditions due to two elements:  1) NOAA had stopped publishing the “Daily Series, Synoptic Weather Maps, Part 1, Northern Hemisphere Sea-Level and 500 mb Charts and 2) I got very upset over the misleading cloud seeding literature that was being published in journals and jumped ship into reanalyzing previously published cloud seeding literature for most of the rest of my career almost solely on my own time (e.g., Rangno 1979, Hobbs and Rangno 1979, Rangno and Hobbs 1995).

The NOAA surface and 500 mb charts were important because that’s what I had used to track cyclones across the Pacific for five winter seasons before and after a “shift.”   I wasn’t able to do a set of tracks before and after the 1977-78 shift.  It was interesting that about 20 years later, the 1977-78 shift I was studying was discovered as the, “Pacific Decadal Oscillation”  (Wallace et al. 1994).

By the 1973-74 rain season I was so sure a prolonged shift to wetter conditions in the SW was on the doorstep that I was writing to the LA Times science writer, George Getz, the BuRec’s PR person, Hunter Holloway (the BuRec was the sponsor of the cloud seeding experiment I worked on), and to the Durango Herald about this coming shift to wetter conditions.

I was a little too early; the downward trend continued through the 1976-77 winter.  Here’s an example of those writings, one an audacious, self-written “news release” that follows the letter to Mr. Holloway shown here:

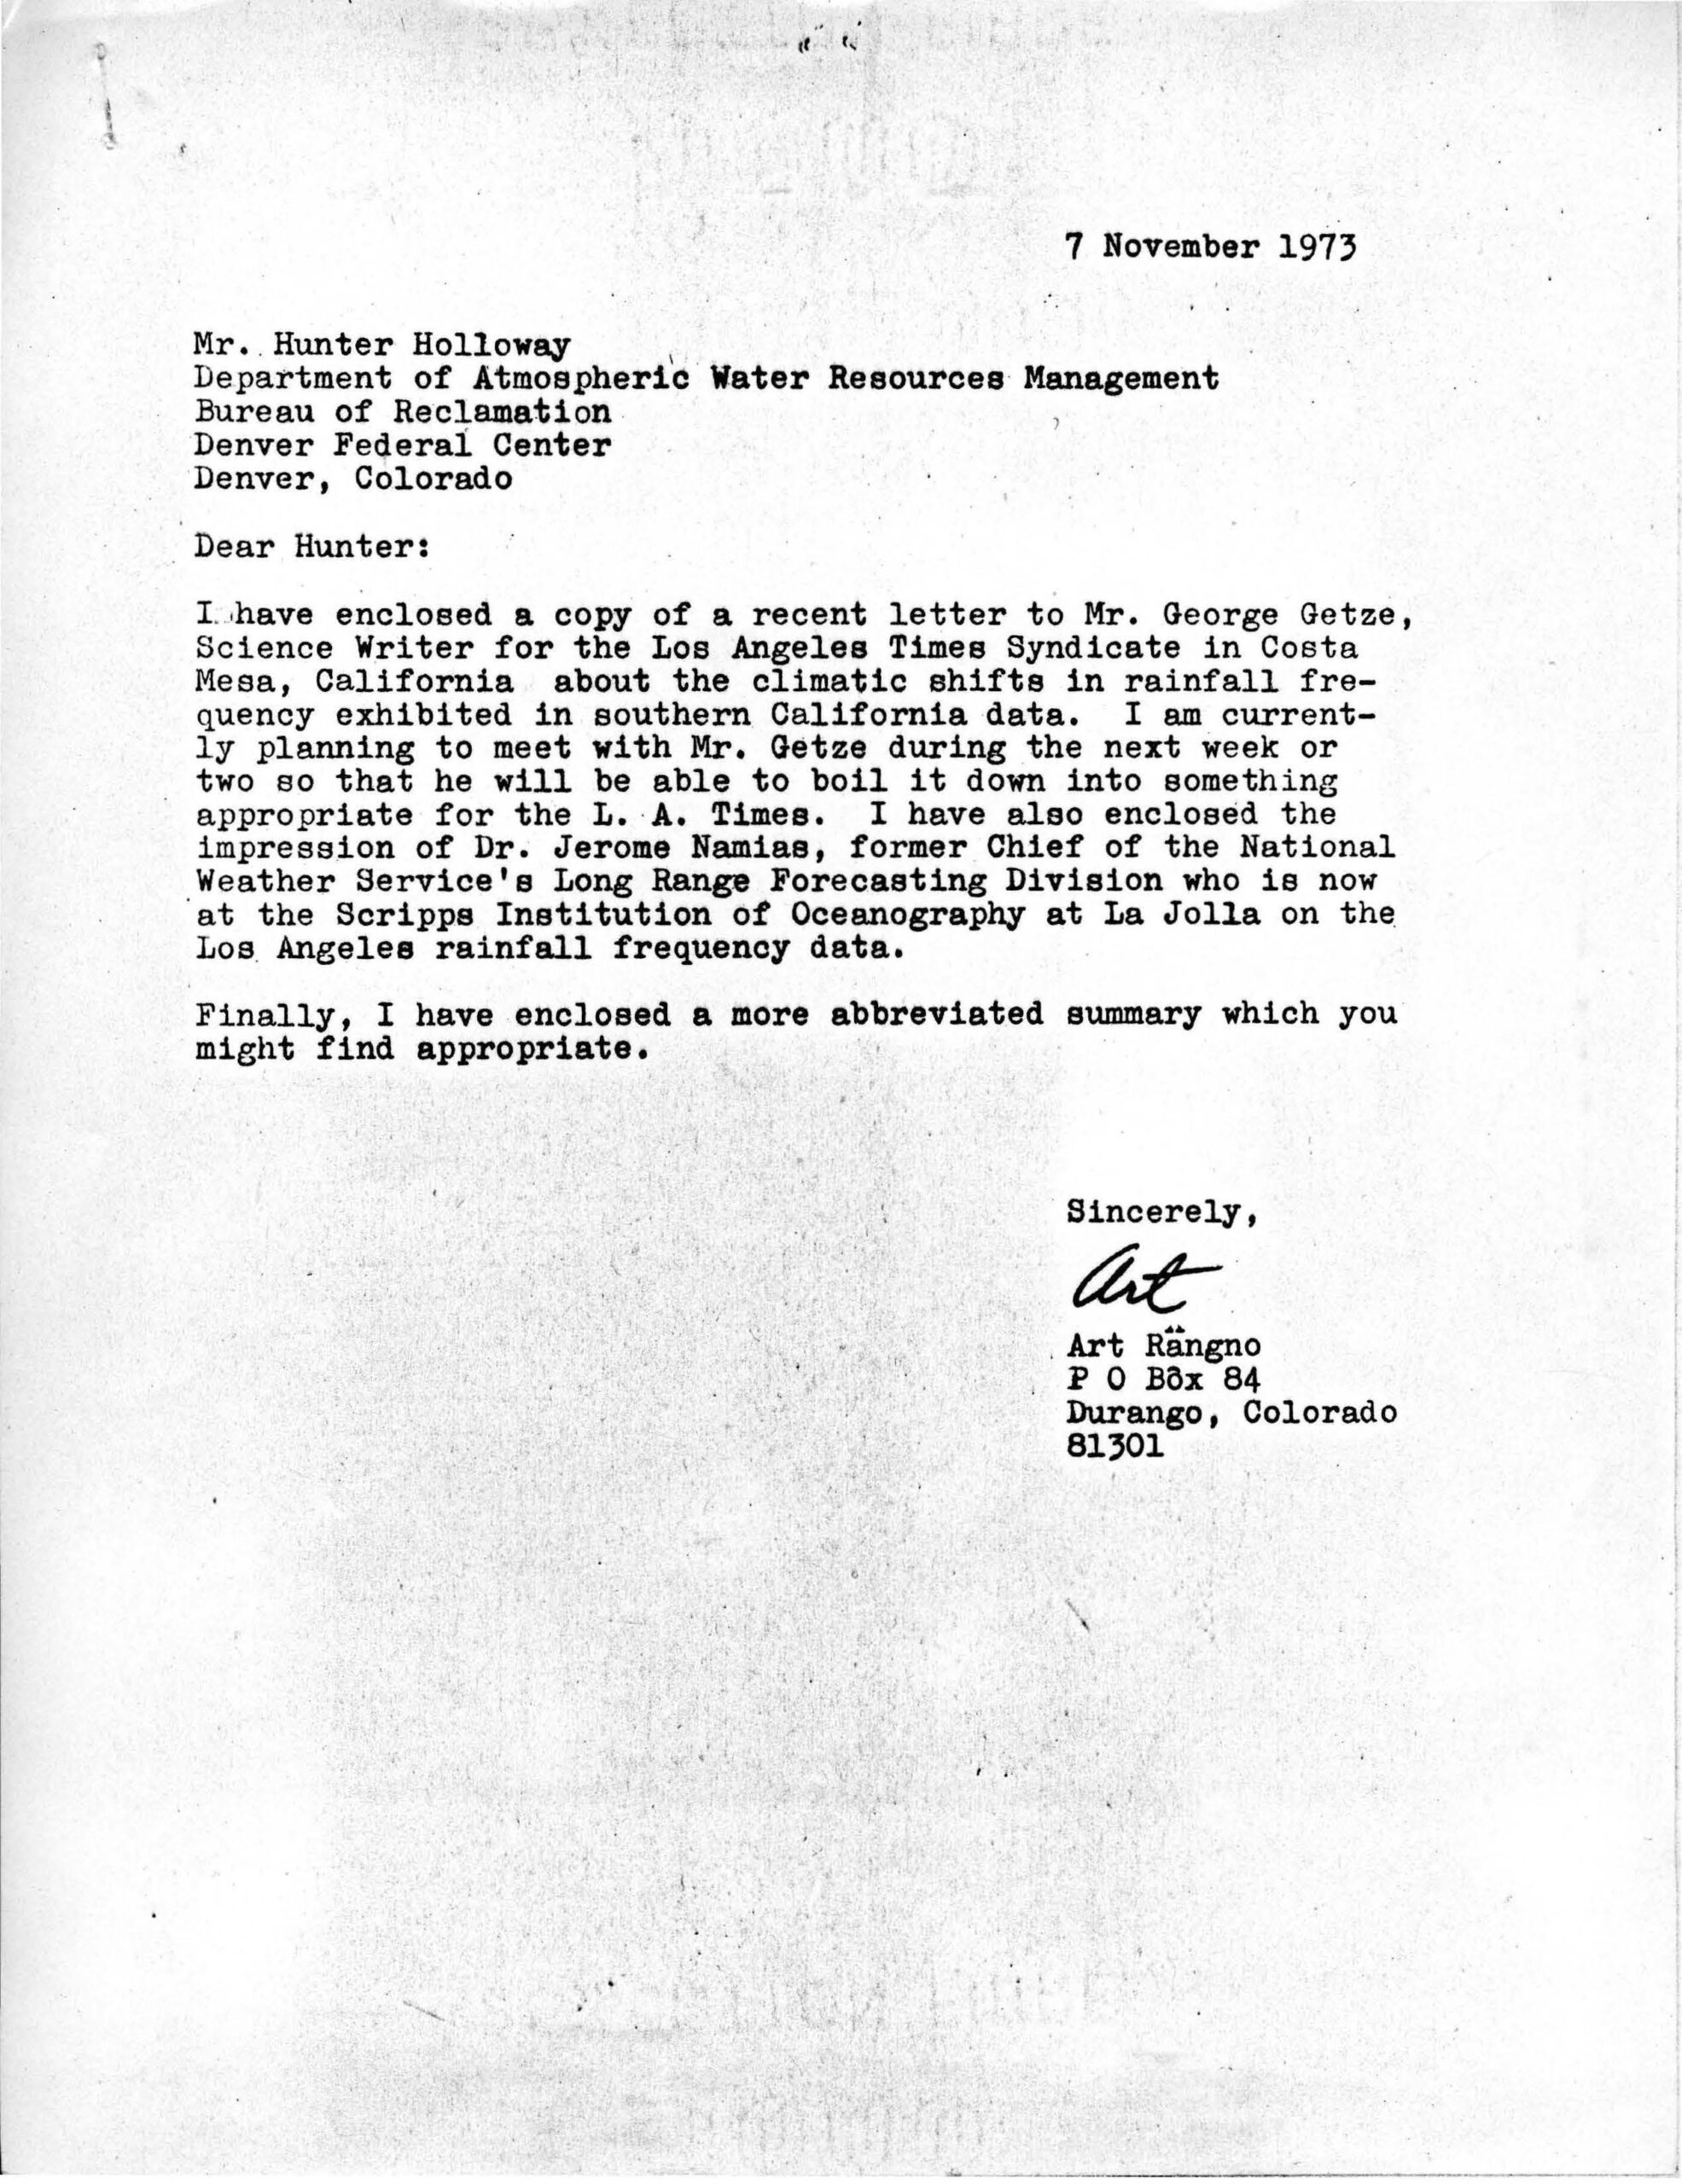
The reason I posted the letter above is to PROVE that I really was anticipating “The Shift” BEFORE it happened:

The additional research I carried out went far beyond the rain day graphs:

Pacific cyclone tracks before and after a “shift,”

NH average sea level pressures before and after a shift.

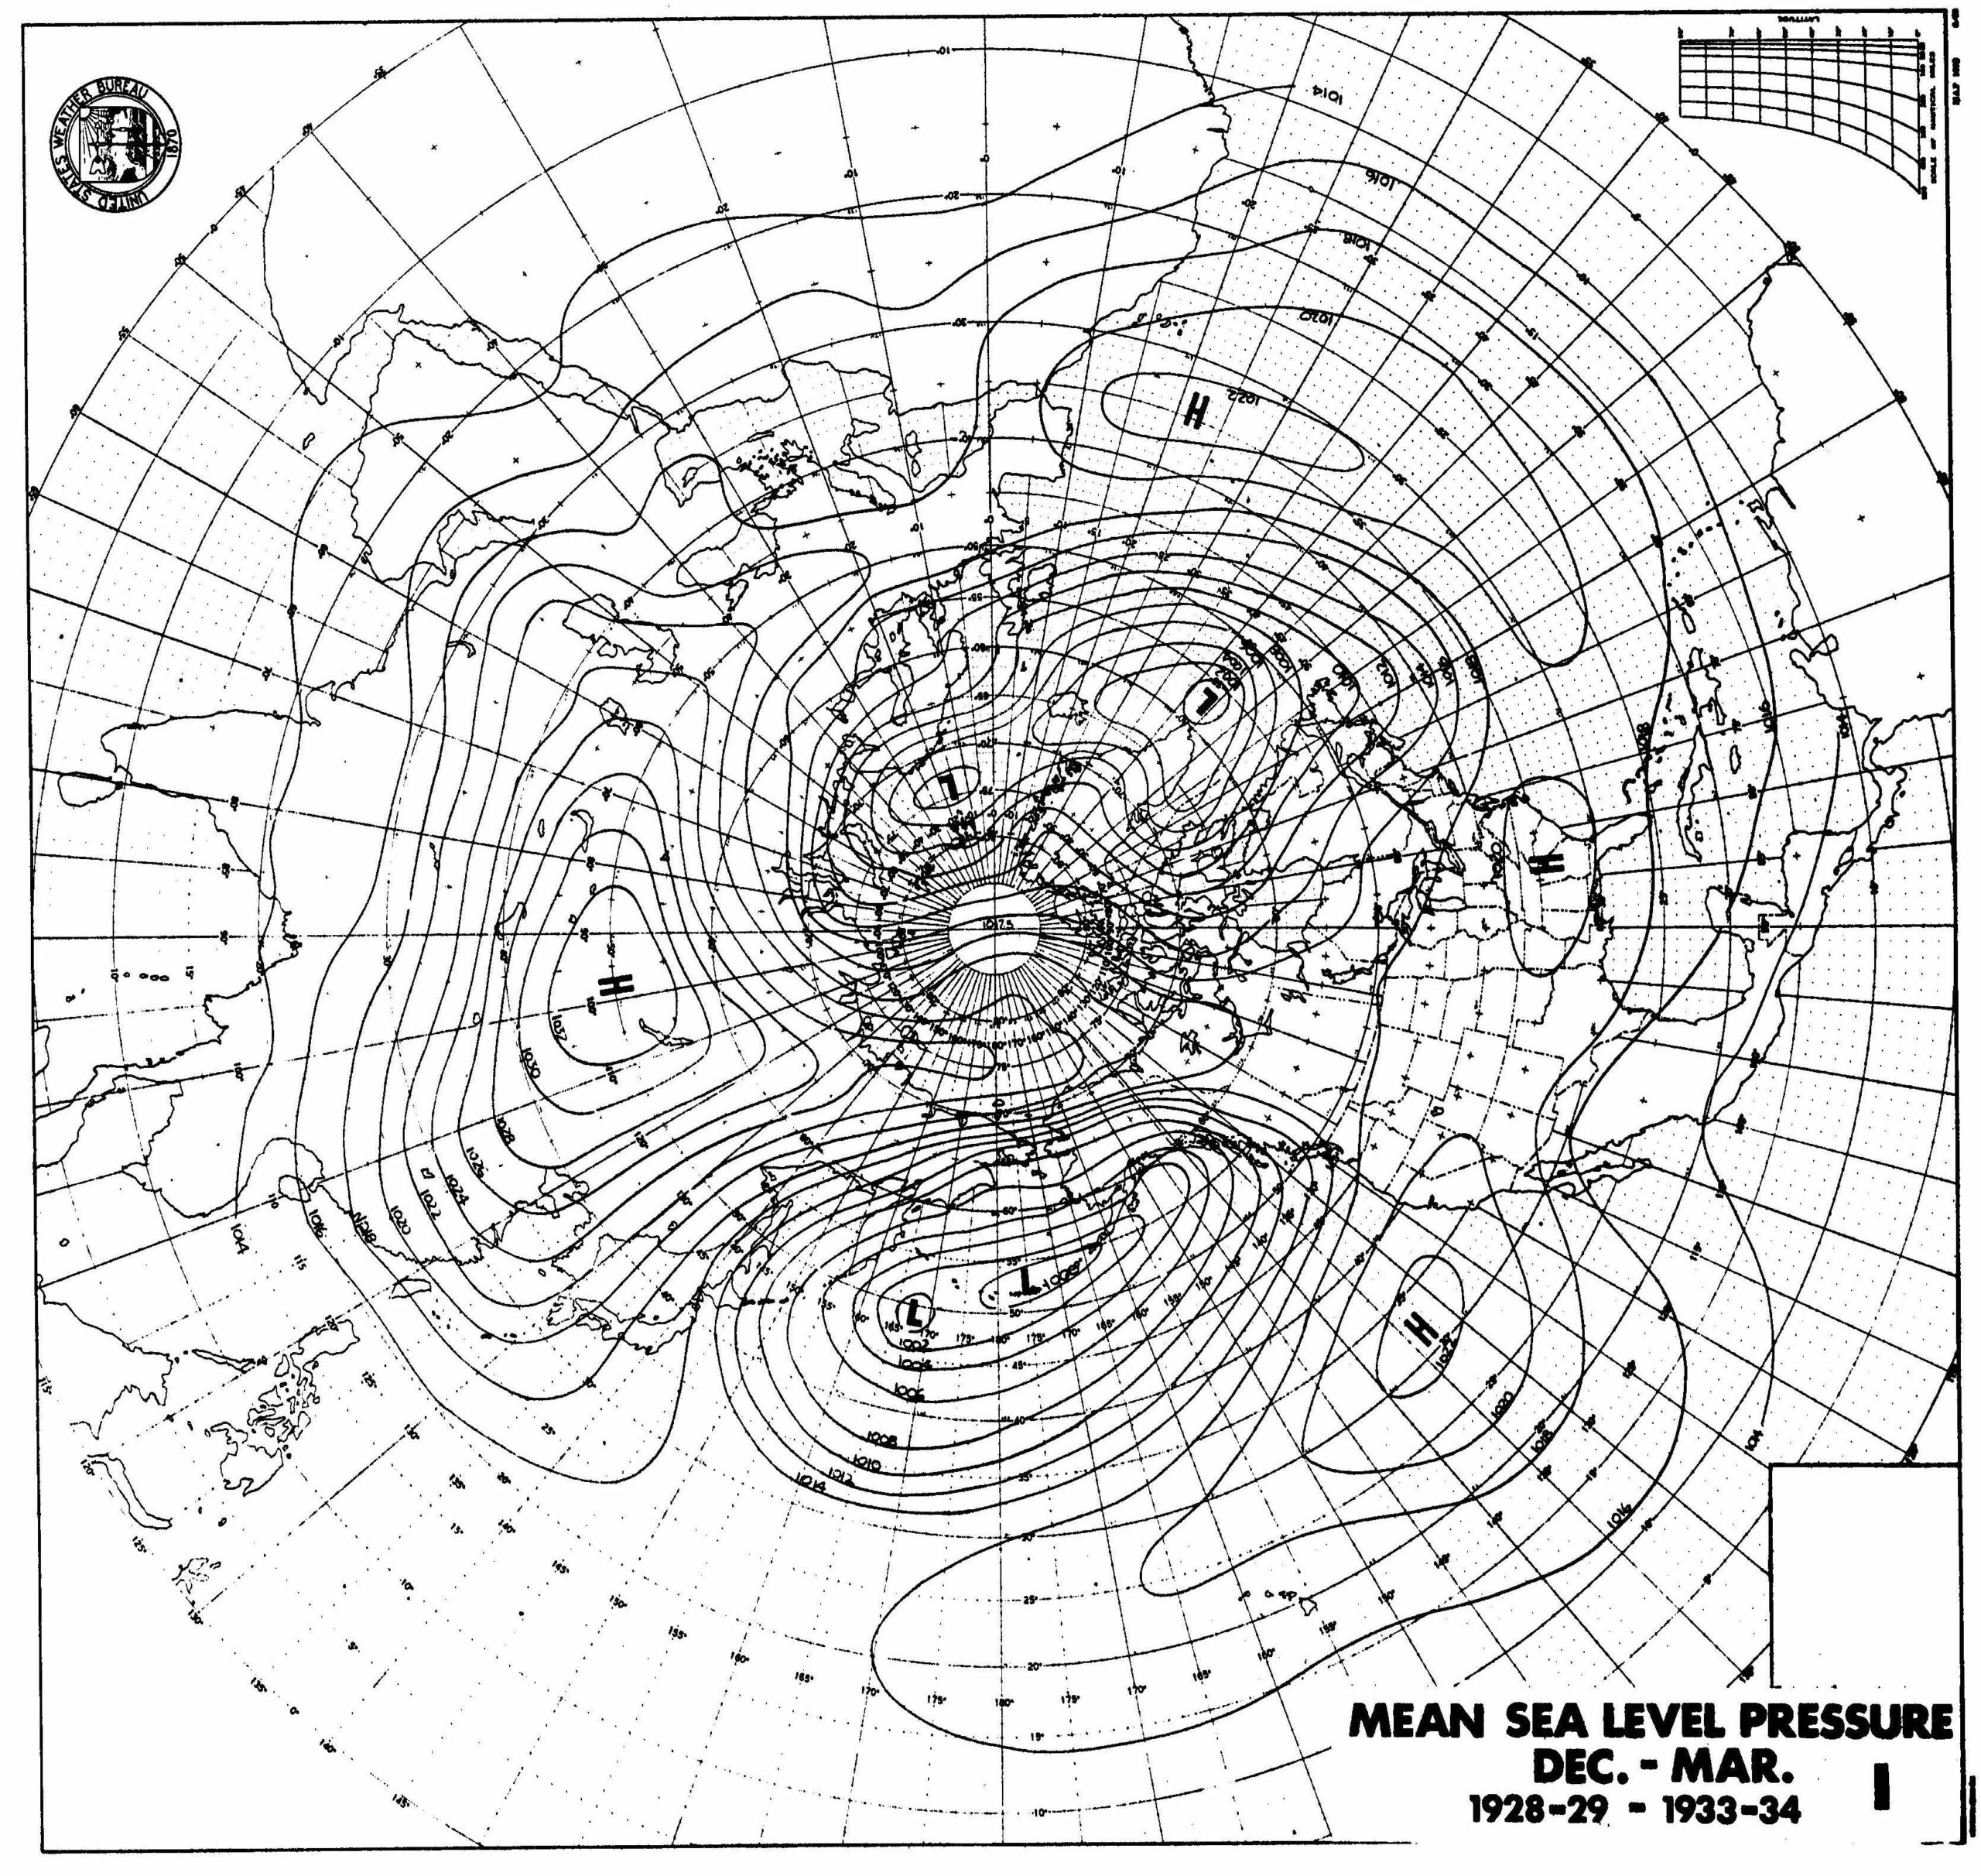
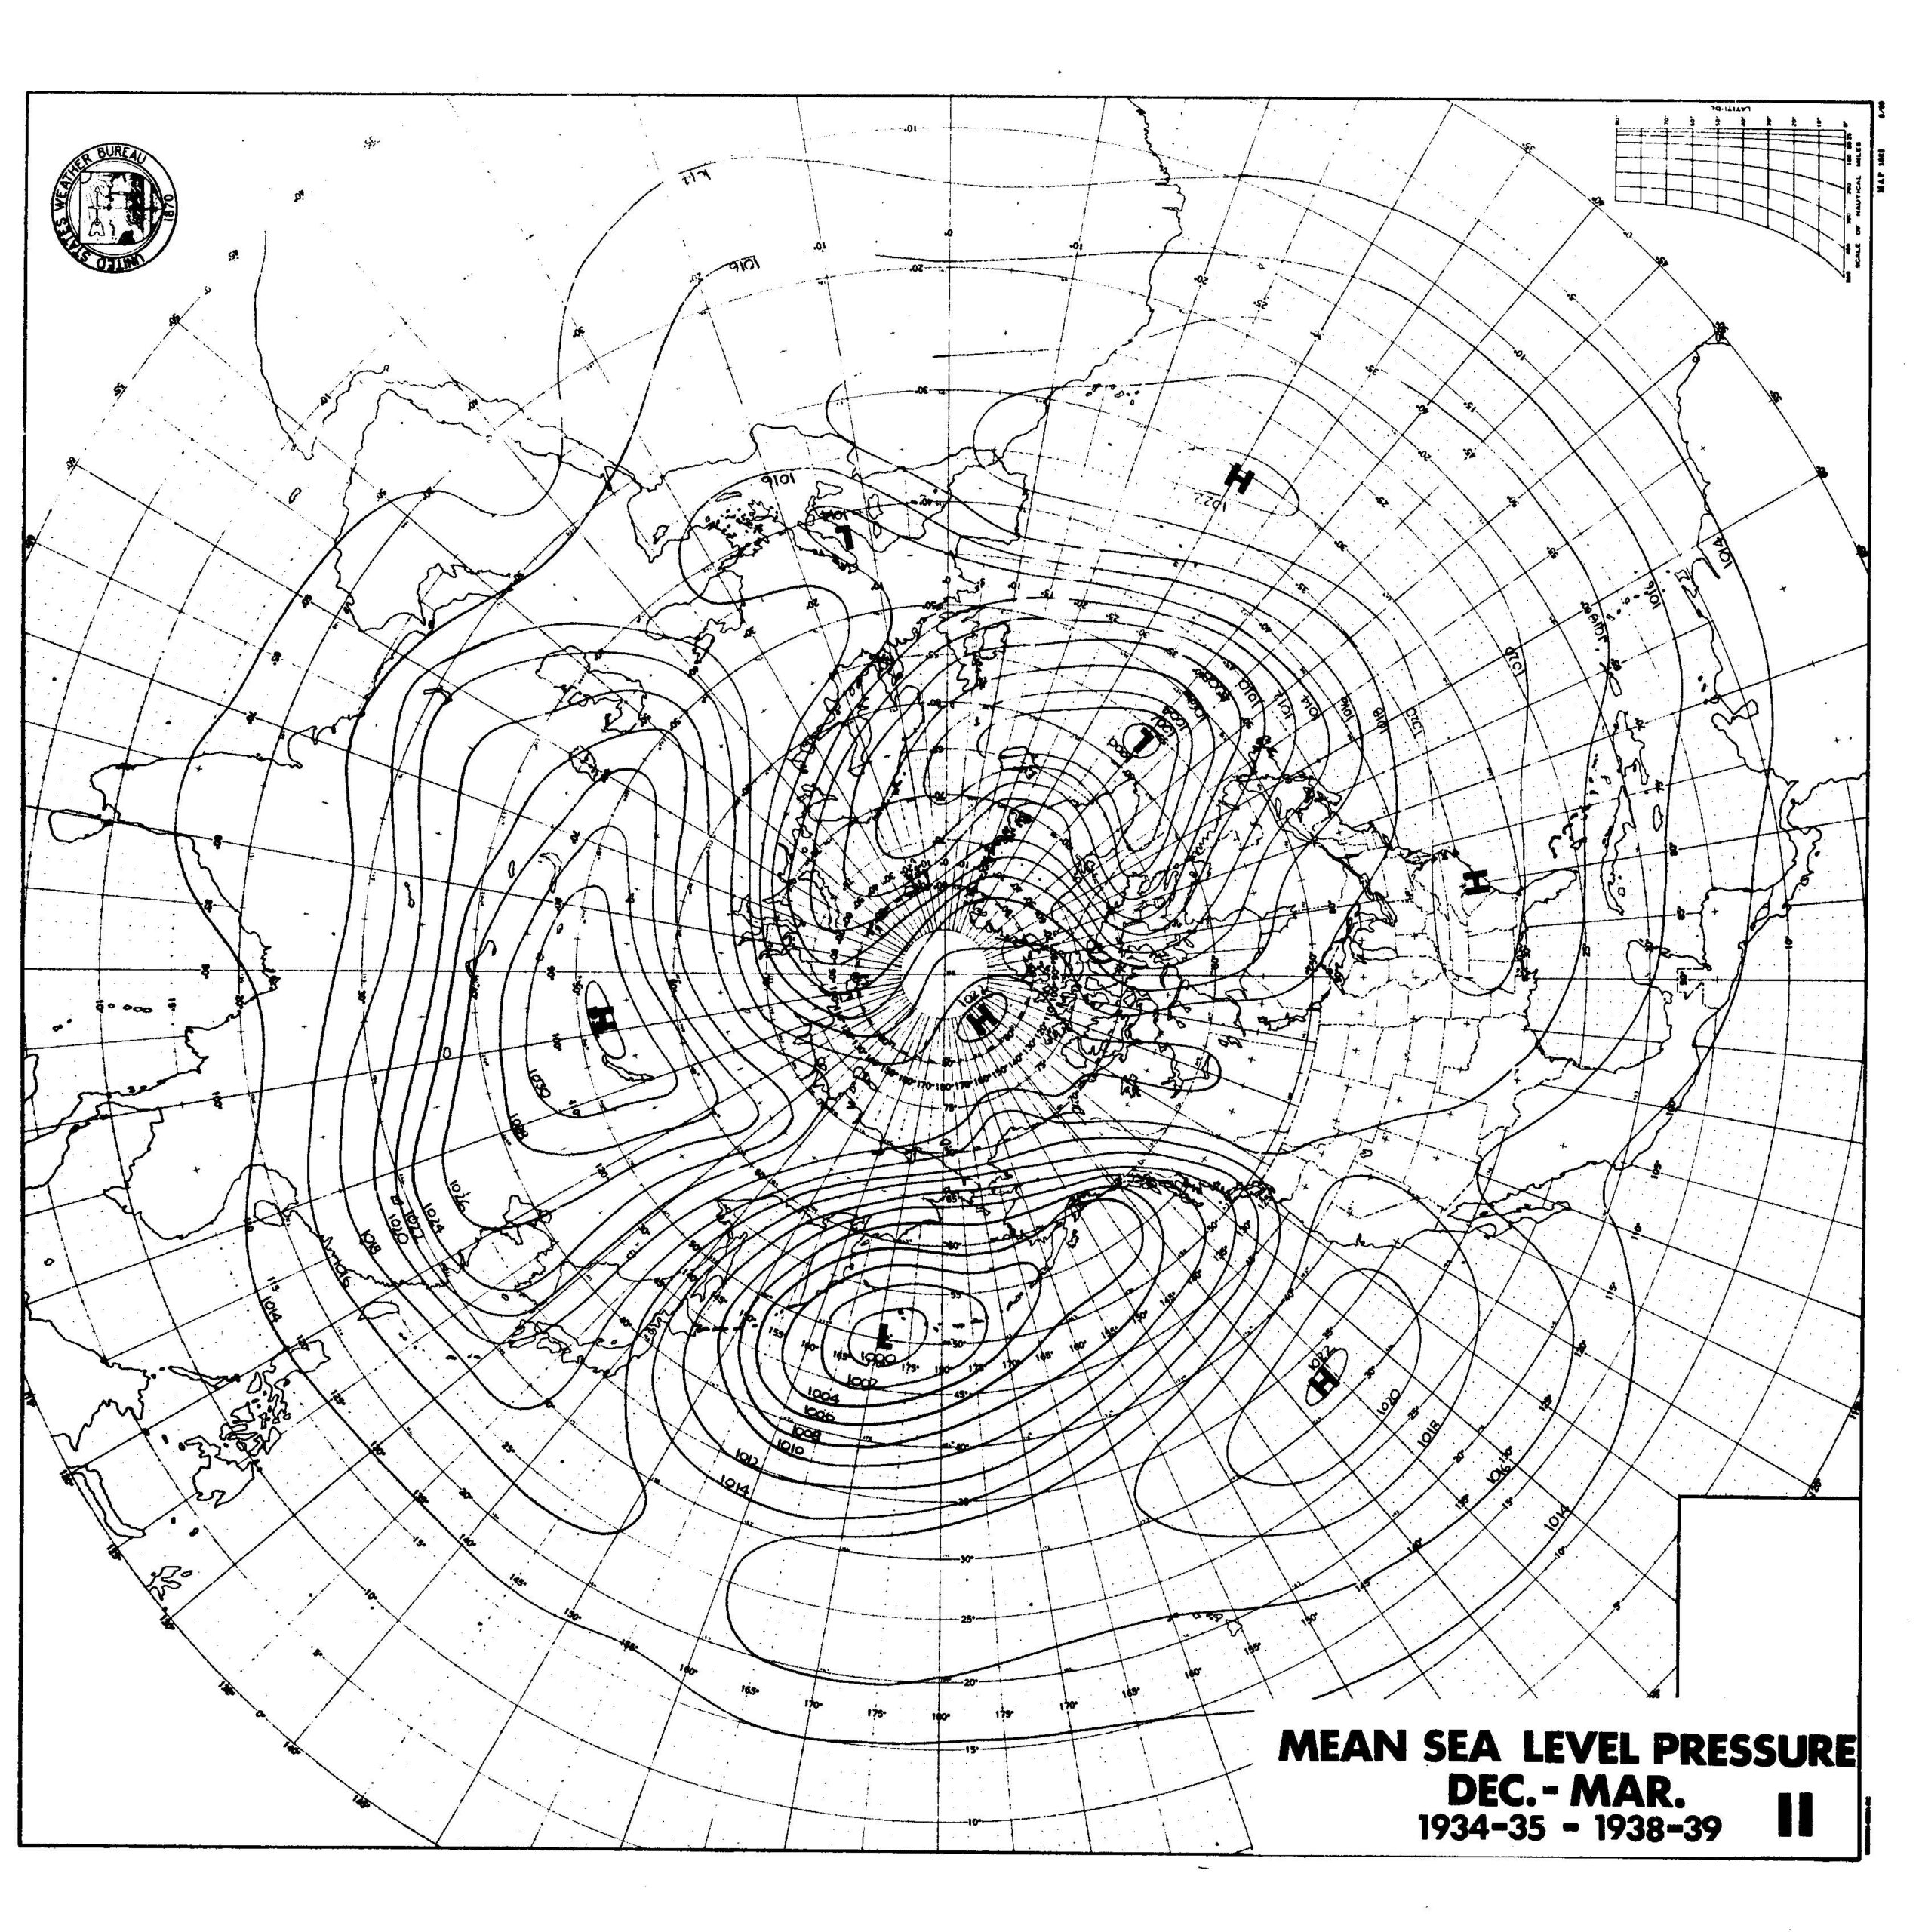
Here are the sea level maps for the 1930s, before and after a shift that occurred with the 1934-35 rain season.  For those not acquainted with the synoptic charts of that 1930s era it was something of a golden age of ship reports before they disappeared on these maps during World War II.  Thus northern hemisphere sea-level pressure and cyclone tracks changes could be reliably charted.

A graphically obtained “delta” map of sea-level pressure changes before and after a shift comprises the third graphic.   Not much can be seen to have happened when looking at these average maps for whole December through March seasons due to having  semi-permanent pressure systems like the low in the Gulf of Alaska, and the “Pacific High.”  I deemed looking at cyclone tracks (the following graphics) as far more useful.  Nevertheless, these are never-before-seen-or-done maps by anyone but me.  Enjoy:

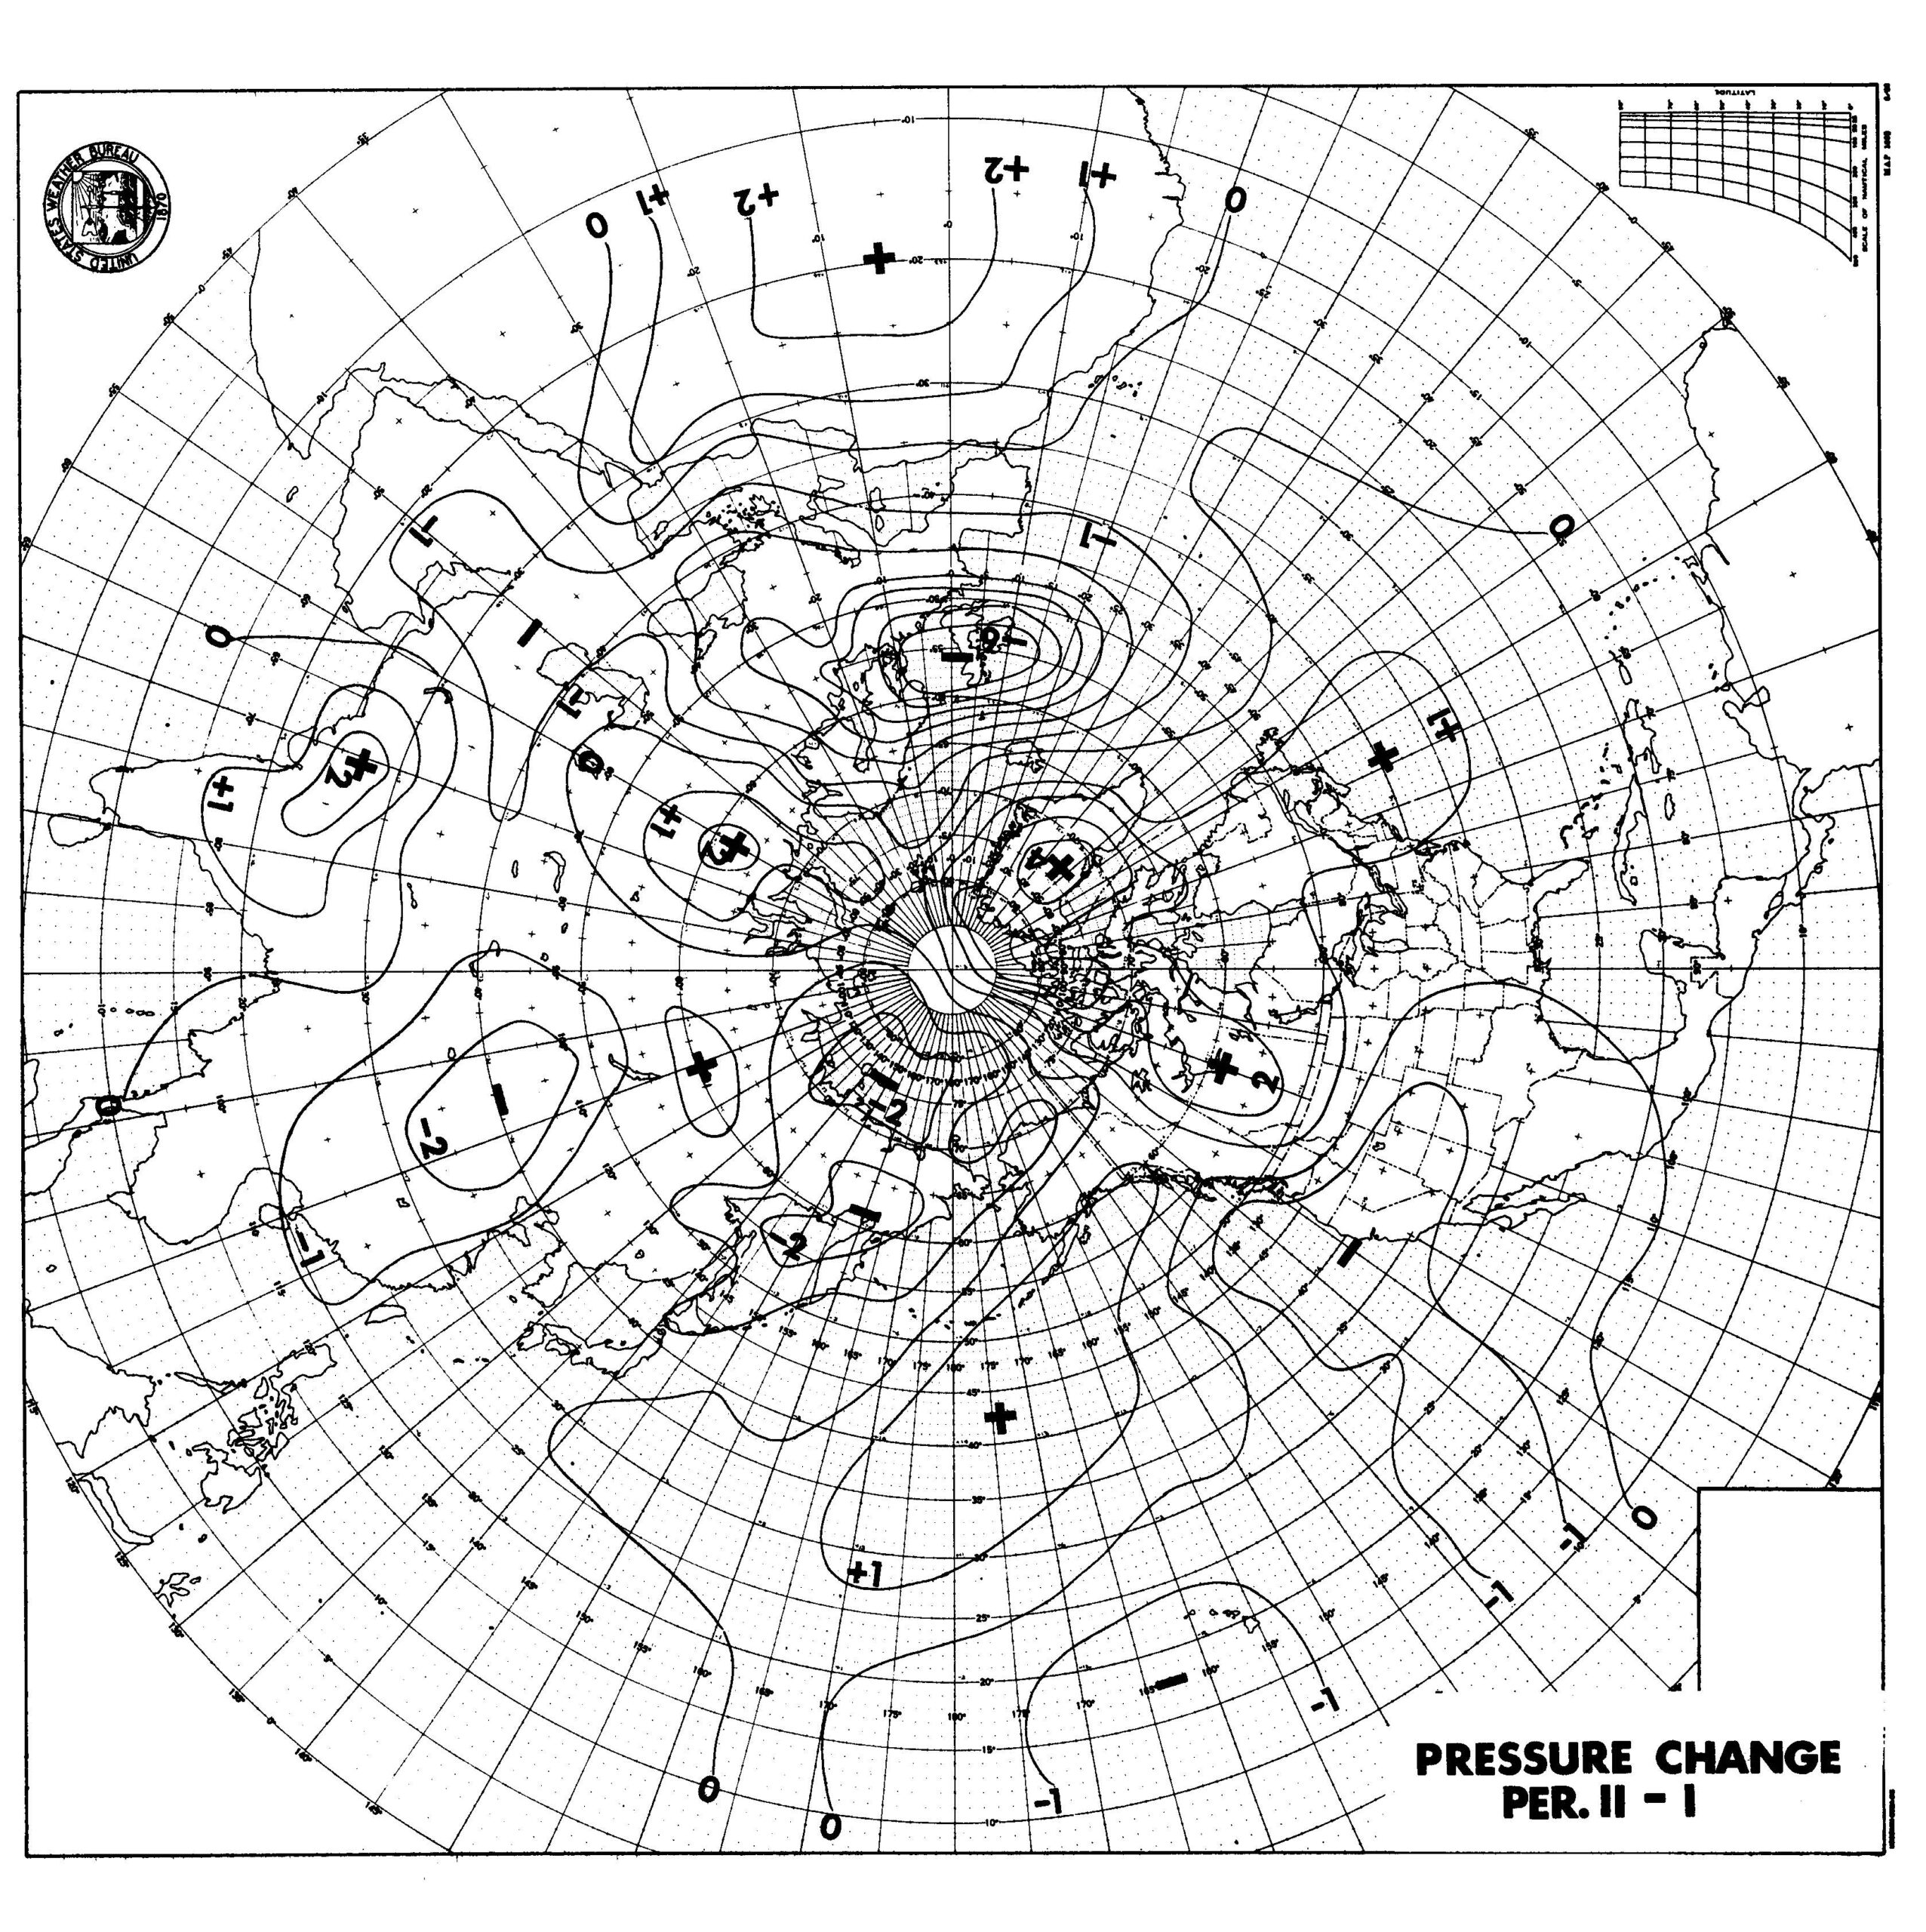
Strangely believe it, the greatest sea level changes were in the domain of the Arctic Oscillation; in the North Atlantic, Greenland and England.  Whodda thunk it?  Not much change in the Pac and West, as expected due to persistent pressure fields even in these extremely frequent days with rain and those with many fewer ones.  I honestly did not know what to make of this change.  Do you?  If not, let’s keep moving….

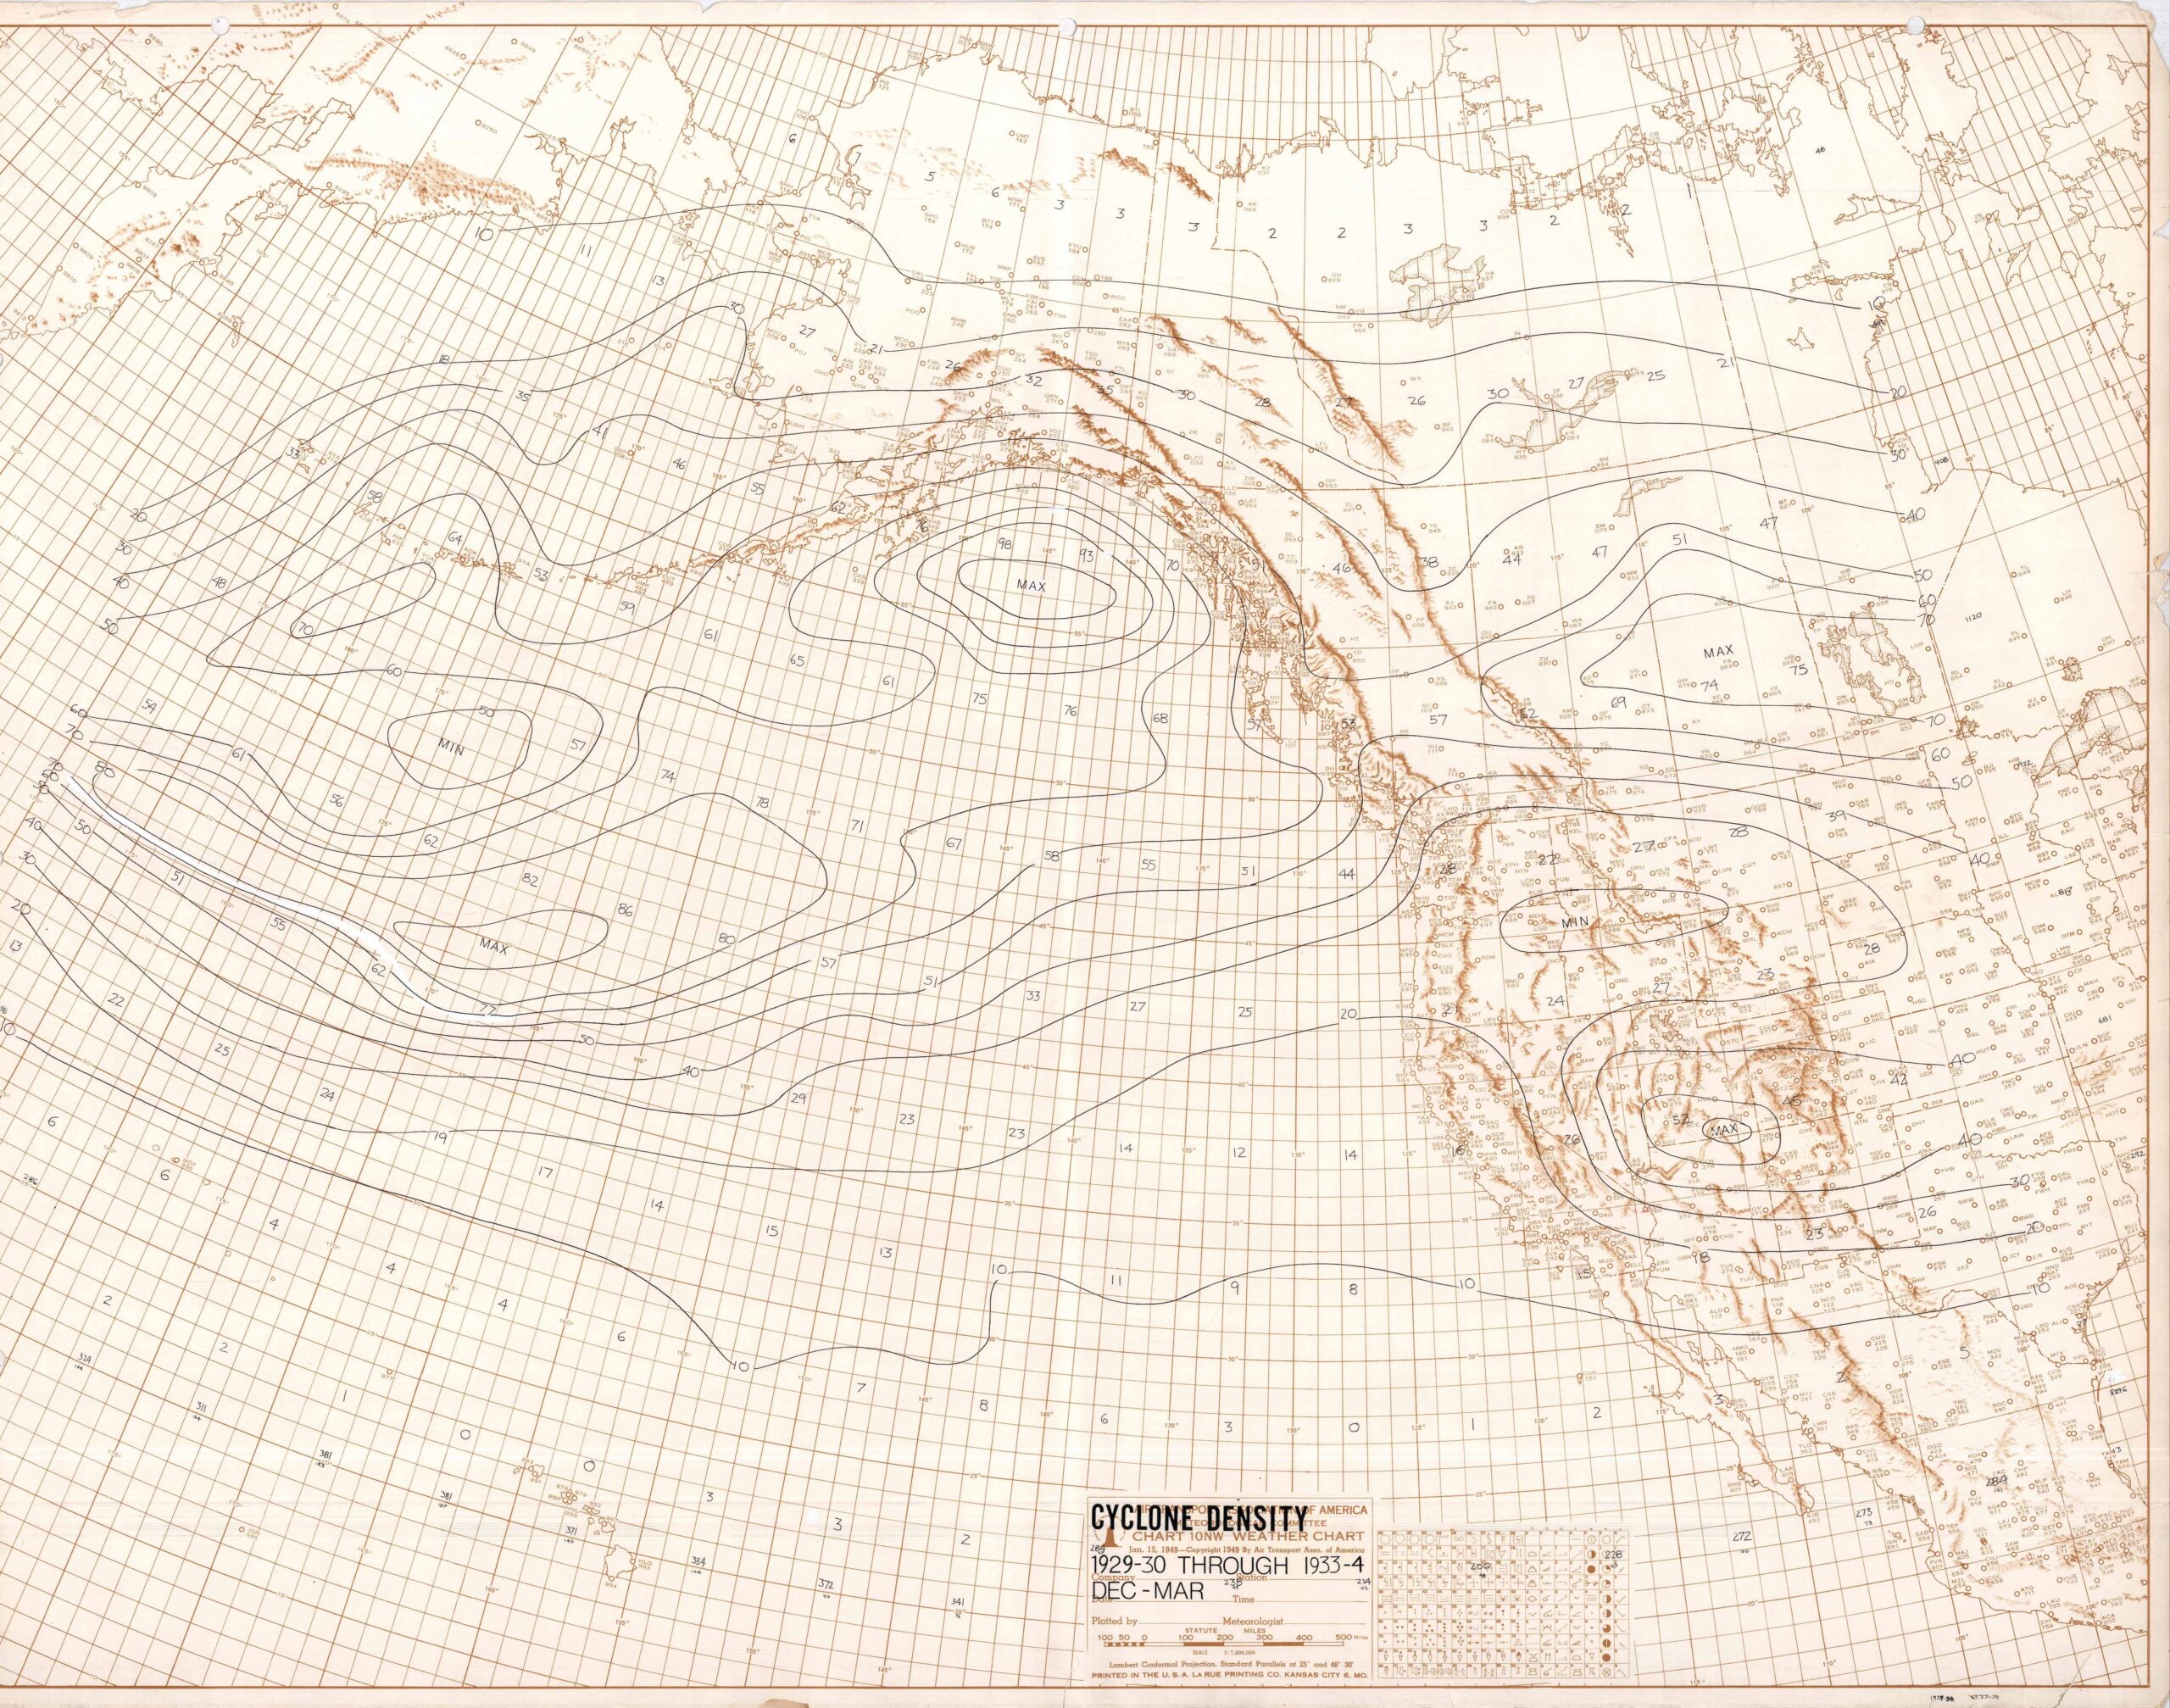
Before doing the sea level pressure maps, I had charted cyclone centers across the central Pacific to the Rockies for the same winter (Dec-Mar) periods as was done above.  These charts were much more illuminating concerning the shift that happened in days with rain in central and Southern California:

First, the cyclone track “densities” of the five low frequency days with measurable rain winters preceding the shift.  A strong channeling of cyclones was seen during these winters from the lower latitudes of the central Pacific into the Gulf of Alaska and into southern British Columbia to a lesser degree.  This suggests the geographically anchored Asia/western Pacific Ocean jet exit had extruded farther east and into the central Pacific.  (Upper-level maps are not available for this period.). This was to resemble what happened in the low rain frequency seasons of the early and mid-1970s that preceded another shift.

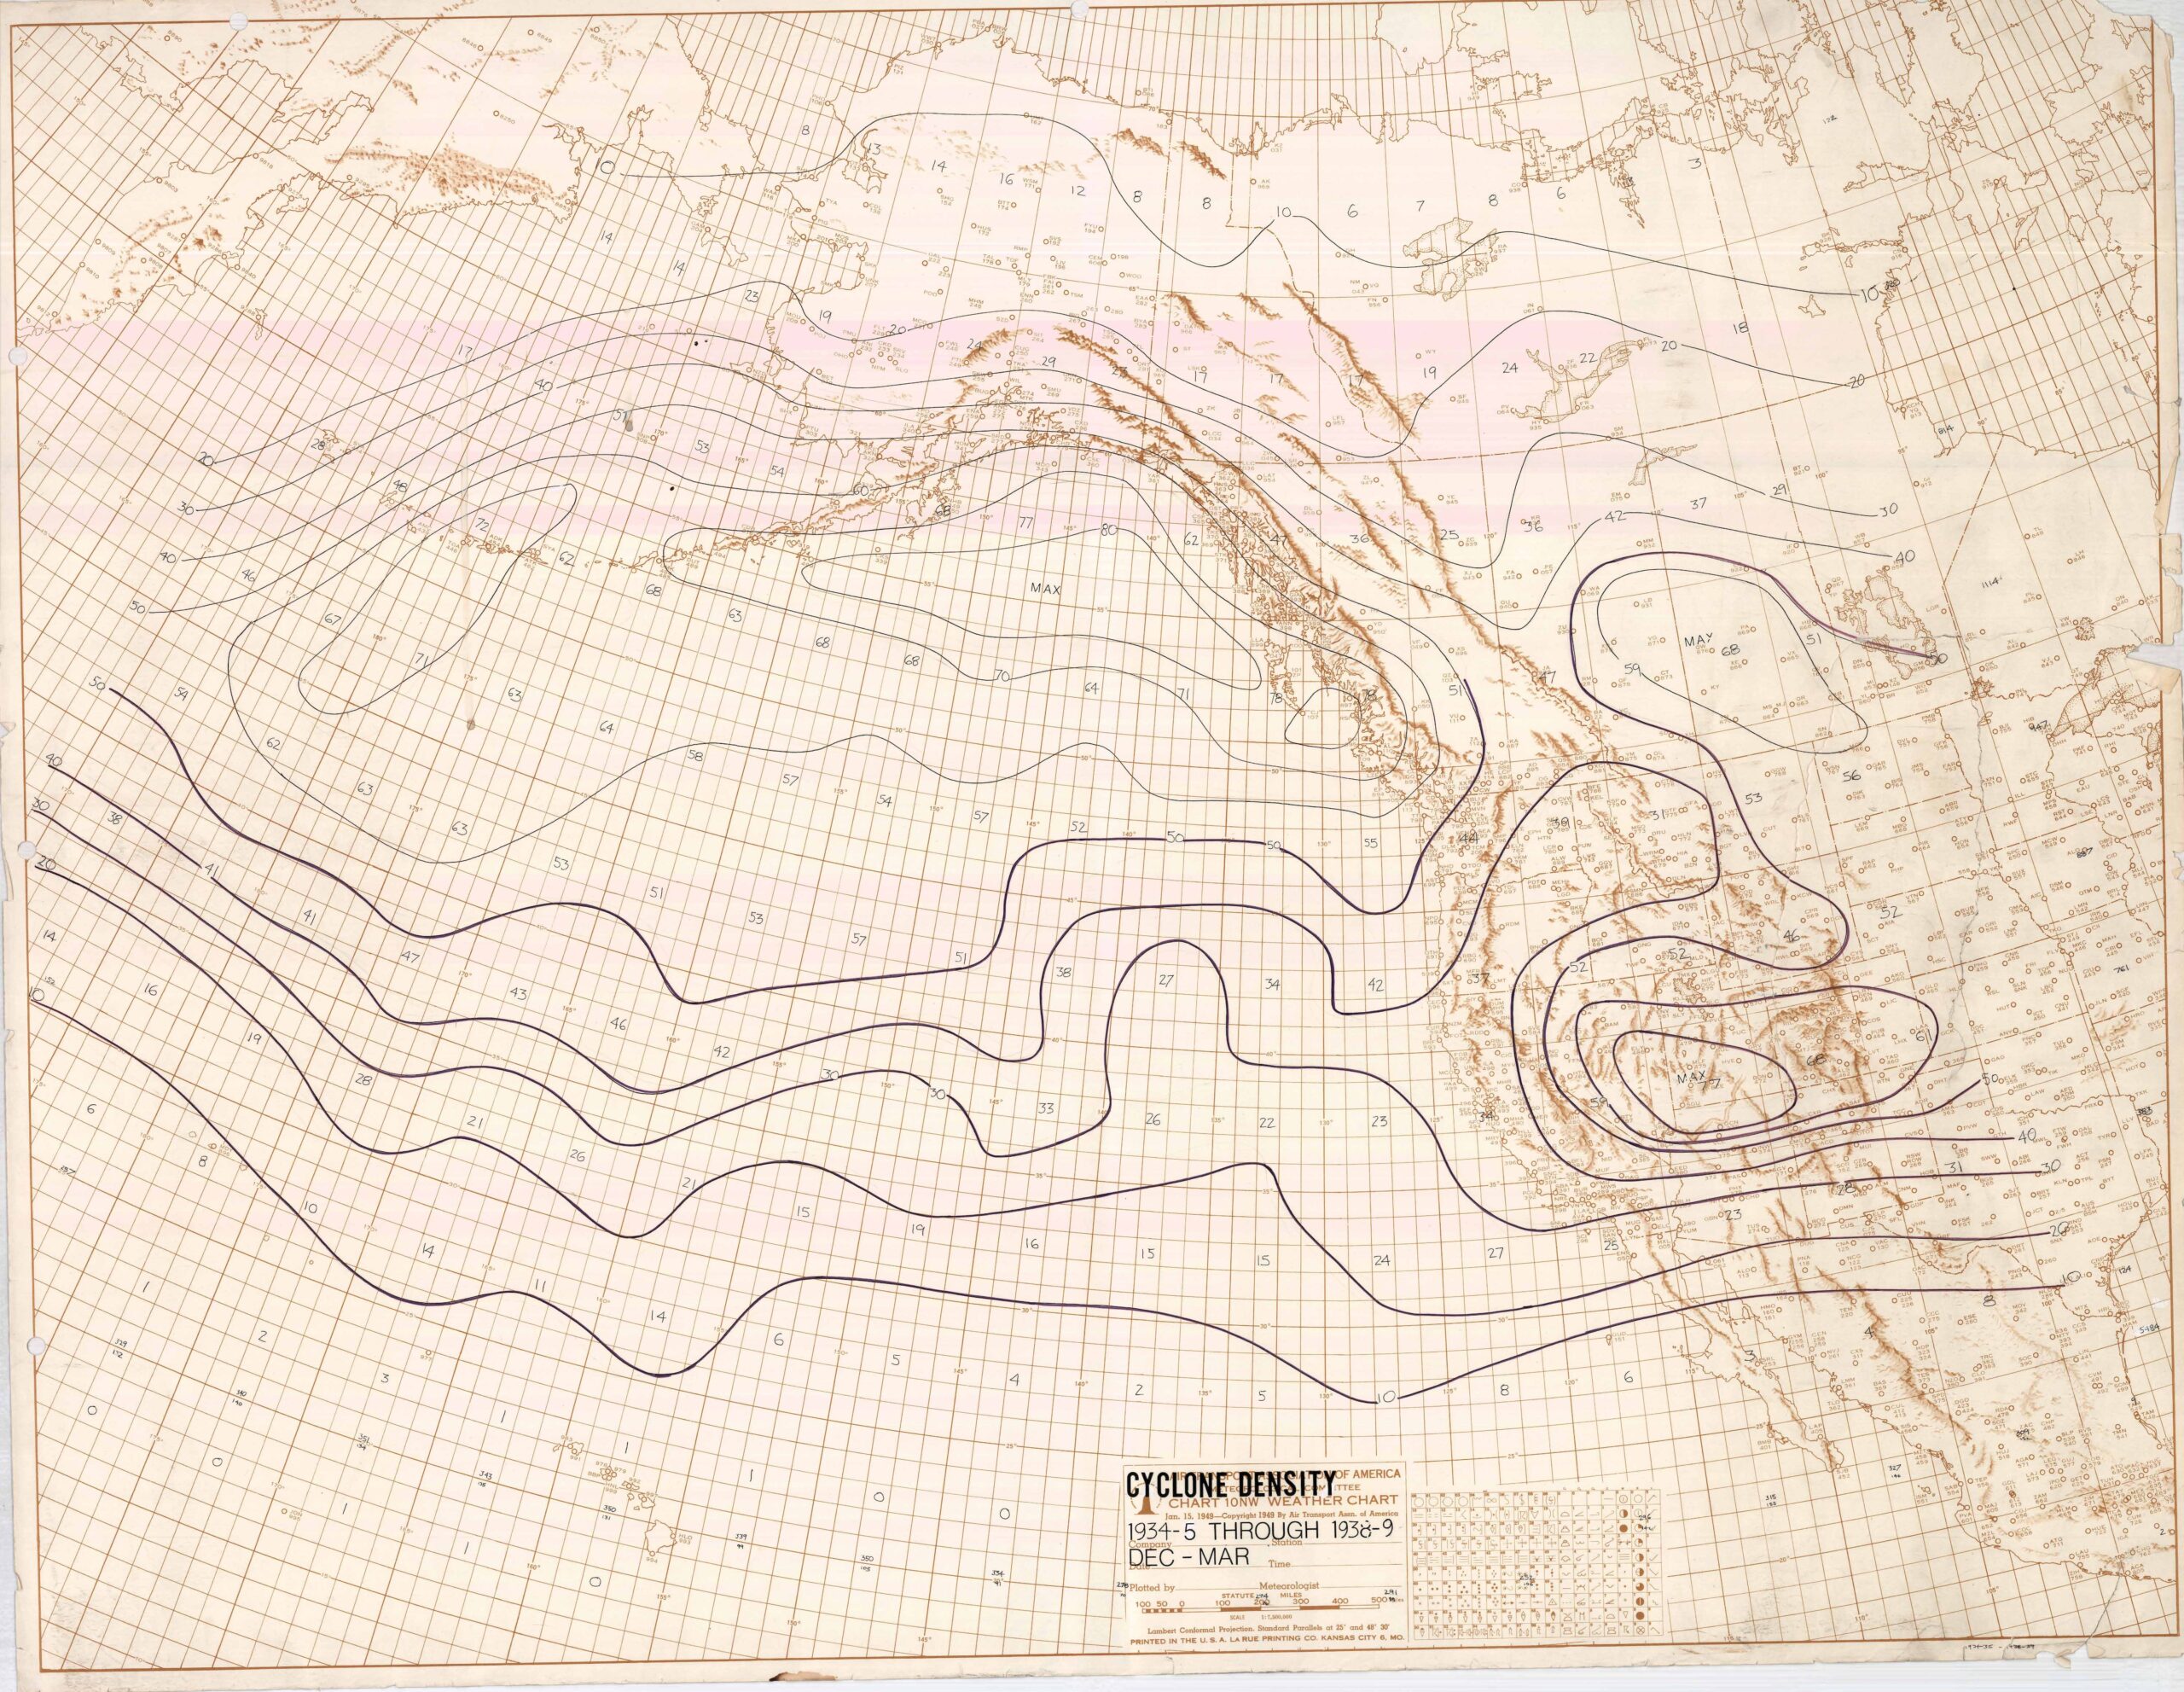
In the figure below are the tracks following the “shift” to higher frequency rain day occurrences in central and Southern California.  The channeling is gone and what appears to be a standard distribution of low centers has replaced it.  Cyclones that developed in the western Pacific moved northeast into the Aleutians relatively close to Japan rather than scooting across the lower latitudes of the central Pacific.  The difference between these two maps is shown in the final map below this one.

The Delta Cyclone Density Map (pardon the skew):

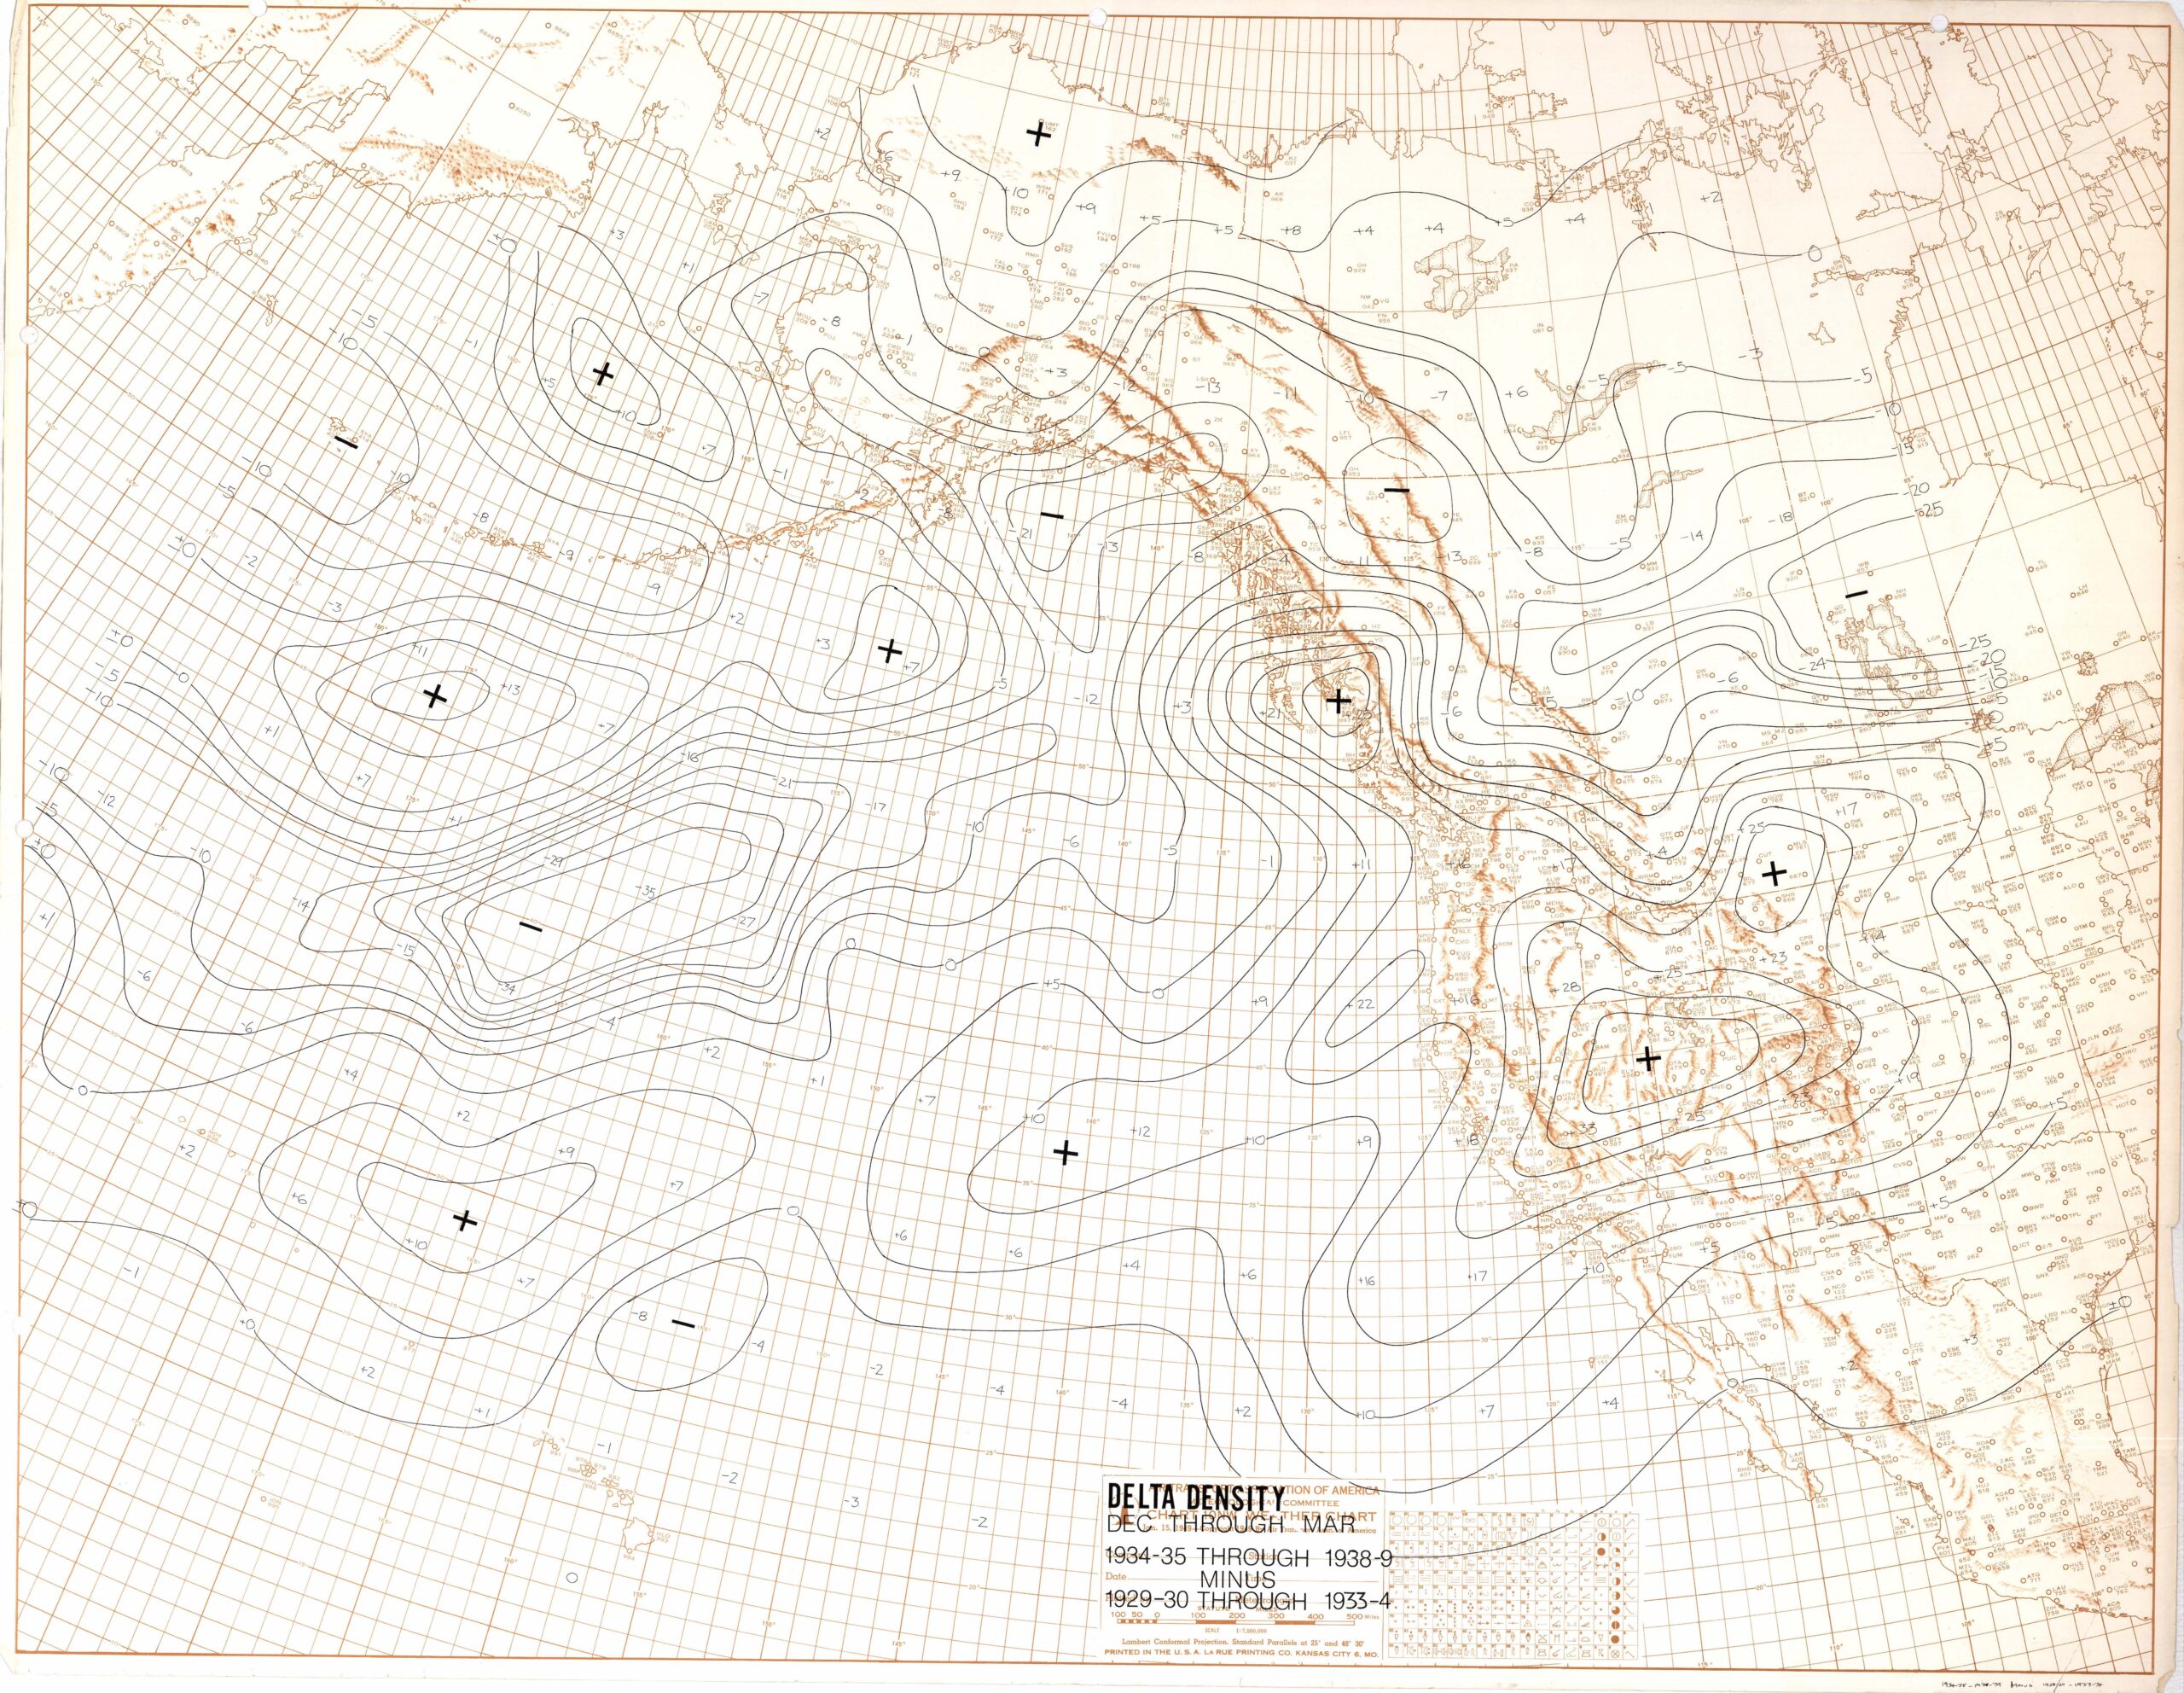
Many more low centers tracked across the extreme eastern Pacific into California and into the Great Basin low pressure cyclogenesis zone in the lee of the Sierras.  This map is more illustrative than the sea-level pressure maps of those changes that happened after the shift to wetter conditions .

Questions:  Did channeled cyclones disrupt the sea surface enough to cause temperature anomalies in real time or later?  Were the El Niños that followed in the late 1930s and early 1940s in part triggered by the lower latitude cyclones racing across the central Pacific? Was this a global change such that Western Europe and northwest Africa saw a shift to wetter conditions after the ones noted in central and Southern California?  Data were not available for this period of study (1930s) except in the Middle East for Jerusalem, Israel.  There was no indication of a long period of decreasing days with measurable followed by a sudden and prolonged shift to more frequently rainy days.

My favorite answer to, “What caused this shift when someone asked was based on the work of E. N. Lorenz at MIT.   Professor Lorenz is famous for bringing our attention to chaos theory where small initial changes in starting conditions can lead to huge differences later.  Today, this concept is used to improve forecasts by introducing minor changes in initial data in the models from that observed to see how much difference results in the model predictions.

There need not be an external cause for climate shifts, he wrote.  It may just that systems shift in and out of favorite modal types without an external  forcing.  Thus, the best answer for what caused the shift I think I detected was, of course, “nothing.”  See Lorenz (1968, Climate Determinism) in the Amer. Meteor. Soc. Monograph Vol. 8, No. 30, on,  “The Causes of Climate Change.”   Strangely believe it, there are no papers on CO2 in this Amer. Meteor. Soc. monograph!   Mauna Loa measurements of C02 had just begun and so there was no awareness of how it was steadily increasing over the years.

——-

Work to be done?

Bringing the days with measurable rain plots up to date, storm tracks in the 1970s, and investigate whether the 564 decameter geopotential height contour shows a global expansion after the 1970s shift after hemispheric geopotential heights became available (beginning in the mid-1940s).   Or is the shift to a high rain frequency along the central and Southern California coast a local phenomenon where a mean upper-level trough recurrs along the West Coast for years at a time?  In a cursory check recently, there seems to be no clear recurrence of the prior three shifts in days with rain.  Boo.

And lastly, one must ask, is what I have done a “scientific mirage,” and expression used by Foster and Huber (1997) to denote illusory science?

I would like the answer to be a sudden global expansion of the polar westerlies (shown in the average hemispheric latitude of the 564 500 hPa geopotential height contour that accompanies a shift, something like the “Bond Cycles” observed in historic ice core data:  a “reset,” if you will, after a long, long period of withdrawing ever so gradually over the decades.  Perhaps our gradually shifting climate to a warmer one has done something to interfere with this “shift” phenomenon?

An obstacle that arose in later years was that climate station at Cal Poly, San Luis Obispo. whose record started in 1868,  started having missing monthly data that never showed up in the “Delayed Data” section in NOAA’s Climatological Data in the June and December issues.   Eventually, NOAA dropped even having a “Delayed Data” segment in the June and December issues!   Boo on that!  Santa Barbara, whose record also went back into the 1860s, too, had missing months that never were reported.  I remember how discouraged I was when these events happened and thought about giving up.  How can stations whose records go back into the 1860s (!) suddenly have incomplete records where observers don’t file reports with NOAA?  Where was the California State Climatologist?  Asleep at the wheel, I suppose.

Maybe you, one of my two readers, will take this research up to see if it goes anywhere?

Sincerely, Art “I’m dreaming” Rangno.   :

Caveat:  My grad advisers at San Jose State and a professor at the U of WA were unimpressed with these works.

The Nightmare before Banff: A Science Coming Out Saga

The story of a coming out science “party” for a young, under-credentialed worker who has found that his greatest expertise is finding fault in the work of others.  But he now, for the first time, must defend his work overturning that of the leading scientists in his field  “at conference.”

STORY BOARD

  • Not a horror movie, but a science story that reveals the human element in science. Our protagonist is a shy, under credentialed weather forecaster who takes on the best scientists in their field but must pass through a frightening mental hoop before demonstrating at a conference that one of their published cloud seeding successes was illusory.  Well, I guess it could be a movie, one with a scary part…
  • This cloud and weather-centric protagonist has already taken the famous scientists on in the published literature in May 1979 when his first ever paper appeared in a journal reanalyzing one of their most important experiments.  But he must now defend his work in person at a large conference in Banff, Alberta, Canada, in October 1979.  This will be his first presentation at a scientific conference, his “coming out party.”
  • However, an advance program for the Banff conference is also published in May 1979 and it reveals that our protagonist’s findings will be addressed by the famous scientists right before he gets up to present them!   Colloquially, “WTF”?
  • In September 1979, he learns from his lab chief that the famous scientists are, indeed, working on a new analysis of the experiment that our protagonist will discuss at Banff.  Palpitations and dread levels rise.  He writes to the famous scientists inquiring about this new analysis of their experiment, but receives no reply.
  • Our protagonist lives a nightmare few months before the conference, wondering even if he should go and be humiliated as he expects.  He is not on a credential par with those scientists at any level.  He is just an ordinary meteorologist and weather forecaster with no advanced degree, one of the very few with only a bachelor’s degree presenting at the conference.
  • Our protagonist redoes his published paper, looking for errors he might have made, or ones that the reviewers might have missed, ones that will surely be emphasized at the conference.  He doesn’t find any.
  • He does go to the October conference filled with terrible dread anyway, bur his allies, the director of his group, and a supporting prof are with him.
  • Late in the afternoon before his presentation the next day, one of the famous scientists tells our protagonist that they won’t be discussing his paper after all before he gives it.  They acknowledge, behind the scenes, that they, “screwed up.”
  • The story ends on a happy note.  There is no criticism of his paper.
  • Our protagonist also realizes that his awful 1975 gaffe in a local newspaper story about the work of the famous scientists may have given them an understandable motive for some “payback” as the months of dread, intentional or not, seem now to have been.

Note:  There is some real bawling described in this saga by our protagonist concerning the journal publication hurdles that one must go through.  In his case, because his controversial work overturning the published research of others was done on his own initiative, “time and dime,” there is an awful lot of emotional “ownership” in what happens.

If you are now like I was  in this long ago,  “anxiety chapter” of my life, one that so many of our citizens are likely experiencing today due to so many unwise changes being foisted on our country, the war in the Middle East,  etc., I highly recommend this video on anxiety:

https://www.prageru.com/video/can-anxiety-be-a-good-thing-with-dr-chloe-carmichael?utm_source=Iterable&utm_medium=email&utm_campaign=campaign_8040634

Art

==================================================

————-The Nightmare before Banff—————-

The program for the October 1979 Banff 7th Conference on Planned and Inadvertent Weather Modification came out in the Bulletin of the American Meteorological Society (BAMS) in May 1979.  My talk there was going to be a coming out party for me because it was going to be my first presentation at a conference.  Previously, I had just run a microphone around at a conference for those who had questions after a talk.  And I was going to present at a joint meeting of both the Planned and Inadvertent Weather Modification crowd, and the “Statistics in the Atmosphere” crowd, too; in other words, in front of a big audience of top scientists.  May 1979 was the same month that my peer-reviewed paper reanalyzing the Wolf Creek Pass experiment (WCPE) came out as the lead article in the J. Appl. Meteor.  That was the work I was going to summarize at Banff.

But what I saw in the May BAMS program for the October conference terrified me.  The famous leaders of the Colorado State University (CSU) cloud seeding experiments, Prof. Lewis O. Grant, and their statistician, Dr. Paul W. Mielke, Jr, were going to discuss my paper before I gave it!

Yikes!

Mielke and Grant were at the top of the mark in the world of cloud seeding/weather modification and had published several papers describing their prestigious cloud seeding successes at Climax and Wolf Creek Pass, Colorado.

I wondered, too, how the program organizers could allow this sequence.

I was going to be humiliated, I was sure, due to errors that I had made, but did not, or could not recognize due to my own bias or ignorance.   Maybe I had not even copied down runoff or precipitation data in my dozens of “pen and ink” spreadsheets correctly from the volumes of government published data, the source of my analyses.1

I had palpitations off and on from the time I read that BAMS program until the day before my talk at Banff.   I just could not imagine how horrible it was going to be; I repeatedly envisioned that my truly limited skills were going to be exposed. I was sure I would have nothing to say when I got up to speak after Professor Grant and Dr. Mielke had spoken and had surely decimated my reanalysis.  I would be standing there, I imagined, with my mouth open, maybe apologizing for errors.  It would be similar to that 3rd grade trauma with Ann Stone, a never forgotten humiliation!2

I would go to movies, “Serpico” comes to mind, and right in the middle, I would think about Banff, and my heart would seem to want to burst out of my chest, the palpitations were so strong.  I feel lucky I didn’t keel over during those months before Banff.  My heart is pounding right now and I am shivering as I flesh out this chapter of my life.  This must seem silly to more experienced people I suppose.

September 1st, 1979: dread increases. 

I learn from Prof. Peter Hobbs, the director of my group,  that a new analysis of the Wolf Creek Pass experiment is being worked up by the seeding experimenters at Colorado State University.  I write to their leader, Professor Lewis O. Grant, and ask him about the new analysis, but I get no reply.  Now I am positive all the faults that I missed in my paper will be shown up, that my presentation will be shown to be severely flawed and worthless before I give it!

I often thought, too, that I just wouldn’t go to Banff, though my allies at the University of Washington, Profs. Peter Hobbs and Lawrence F. Radke, were going, so that wasn’t really wasn’t an option.  Prof. Hobbs was also going to present my Colorado work that showed that there was no basis for the foundation of the CSU cloud seeding claims that supported huge increases in snow due to seeding when the 500 mb (hPa) temperatures were equal to or higher than -20°C, a temperature level that the experimenters had misperceived as ones that were a proxy  for cloud top temperatures.

Prof. Hobbs had reviewed my Wolf Creek Pass experiment (WCPE) manuscript drafts, too, when I started bringing them in from home, but he did not know how reliable my work was; Prof. Hobbs was a facilitator/editor of publications that originated within his group.  He also did not allow papers to go out from his group without his purview.  While improving drafts submitted to him, he usually became a co-author, and sometimes the lead author, as on Hobbs and Rangno (1978, a reanalysis of the Skagit Project) and again on Hobbs and Rangno (1979, “Comments on the Climax and Wolf Creek Pass Experiments”).

The WCPE was the third in a trifecta of cloud seeding successes reported by CSU scientists that formed an imposing edifice of cloud seeding successes.  They appeared to reinforce one another, and the Climax experiments had been specifically called out by our best scientists as cloud seeding successes (e.g., the National Academy of Sciences (NAS) in 1973, Warner 1974).  Prof. Hobbs had been a member of the NAS panel that had praised the CSU cloud seeding work and it was also cited in his popular 1977 graduate level book with Prof. J. M. Wallace, “Atmospheric Science:  An Introductory Survey.”

Moreover, the WCPE cloud seeding success, whose preliminary results were being presented to the Bureau of Reclamation’s cloud seeding division in 1969, was the reason why the massive Colorado River Basin Pilot Project (CRBPP) took place centered on Wolf Creek Pass.  Greater potential increases in snow due to cloud seeding were being reported by CSU scientists in the WCPE as a characteristic of storms in southwest Colorado in the San Juan Mountains than in northern Colorado where their highly regarded Climax randomized experiments had taken place.

The CRBPP remains as the nation’s costliest randomized orographic cloud seeding experiment.   In my opinion, the Bureau of Reclamation made many efforts to “do it right” by randomizing it, having others who did not know the if a random decision had been called, measure the precipitation each day.

Prior to carrying out the reanalysis of the WCPE, I had been a forecaster with the CRBPP for all its operating winters from 1970/71 through 1974/75, the only meteorologist to have been with it the whole time.  I had been, Acting Project Forecaster during its first season following the departure of Project Manager, Paul T. Willis, and Assistant Project forecaster for the remaining seasons.  I drew the morning and evening weather maps3and made forecasts five days a week as Assistant forecaster, and seven days a week as Acting Project Forecaster for most of the 1970/71 season.[2]  Namely, I had something to do with most of the random calls for an “experimental day” in the CRBPP.

I knew I had to go to Banff or forever be noted as a coward and take whatever Professors Grant and Mielke delivered no matter how humiliated I might be.

—————–

There were no personal computers in those days of the mid-1970s, of course; I was using a $100 Texas Instrument handheld calculator for statistics and correlations from the dozens of pen-and-ink spreadsheets9 I had made copying raw data from the CRBPP, runoffs from geological survey books, and from NOAA Climatological Data and Hourly Data publications.  Sometimes I would have to enter a pair of numbers to get correlations three times if the second one didn’t produce the same result as the first cycle.  That, too, was a nightmare and so frustrating when it happened.

Due to that May 1979 program in BAMS, I redid the whole WCPE published paper from scratch thinking there must be a serious problem.  I didn’t find one, but still, I thought, SOMETHING must be wrong with it and I was going to hear about it at Banff!

———————

Some regrettable, necessary background that might have contributed to the BAMS program sequence I saw: payback?

A careless and inappropriate metaphor that I said to a newspaper reporter at the end of a recorded interview became a secondary headline in the Durango Herald newspaper in November 19754:

Cloud Seeding… Rangno:  ‘Watergate of Meteorology.’”

Since Watergate was a burglary by political actors, I had carelessly implied criminal activity had taken place in the reporting of CSU’s cloud seeding work!  Yikes!

What I had meant was that if the CSU work was overturned it would be a “big deal” since it had led to the funding of the massive CRBPP.  Watergate was on everyone’s mind in 1975, and what I said just came out without a lot of thought.

The reporter, Mike McRae for the Durango Herald, and who had told me after our long interview that I could review his article before it came out, canceled my pre-pub review the evening before, saying, “Trust me,  Art.”

I left for Fresno, California, the next day for short term employment with Atmospherics, Inc., a cloud seeding company, and did not see the Herald article until a week after it appeared.  It was sent to me by a Durango friend and E. G.&G., Inc., co-worker.

I couldn’t sleep after I saw it.

How that Durango newspaper headline happened: a cautionary tale for young scientists who might deal with the press. 

The reporter who recorded my November 1975 interview within the confines of the Durango Herald offices told me I would get to review his article before it appeared, an unusual offer.  I wanted to make sure that what I told him was accurately portrayed.  I had been cautious in what I said, and that was reflected in the full article.

However, the evening before it was to appear and a day on which I was traveling to Fresno, California, the reporter, Mike McRae, called to say that I wouldn’t be able to review his writeup beforehand after all.  He assured me it would fine with those magic words: “Trust me, Art.”

But after I saw it in Fresno, I couldn’t sleep, as you would imagine.  The body of the piece was accurate, but that secondary headline; oh my.  I was expecting to hear from CSU lawyers at any time!5

Why was I interviewed in the first place? 

I had previously written a critical piece concerning the obstacles to successful cloud seeding that were encountered during the CRBPP that perhaps McRae had seen in the spring of 1974 in a Telluride, CO, magazine, the Deep Creek Review.  Unknowingly, the reporter was also setting me up for publication of two contrasting views of cloud seeding; mine and the CRBPP Project Manager, Mr. Larry Hjermstad, a seeding partisan who went on to form a very successful cloud seeding company in Colorado, Western Weather Consultants.

I had no problem with the idea of, “contrasting views” when I saw the paper.  It’s what the public should see so that they can take the best path forward when there are questions about something.

Those nationally recognized CSU experiments, lauded by our best individual scientists and the National Academy of Sciences[3] itself, had led to the multi-million-dollar CRBPP, still the mostly costly such mountain cloud seeding experiment ever undertaken ($40-50 million in 2020 dollars).  So, in fact, it would be a scientific story of great magnitude if the CSU cloud seeding successes reported on many occasions in peer-reviewed journals, were illusory.

When I was interviewed in November 1975, the CRBPP had ended in the spring of 1975 without proving cloud seeding had increased snowfall.  It had been widely expected beforehand that the CRBPP would confirm the CSU results with as much as 50% increases in snowfall on seeded days and something like 250,000 additional acre-feet of runoff even though it had been randomized.

But instead of questioning the validity of the successes on which the CRBPP was based, it was believed, and published in the journal literature on several occasions, that it was the conduct of the CRBPP as well as design flaws that caused it to fail.  It was an odd interpretation to me due to the discrepancies in the CSU hypotheses revealed during the CRBPP.

However, blaming the faulty conduct of the CRBPP did remove blame from the sponsor of the CRBPP, the Bureau of Reclamation’s cloud seeding division, and the reviewers of those faulty manuscripts that allowed ersatz claims of great cloud seeding successes to reach the peer-reviewed journals in the first place.

When I next saw “Mike the Reporter” in a Durango supermarket, he advised me, “Never trust a newspaper reporter.”

Q. E. D.

——————–

Consequences of the 1975 Durango Herald article

Mike McCrae’s story was to have a major impact at CSU and was to save me a lot of work (at least for a while).  The story reached the National Science Foundation that had partially funded the prior cloud seeding experiments by CSU scientists.   They wanted to know from them, “What’s going on?”6

Moreover, I had stated in the Durango Herald article that I was going to reanalyze ALL three of the major CSU cloud seeding experiments!  What was I thinking?  I had no idea how much work that was going to be.  I just felt something had to be done by someone, even if it was by an under-credentialed weather forecaster.  But, I “knew the territory” and the weather patterns as a forecaster virtually like no one else.  And it was becoming clear that the ”narrative” for the failed CRBPP was design flaws and poor execution on the part of the E. G. & G., Inc. seeding team that I was a part of.

CSU scientists, perhaps concerned over an outsider reevaluating their experiments, beat me to it.

The Apology and Request for Data from Colo State University

After returning from Fresno, California in early December 1975, I drove to CSU to apologize in person for my newspaper gaffe to Prof. Lewis O. Grant, leader of the CSU seeding experiments. But I also went there to obtain data from their cloud seeding experiment at Wolf Creek Pass.  I had come to believe it was suspect as a success due to the many discrepancies and obstacles to cloud seeding that were encountered during the CRBPP.

Prof. Grant was extremely gracious in our meeting in accepting my apology and supplied the data I requested; he was that kind of guy.

Updating Prof. Lewis O. Grant on my reanalysis

 During the winter of 1975/76 and after my visit to CSU, I remained in Durango to work on the reanalysis of the WCPE, living off my savings (no skiing!).   I passed Prof. Lewis O. Grant, progress reports as I moved along on my reanalysis over the following two years. I had promised him I would do this when I met with him in December 1975 in exchange for the CSU data.

He was actually encouraging me as I forwarded my “progress” reports to him—yes, again, he was that kind of guy.  Prof. Grant wrote at one point that I had found “something important” as the WCPE unraveled.   But after a while he stopped responding to my reports and I stopped sending them.

1976:  Joining Peter Hobbs’ Cloud Physics Group

By September 1976, after that self-funded “sabbatical” in Durango during the winter of 75/76, I had been hired by Prof. Peter V. Hobbs to be a part of his “Cloud Physics Group” at the University of Washington when a member of his airborne research group left.7

I had called Prof. Larry Radke in his group in August 1976 about the Cloud Physics Group’s airborne study in Durango that had taken place during the spring of 1974.  Prof. Radke informed me that there was a job opening in Prof. Hobbs group and, “Was I interested in applying for it?”  I was, and I was interviewed over the phone by Prof. Hobbs soon afterwards and got hired!

In August I was hired into his group as a “Flight Meteorologist” taking the place of Mr. Don Atkinson who had resigned to go back to school.  I also had an offer from Atmospherics, Inc., to work more short-term cloud seeding programs for them around the world.

I took the offer from Prof. Hobbs.

I wasn’t sure I was skilled enough to be in academia under a world class scientist like Prof. Hobbs.  I wasn’t sure, either, how I would do flying in their 1939 manufactured B-23 research aircraft.  I had been on one of their flights during their 1974 research project in Durango and, surprisingly,  didn’t get motion sickness.

I started at the University of Washington in mid-September 1976, and continued to work with the data of the Wolf Creek Pass experiment at home and on my own time at the UW.  Prof. Hobbs, ebullient about cloud seeding at the time I arrived due to just having finished the successful “Cascade Project,” a non-randomized seeding experiment, took a great interest in the drafts of manuscripts I began to bring in, editing them and revamping them, namely, using his great skills to improve my drafts.

Prof. Hobbs had just been a member of the National Academy of Sciences (1973) and in composing their optimistic report on the Climax, CO, experiments, had written a similar optimistic, “Personal Viewpoint” in 1975 in Sax et al.’s review of weather modification in the J. Appl. Meteor.

Banff:  The Nightmare Ends

In a hallway of the convention center in Banff where the talks were going to be given, I ran across Prof. Grant coming my way the evening before my talk.  He said, “Art, I’m not even going to talk about Wolf Creek.”  I was relieved but wasn’t sure what was going to happen.  I still don’t know why Prof. Grant or Dr. Mielke didn’t tell me this months or weeks in advance.  I was their nemesis, of course, and maybe it was as simple as that. Or, maybe I was being punished for the awful Durango Herald headline?  Who could blame them?

The next day despite what Prof. Grant had said, I was so nervous and sweating before my talk, that I grabbed a can of deodorant and sprayed my hair and forehead with it by accident before walking over to give it.  I thought I had grabbed a can of hairspray!

I opened my talk by telling the 300 or so scientists in the “joint meeting” audience that Wednesday about what I had done due to my nerves, spontaneously using it as my intro at this, my first conference presentation.  I followed this with a quip, “At least now my forehead won’t sweat.”  It got a good laugh, I relaxed some, and got through the 10 min talk that had caused so much stress beforehand.

I ended my talk on what I hoped was a conciliatory note: “Who wouldn’t have believed that all this wasn’t due to cloud seeding?”, referring to the large runoff anomalies of the three seeded seasons of the WCPE reported by Grant et al. 1969, later by Morel-Seytoux and Saheli (1973).  The chances that they were due to natural causes could be rejected with a 99% confidence level (the same level as the Skagit Project that was also misperceived as a cloud seeding success).

But, soberingly enough, it was beyond a doubt that natural storm factors are what had created those WCPE runoff anomalies that looked so much like the result of cloud seeding.  The key mistake by the experimenters in both the WCPE and the Skagit project s was NOT declaring controls in advance of operations.

It was at this meeting that Dr. Paul Mielke, Jr., told me later that, “we screwed up.”  What a terrific guy he was to say that!

Banff ended on a high note.  I often think how horrible it would have been if I had, indeed, “chickened out” due to the recurring fear I had after the Banff program came out.

October 1979:  All that the CRBPP had been based on was gone after Banff

 Retraction of the of the key Climax, CO, randomized wintertime cloud seeding successes first appeared in March 1979 (J. Amer. Stat. Assoc. by Prof. P. W. Mielke, Jr.); the results appeared to be part of a statewide pattern and not localized to Climax.   The results were verbally retracted by J. O. Rhea at Banff in October 1979.8  This occurred after so-called “downwind” increases in snowfall on the same days as seeding had seemed to have increased snow so much at Climax were found to be due to a natural bias.  Upslope winds that favored more snow on seeded days at downwind locations from Climax were more prevalent on those days (Meltesen et al. 1978) compromising the downwind seeding claims.

So, within six months in 1979, March through October, all that the CRBPP had been based on, which included my WCPE reanalysis published in May, was gone!   It can be argued that Mike McRae’s 1975 article set off a major chain reaction.

It was regrettable that the 1979 Banff program summary by Semonin and Hill, finally published in 1981 in BAMS, failed to acknowledge the historic retractions, or the critical unreliability of the Climax experimenters’ claims about cloud top temperatures that was presented by Prof. Hobbs.  Perhaps Semonin and Hill did not actually attend the conference?  Or forgot what had taken place?

However, Semonin and Hill, while missing those key elements, did take note of the historic “leafletting” of conference attendees by the CSU experimenters.  In their leaflet they claimed that the Hobbs and Rangno (1979) critique of the foundations of the CSU experiments got it wrong and defended their work. This is the only conference that I know of in which pre-session conflictive leafletting has been conducted.

The emotions surrounding journal work done on your own time and initiative

I am guessing that many young scientists, excited about their work, have had this experience with their first manuscript.

The manuscript of the WCPE reanalysis was sent out in March 1978, almost two and a half years after I began working on it in November 1975.  Prof. Peter Hobbs took a great interest in my unfunded work once I arrived in his group and told him about it after I was hired in September 1976.

Prof. Hobbs did not permit articles to be submitted to journals from members of his group without his going over them.  Due to Prof. Hobbs experience and editorial gifts, the drafts I brought in from home were steadily improved.

I had even done my own drafting of all of the 21 figures in the WCPE reanalysis, to give you an idea of the magnitude of this overall effort that I was so bonded to.  Here’s an example of one I did from the 1979 WCPE reanalysis publication:

As anyone could imagine, doing your own research, drafting your own figures, brings more “ownership” and emotional attachment than might be the case with funded research. This became only too clear when the long-awaited reviews of my reanalysis of the WCPE came back in a manila envelope in August 1978, sent from Dr. Bernard A. Silverman, the editor for this manuscript for the Amer. Meteor. Soc.’s Journal of Applied Meteorology.

It took me a week to open that envelope.  More palpitations; would my manuscript be rejected or accepted?

Eventually, I opened it and read the first review that Dr. Silverman had placed on the top of what turned out to be three reviewers’ assessments of my manuscript.

That first reviewer recommended, “reject.”

The reviewer had written that I had no business doing a reanalysis of the CSU work; I didn’t have the background to do it and the paper should be rejected.  There was no real criticism of the contents of my manuscript. Nevertheless, I wept uncontrollably, shaking; I was going to fail in my monumental effort.

That “reject” reviewer was only too correct concerning my lack of a technical background to do what I had tried to do. But it was also clear to me after several years after 1975, that a better credentialed researcher was not going to be looking into the original CSU experiments the massive CRBPP had been based on.   That would have been risky.   It was much better for all involved to walk away from the CRBPP, claiming it was not conducted properly, rather than to learn that millions were spent conducting it due to prior reports of cloud seeding increases in snow that were illusory.

 I showed a graduate student friend, Tom Matejka, that first reviewer’s reject letter.  Tom, laughing, drew the following cartoon of how he thought that reviewer saw me:

 I still treasure this political cartoon by Tom.

But, unknown to me at this same time, CSU cloud seeding researchers were on the brink of retracting their results for the more prestigious Climax experiments.

My five-season experience as a forecaster, and having worked under orographic precipitation specialist, J. Owen Rhea, during the CRBPP gave me the knowledge and wherewithal to do it.  It may sound “crackpotty”, but I felt I had a responsibility to do it since no one else was going to and I “knew the territory.”  I couldn’t just walk away from it.  All that was learned during the CRBPP strongly suggested there could not have been snow increases due to seeding in the prior CSU experiments.

============

It took me about another week to look at the other reviews contained in that manila envelope Silverman had sent as I pondered the size and effort I had put into what surely was going to be Anand content in  enormous failure.  I am sobbing right now remembering that time; tears flowing!9 Where did this come from?  I haven’t thought about this chapter of my life in decades, but it’s like the same exact feelings I had so long ago have body-slammed me as I write about them!  Maybe I need a grief counselor…

When I finally had the courage to look at the other reviewers’ assessments, they both recommended, “accept” with revisions.

I wept uncontrollably again.  I was going to “get in” after all, though it would now be without Prof. Hobbs purview in carrying out “revisions” required by the reviewers.   Why did Prof. Hobbs wash his hands of my effort at this point?  Answer:  over the placement and content in an acknowledgement.

————

Professor Hobbs washes his hands of the WCPE manuscript before the final submission

By the time that the reviews had come in, Prof. Peter Hobbs had washed his hands of my manuscript.  Prof. Hobbs had written an acknowledgement for himself and had placed it ahead of that for J. Owen Rhea whom I had originally placed first.  Owen Rhea was the initial lead forecaster for the CRBPP, and later, Acting Project Manager under whom I worked.  I had learned so much working for him concerning orographic precipitation patterns.  I don’t recall that I had thanked Prof. Hobbs in those early drafts after he improved them.  I only have a  1977 draft, prior to Peter’s scrutiny in which this acknowledgment appeared in which I REALLY wanted to thank the CSU’s Prof. Grant and his staff:

“Acknowledgements. The author would like to thank Paul Willis of the National Hurricane Research Laboratory and Dr. J. Owen Rhea of Colorado State University who, as Project Manager and Project Forecaster, re­ spectively, for the first season of the Pilot Project, provided many insightful and illuminating discussions of the Colorado State University cloud seeding experiments which helped inspire this paper. I would also like to thank Professor Lewis O. Grant and the staff of Colorado State University for their unhesitating cooperation and willingness to examine “both sides of the coin.” Appreciation is also given to Mr. Larry Hjermstad of Western Weather Consultants in Durango for his cooperation in providing climatological data and copy facilities at a low cost, and Mr. Travers T. Ward for copying it all.”

The 1979 acknowledgement in the WCPE reanalysis publication was this:

“Acknowledgments. The author wishes to extend his deepest appreciation to Dr. J. Owen Rhea for his in­ valuable encouragement, comments and criticism during the course of this research. Particular thanks is also due Professor Peter V. Hobbs whose cogent editing and restructuring of this paper greatly improved its presentation and coherence. A review by Dr. Colleen A. Leary also improved the intelligibility of this paper. I would also like to thank Professor Lewis 0. Grant and the staff of Colorado State University for their unhesitating cooperation and willingness to supply data and, other information relative to the WCPE.  Appreciation is also extended to the Bureau of Reclamation, Division of Atmospheric Water Re­ sources Development, and to Mr. Larry Hjermstad for supplying data relative to the Colorado River Basin Pilot Project. The author is also indebted to Mr. Travis T. Ward of Durango for his copying of the numerous copies of Climatological Data requested by the author.”

Peter Hobbs also suggested at one point that he would normally be a co-author after editing and improving the presentation of manuscripts like mine.  I didn’t take the hint; maybe I should have?

I journeyed on and the revised version of the manuscript went to the journal in the fall of 1978 without Peter Hobbs’ expert purview.  I had now alienated perhaps my only ally, certainly the most important one.

Speculation on the fallout from the acknowledgement kerfuffle with Prof. Hobbs

The above happenstance may also explain why Prof. Hobbs took first authorship on the reanalysis I did of the Skagit Project (Hobbs and Rangno 1978) done on my own initiative, but while at work in Prof. Hobbs’ group.  It was submitted to the journal after the WCPE manuscript was submitted but was accepted and published ahead of it. I then I became concerned that it might appear that Prof. Hobbs had directed me, a little-known player in the weather mod game, in the WCPE paper that was to follow.  It would make sense that a grand player in the weather mod arena like Prof. Hobbs had directed an under credentialed subordinate on how to reanalyze cloud seeding experiments.

An inappropriate authorship sequence was the case, too, in the work I did that undermined the foundations of the Climax and Wolf Creek Pass experiment that was published as, “Hobbs and Rangno” 1979, J. Appl. Meteor.  Prof. Hobbs even presented this work as a sole authored work at the International Conference on Cloud Physics at Clermont-Ferrand.   I acceded to these authorship acts, though they were unsettling.   Only recently did I blow a gasket when I discovered this caption under Figure 2 of Hobbs (1980):

Issues of credit and authorship within Prof. Hobbs’ group have persisted right up until today (2021), when a senior faculty member, formerly in Prof. Hobbs’ group, could not cite a paper on rainbands where Prof. Hobbs was the lead or sole author because he had not done the work and knew who did.  I know that a reader at this point would say, “Get over it!”  Sorry, can’t.


ALR, with a life story vignette by someone who only wanted to forecast weather when he came to Durango. Thanks for reading it, if you do.

==============FOOTNOTES========================

1An example of a pen and ink spreadsheet I did in the late 1970s for those younger researchers who can’t imagine such a thing. You can’t imagine how many of these kinds spreadsheets I did in support of the WCPE reanalysis!  Dozens at least. Bottles of Shaefer’s ink were consumed!

2I remembered, Ann Stone, and that third grade math humiliation where Ann was to add up a column of five of the same number, and I was to multiply that number by five, all this with both of us at the blackboard in front of the class.  I was to demonstrate how much faster multiplying something was than adding up a column of the same number.   I couldn’t do that multiplication while Ann finished quickly.

6J. O. Rhea, Prof. Grant’s grad student, personal communication,  1975.

3The Bureau of Reclamation specified that the seeding contractor, E. G. & G., Inc., personnel draw their own regional surface, 700 and 500 hPa weather maps rather than rely on National Weather Service facsimile maps. I was a good weather map drawer/artist.   Since it’s fall, I will use this map with a bit of humor in it.

4Recently, having a different perspective, I have deemed this Durango Herald article as a tongue-in-cheek, “Historic Moments in Weather History:  “Art Rangno EXPLODES onto the weather mod scene”, a title meant to generate a smile.    I was to work on reanalyses and critical commentaries on cloud seeding experiments for the next 45 years!  Still am!  What is the matter with me?  Get a life!  Haha, sort of.

5That was to happened later….several years later, and had to do with asking for an investigation of some possible real science crime; withholding results that might have prevented the multimillion dollar CRBPP randomized cloud seeding experiment from taking place.

7I was going to take the place of their, “Flight Meteorologist,” Don Atkinson, who later confided in me that he thought the job I was going to take, his, was a “dead end.”   Atkinson was resigning to go get his master’s degree in business administration. He eventually returned as the business administrator for the University of Washington’s Atmos. Sci. Department.

8Rhea presented for Grant et al. who was officially listed as the presenter.

9That surprise grief attack happened a few months ago when I first started rehashing this “life chapter” after forgetting about for so many decades.   I seem more inured to emotions about this as I go through  draft today.


Part 2: PETER HOBBS and me (contains irony)

Peter V. Hobbs became one of the most vociferous scientists to show that some published claims of seeding impact were exaggerated, false, or unverifiable.”

The above statement was contained in a flyer advertising the 2018 Peter Hobbs Endowed Lecture1 at the University of Washington by a leading scientist in weather modification.  This account focuses on the word, “became” in this flyer, and why Peter Hobbs’ optimistic view of cloud seeding through the mid-1970s was reversed to the point that by 2001 he could refer to the body of cloud seeding literature as, “often unreliable.”

This account will explain how Peter came to be a critic of cloud seeding literature when he was so optimistic about seeding after his 1970s Cascade Mountains project.

I MUST write a soliloquy about my relationship with Peter V. Hobbs in the weather modification/cloud seeding domain, with the good and the bad even if nobody cares and nobody reads it but me.  Somehow doing this blog in the latter stage of life that I am now in gives me peace.  I have wrangled (“Rangno-ed”, haha) over this credit issue for decades without really doing anything.

Had criteria been in place such as that today used by Geophys. Res. Letts., shown below, authorship sequence would mean nothing.  Who did what would be right there for all to see!

At the same time, I don’t want to downgrade what Peter did, either.  I tried as hard as I could to write a draft of research findings that he could not measurably improve.  I never could.  I was crushed when my marked up draft from Peter come back, but I was able to see how he had improved it.  He performed miracles of clarity to what I wrote.  And that’s why I would add another element to the Geophysical Research Letters’ author contributions example here from the 2022 article, “Tree Rings Reveal Unmatched 2nd Century Drought in the Colorado River Basin:

“Author Contributions:

Conceptualization:

SubhrenduGangopadhyay, Connie A. Woodhouse,Gregory J. McCabe, Cody C. Routson, David M. Meko

Data curation: Subhrendu Gangopadhyay

Formal analysis: SubhrenduGangopadhyay, Connie A. Woodhouse, Gregory J. McCabe, Cody C. Routson, David M. Meko

Investigation: Subhrendu Gangopadhyay, Connie A. Woodhouse, Gregory J. McCabe, Cody C. Routson, David M. Meko

Methodology: Subhrendu Gangopadhyay,  Connie A. Woodhouse, Cody C. Routson, David M. Meko”

I would add, for situations that others might have that are similar to mine, this:

Editing; improving clarity of material:

____________________

==========================

In September 1976 when I joined Peter’s group, I brought “insider” information to him that was to impact his then optimistic views of cloud seeding experiments in Colorado conducted by Colorado State University (CSU) scientists.  From 1970 through 1975, I had been the Acting Project Forecaster and Assistant Project Forecaster with the nation’s largest ever randomized orographic cloud seeding experiment, the Colorado River Basin Pilot Project (CRBPP).  The goal of that sophisticated experiment was to replicate the large percentage increases in snow that Peter and the scientific community had believed to have been brought about by cloud seeding in randomized orographic experiments at Climax and Wolf Creek Pass, CO.

Also, when I arrived, Peter and his group were in the “afterglow” of the Cascade Mountains seeding experiments that produced a tremendous amount of information about storms published in numerous journal pages describing that experiment.  Peter had also contributed his optimistic view of cloud seeding in his “personal viewpoint” editorial in Sax et al. 1975 and in his book with Prof. Mike Wallace in 1977.

Peter, too, as a panel member of the NRC-NAS (1973) review of climate and weather modification, had seen to it that a non-randomized cloud seeding experiment in the northern Cascades, the Skagit Project, was included as a cloud seeding success into the Panel’s review.  It sure looked like one.

By 1976, however, I was a person who could no longer trust peer-reviewed published cloud seeding literature as Peter did.  Peer-review in science is supposed to eliminate false claims.  This reversal of an idealistic attitude about science occurred when I saw false claims published in a peer-reviewed journal, ones that even the authors knew were false!

What was truly troubling to me, as much as seeing false claims published, was that scientists who knew that false claims had been published, did nothing to correct them in post publication “Comments.”  The silence was deafening.

While Peter Hobbs was optimistic about cloud seeding, I was laying out the problems that were being experienced in the CRBPP, as shown in the two articles in the Appendix of this summary, one appearing in the Telluride, CO, magazine, “Deep Creek Review,” in the spring of 1974 and the second in the Durango Herald newspaper in November 1975.  In the latter article I announced that I was going reanalyze all the CSU cloud seeding experiments!  I had barely started on one when I made that overzealous statement!

In the spring of 1974, I had a chance to visit/rant “big time” about the many problems that the CRBPP was experiencing to Peter’s B-23 aircraft group during their six-week investigation of seeding plumes and of the cloud microstructure over the San Juan Mountains, the target of the CRBPP experiment.  I was the Assistant Project Forecaster with the CRBPP at that time,  and was to be the only meteorologist with that project during its entire five winter seasons.  The Washington group was led by Prof. Lawrence F. Radke during the first two weeks, and the last four weeks by Mr. Don Atkinson.[2]    One member of Peter’s group was James Rodgers Fleming (who was to make a name for himself writing a history of early cloud seeding in the United States (Fixing the Sky) and writing a biography of the life of Joanne Malkus Simpson).

The Washington group had been contracted to do this work by the sponsor of the CRBPP, the Bureau of Reclamation’s Division of Atmospheric Water Management, its cloud seeding arm, to find out just what was going wrong with the attempt to replicate the Colorado State University cloud seeding experiments.  The Washington group issued their report the following year (Hobbs et al. 1975).

One of the major conclusions in that report was that the ground released seeding material was not reaching the clouds on stably layered days or reached the clouds too close to the target to effect a snowfall on it.

The problem of deeply stabled layering during storms whose properties matched thos for an experimental day in the CRBPP had already been called out for the BOR in the seeding contractor’s report at the end of the very first season (Willis and Rangno 1971).

The presence of those deep stable layers was one of the issues that led me to believe that the increases in snow reported by CSU scientists from the published results of their experiments could not have happened.  Rather, it seemed more likely to me that a lucky draw of storms on seeded days must have produced the appearance of seeding-induced increases in snow in those benchmark experiments.

Irony

After joining Peter’s group, I was quickly sensitized to an appropriation of credit issue within his group that led to bitterness in some members.  One member pawed a sole authored Cascade experiment by Peter Hobbs, titled, “Natural Conditions”, and muttered, “all my work.”  Next, in reading another paper about the Cascade experiment, he erupted with, “That’s not what we found!”

Oh, me.

Here I was coming from the dark side of weather modification I experienced in Durango, to another form of the “dark side” of science.  How ironic this seemed at the time, from one frying pan and into another.

I was to overturn, usually with Peter Hobbs as a co-author, faulty claims of cloud seeding successes in Colorado and Israel, and the false hypotheses behind them in the published literature over the next 20 plus years.

Even today, yours truly has a manuscript on the history of the CRBPP cloud seeding experiment, co-authored with Dave Schultz, Chief Ed., Monthly Weather Review, currently in review at the J. Appl. Meteor.

More irony

Every experiment that I exposed as faulty, Peter Hobbs had previously passed positive judgment on the Climax experiments, the Wolf Creek Pass experiment, the Israeli experiments, and the Skagit Project.  Peter read journals, believed what they said, and took those findings prima facie, as most scientists would do.  I had left that motif behind in Durango; the cloud seeding literature just could not be trusted if a success was reported.

That last experiment in the list above, the Skagit, a non-randomized one, was one that Peter himself had interjected into the NAS-NRC 1973 review of cloud seeding because he thought it so legitimate a seeding success.   It certainly looked that way in the journal article about it by Hastay and Gladwell (1969).

In 1977 or so, we were going to propose a randomized cloud seeding experiment I had designed in the Cascades to the National Science Foundation using aircraft to seed a small watershed.  Since airborne seeding would be far more expensive than ground seeding, I figured I had better look into the ground seeding effort of the Skagit Project, that appeared to have produced such a tremendous success in a small region of the Skagit River watershed.

Result:  I overturned the Skagit Project that Peter thought so highly of in less than three days!

The reanalysis of the Skagit that I produced with its many river plots, however, was published as “Hobbs and Rangno (1978),” leading one faculty member within his to say to me that, “Peter stole that paper.”  This was the first appropriation of credit that I was to experience of several that followed.  Peter, of course, as a great editor, improved the organization and drafts I brought him, always.

But why would a leading scientist and faculty member at a prestigious atmospheric sciences department, like Peter Hobbs was, want to do this; take from his staff members and graduate students in his group and make it appear that he did things he didn’t do?  My reanalysis of the Wolf Creek Pass experiment had yet to be published although it had been accepted by the Journal of Applied Meteorology prior to the journal appearance of, “Hobbs and Rangno” Skagit reanalysis.  Since the Skagit reanalysis came first, I wondered whether it would it look like Peter had instructed me how to do the Wolf Creek Pass reanalysis?

The good in working with Peter Hobbs was that he supported my research, most of it unsettling the paradigms of the day, whether it was in the cloud seeding arena or in the formation of “secondary” ice, or reporting that an aircraft can produce ice in clouds at temperatures around -10°C, or in suggesting a previously unused tool (mm-wavelength radar) for the detection of cloud seeding effects.  Peter seemed to like it when his workers produced research that questioned the existing paradigms, and he was good at seeing that those controversial manuscripts got published.

The bad was that Peter took credit for the original work that I did during my first nine years in his group.  Here is clear example that occurred in a sole-authored paper Peter presented in 1980 at Clermont-Ferrand, titled, “Lessons to be learned from the recent reanalyses some cloud seeding experiments,” my reanalyses in fact.   From this paper is his Figure 2 with his appropriation of credit highlighted, similar to that concerning my Skagit Project reanalysis two years earlier:

I initiated and carried out the precipitation-per-day (PPD) climatology at the Colorado stations shown in Figure 2b and 2c most of that on my own time at home.  But here, Peter Hobbs takes credit for those datasets!   Why, oh, why couldn’t he be truthful about the origin of these “expanded data sets”?  Why wouldn’t he want to tell his audience, proudly, that a member of his staff did these studies, perhaps even mention his name?  Its incomprehensible to me.  I only discovered this appropriation recently.  As a forecaster with the CRBPP, I came to see “in person” how those PPD graphs by CSU scientists were not representative of the true PPD climatology.  And, of course, why wasn’t I at least a co-author of this pre-print?

Sure, its ONLY a pre-print that probably no one remembers but me, but still……

Returning to the CRBPP and my background before arriving in Peter’s group

The CRBPP was a sophisticated experiment that attempted to replicate the results of those earlier Colorado experiments Peter so highly regarded.  And I had information that cast doubt on the prior experiments that was not getting out to the science community (but should have).  Instead of questioning the original experiments, the scientific community was told that the CRBPP was operated incorrectly, and that was what caused the failed replication of the CSU successes (e.g, Elliott et al. 1978).

Before coming to Peter’s group, and after the CRBPP ended, I began working on a reanalysis of one of the Colorado experiments in the winter of 1975-76, the one at Wolf Creek Pass that led to the location of the CRBPP in southwest Colorado.   I lived off my savings in Durango to do so (hah, no skiing, either!)

I felt that I had the skill to reanalyze one or all the prior experiments on which the CRBPP was based with my background knowledge of weather patterns in the Southwest; from what I had learned about orographic precipitation from J. O. Rhea, the first Project Forecaster of this large experiment whom I worked under in my first season.   Rhea’s orographic model work eventually formed the basis of today’s PRISM graphics for average precipitation in the US and his work also formed the basis of flood forecasts by the California and Nevada River Forecast Center.

Because Peter Hobbs was malleable when new facts came in, he was able to move away from his position concerning those Colorado cloud seeding “successes” after I arrived in his group.  The change in Peter’s opinion was due to the drafts of the reanalysis of one of the so-called successes, that at Wolf Creek Pass, which also included an exposé of the faults in the hypotheses of the CSU scientists (Rangno 1979, Hobbs and Rangno 1979) that seemed to have explained why cloud seeding had increased snow in their experiments.

With Peter almost always as a co-author, I was to publish cloud investigations, and several reanalyses that eviscerated seemingly solid cloud seeding successes  them until the mid-1990s.  All these papers that concerned overturning cloud seeding “successes” were almost all unfunded, done on my own “time and dime,” not on university grant monies with the exception of the Skagit reanalysis.  Perhaps due to so much of my own private time that was sacrificed in these efforts, ones I deemed altruistic, I have a great sense of ownership about them.

Investigating the high concentrations of ice sometimes found in clouds with slightly supercooled tops (~-4°C > -10°C): going against the consensus

Peter also supported my “outlier” conclusions on another topic: the main cause of the development of “secondary” ice in clouds.  The explanation that has the most credibility even today is called Hallett-Mossop, “riming and splintering” process.   However, it did not appear to explain the rapidity of ice development in the slightly supercooled clouds that I sampled in the coastal waters of Washington State, though it surely played a significant role.

This mechanism was discovered in laboratory experiments by Hallett and Mossop 1974; Mossop and Hallet 1974, and confirmations of its effect in real clouds are innumerable, hence, “going against the grain.”  In fact, those findings were so outrageous and controversial that two of the best cloud scientists in the field, Prof. John Latham and Alan Blyth, the latter a friend, couldn’t take it any longer.  They posted a brief journal criticism concluding that me and Peter were wrong in those conclusions that downplayed the Hallett-Mossop riming splintering phenomenon as the major cause of the ice we saw.  The 1998 journal article by Latham and Blyth was titled, “The glaciation papers of Hobbs and Rangno.”  (I was so excited to see a journal title with my name in it I sent a copy of it to my mom! ) We (Hobbs and Rangno) did respond to the comments of Blyth and Latham in the same journal issue, defending our position.

I flew research flights as the Flight Scientist or Flight Meteorologist into hundreds, perhaps thousands, of shallow Cumulus clouds that formed lots of ice and wrote drafts of my findings that Peter enhanced.  Peter rarely flew on research flights until after 1990, especially the turbulent Cumulus flights, but rather worked on drafts of science papers by his staff and graduate students so that journal articles were churned out as efficiently as possible.  Peter acted as a sort of filter for all the many papers that were specialties of his group:  synoptics and rainbands, aerosols, and cloud microstructure.  Peter put his staff and students’ manuscripts in the best possible shape for journal acceptance.

Peter also did not allow papers to go out of his group without his purview.  But I did do that on several occasions when he was on sabbatical in 1983.  Doing that caused problems between us.  The motivation for me was that I felt it was a time I could have a real impact and could get away from the impression that Peter was directing my work.  I submitted no less than three manuscripts in 1983; on the clouds and cloud seeding in Israel, a reanalysis of the Climax experiments starting from raw data, and a “Comment” on the reporting of the Climax experiments.  All three were rejected or asked to be withdrawn (the “Comment” manuscript), but significant elements of them were published later under Peter’s purview (e.g., Rangno and Hobbs 1987, 1993, 1995a, 1995b).

My job sampling clouds to explore the development of ice in them was perfect for me.  I had been writing about visible ice in clouds, keeping diaries of clouds since I was a little kid and had learned about the importance of ice in rain formation from books my mom bought for me when I was growing up. Too,  I chased desert thunderstorms in the high desert of southern California, and even Hurricane Carla in 1961.

So, being in that research aircraft of Peter’s, a B-23 Dragon with a viewing dome on top of the fuselage, chasing small ice-forming Cumulus and Cumulonimbus clouds in the Washington coastal waters and elsewhere, was exactly right for me.  I loved my job, with one exception that was to be a growing problem over my first nine years.

Peter’s Science Training in Britain: How It May Have Caused His Problematic Authorship Determinations

Peter Hobbs trained at Imperial College in England under Sir B. J. Mason, a renowned cloud physics expert whose book, “The Physics of Clouds,” is standard reading for those interested in that topic like me2.  Peter had a methodology of authorship and appropriation of credit for the research done in his lab group that was said to have been one that was practiced in England, perhaps under Mason.  Peter often automatically took first authorship on papers that exited his group to journals.  That practice caused problems with the faculty, students, and staff periodically over the years.  And, eventually for me.  Some left his group in bitterness, and to this day, one faculty member doing a review of rainbands,  could not cite a Hobbs paper that he knew was mainly done by someone else.

Peter often took first authorship, too, on work that he did not personally analyze, though it was usually collected during field programs under National Science Foundation grant proposals that he and his faculty staff wrote and got funding for.  This was a factor in Peter taking first authorships.  Moreover, the data gathered that his students or faculty in his group used was obtained by the aircraft that Peter had gotten funding for through the NSF.

English astronomer, Anthony Hewish comes to mind and the story of the discovery of quasars for which Hewish got the Noble Prize, leaving without mention, the actual discoverer, Jocelyn Bell, who worked for Hewish and used his equipment in that discovery.  The “lab chief” problem of credit issues has also been long discussed as a problem in the US in books about science (e.g., Broad and Wade 1982, in their chapter, “Masters and Apprentices.”)

I eventually resigned in protest over the issue of credit after more than nine years in Peter’s group from a job, a university, and the people I worked with that I loved seeing every day I went to work.  It was a painful loss for me, but I felt I had to make a strong statement.  Ironically, we had reconciled over a paper via mediation by Department Chairman, Mike Wallace.

But then there was another credit issue just weeks after that which ended up being the final straw.   I resigned, submitting a 27-page letter describing all the issues that had troubled me, but had internalized over the years since I joined his group.

But, over a two-year period, Peter and I slowly reconciled.   I was hired back in December 1987 and worked with Peter for another 18 years!   Such reconciliations probably don’t happen too many times in real life, but I loved what I had done before, and jumped at the chance to return and fly into clouds once again when a graduate student suddenly quit Peter’s group.    Peter and I went on to publish several significant papers in ice formation (I think), and a comprehensive look at the cloud seeding experiments in Israel that drew a lot of journal attention.

Authorship sequence was never an issue again after I was rehired.   Sometimes we just alternated lead authorship for no particular reason even though I was the “grinder,” producing results from project research flights.  I wasn’t so concerned about credit anymore for those papers, at least outside the Cumulus cloud realm that was my specialty.

The last conflagration before being re-hired; it was a doozie

That last conflagration was in January 1987.  Peter tried to usurp my long held view on the clouds of Israel being incorrectly described in a letter to Prof. Abe Gagin, leader of the Israeli experiments.    In his letter to Prof. Gagin in, he indicated to him that he already knew what I was reporting in the accompanying manuscript that was sent.

This was blatantly untrue, as were several elements.  Here is his letter to Prof. Gagin on 12 January 1987.  It should be note that I am NOT an employee in his group, nor of the University of Washington at this time.   I was therefore livid about his statement concerning my communications  with S. C. Mossop, Roscoe R. Braham, Jr., Gabor Vali, and to Peter himself and Prof. Larry Radke during my time in Israel and afterwards.

In fact, a few days before I left for Israel on my cloud investigation in 1986, I met with Peter, and he accused me of being “arrogant” for thinking I knew “more about the clouds of Israel than those who studied them in their backyard.”

His statement was humorous and sad at the same time, but it also made me angry that Peter would lie to Prof. Gagin that he suspected what I found out about the clouds of Israel was what he already knew; that those clouds were not as Prof. Gagin had been describing them.

But again, why, oh, why would Peter want to do this to someone who has spent so much his own time and money in an altruistic effort to correct a faulty cloud assessments?  That 11-week trip to Israel cost me about $4,000 in 1986 dollars!

Once arriving home from Israel, I worked on producing a manuscript with figures I myself drafted the rest of 1986, living solely off my savings; in other words, a year of sacrificed income as well!  I was driven to expose those faulty cloud reports that was costing Israel so much in wasted cloud seeding efforts as I saw it.

Too, Peter had apparently forgotten about my manuscript on the clouds and cloud seeding in Israel that was submitted in 1983 while he was on sabbatical in England.  That short paper concluded the clouds of Israel were not as they were being described by the leader of cloud seeding program in Israel.  I had done my homework on his cloud reports in the literature independent of Peter, at home, on my own time.  But what I was reporting in 1983 was unconvincing and inconceivable to three of the four reviewers and it was rejected (Prof. Gagin himself was one of the “reject” reviewers he told me in 1984.)

In his January 12, 1987, letter to Prof. Gagin, Peter reminded him that he had raised questions with him at his 1980 presentation (in Clermont-Ferrand, France).  Peter does not mention that he had asked ME to write down some questions for Prof. Gagin before he went to that conference!  I had just begun reading critically about those experiments after the dust had settled on the Wolf Creek Pass reanalysis and a journal “Comment” paper.   At this time, Peter challenged me by saying, “if I really want to have an impact you should look into the Israeli experiments.”

So, I did.  He must have realized that I had an interest and skill in seeing through successful cloud seeding mirages.

Why is this chapter of going to Israel to expose faulty cloud reports so important to me, you may ask?

I considered my trip to Israel “historic” in the world of science.  Sounds crazy?  Here’s why.

I felt that what I was going to do when I went to Israel was analogous to what American physicist, R. W. Wood, had done concerning a new kind of radiation called, N-Rays that was being reported after the turn of the 20thcentury from a French scientist, Prosper Rene Blondlot.  Prof. Wood had gone to France, believing N-Rays to be a possible product of delusion and if so, expose it.  And that is what it was, N-Rays was product of delusion.

What Wood did is described in many books on science history, and was thus, “historic.”  This is because the N-Ray episode is considered by some as the greatest mass delusion in science history due to the number of published “confirmations” of a non-existent radiation.    I thought what I did in going to Israel paralleled Wood’s story.

The clouds described in support of cloud seeding successes in Israel, like “N-rays,” were, I believed, also non-existent.  And those, “fictitious” cloud reports from Prof. Gagin were accepted within the world of our best cloud seeding scientists!

And that’s what I felt I was doing in Rangno 1988, Quart. J. Roy. Meteor. Soc.) in my cloud exposé.   My findings that indicated that “ripe for seeding” clouds do not exist in Israel have been confirmed on many occasions since they were published.

Moreover, seeding to increase Israel’s water supplies ended in 2007 (2013?) after no increase in rainfall was found after 27 years of cloud seeding that targeted the watershed of their largest natural water supply, Lake Kinneret (Sea of Galilee).  A fourth long term, randomized experiment in Israel, Israel-4, ended after seven seasons with a null result in 2020.3  That spectacular null result after so much effort proved once again that the clouds of Israel contain too much natural ice for cloud seeding to be a viable method for increasing water supplies.

Thus, I couldn’t let Peter Hobbs’ claims go unchallenged.   After I reminded him about where his doubts came from about the clouds of Israel (me!), he replied formally to me in a letter that I was not to expect to work for him again.

I replied to his letter with my own long letter detailing what I had been telling him all along about the clouds and cloud seeding in Israel since the late 1970s!  His outgoing letter to Professor A. Gagin, the person responsible for describing fictitious, ripe for cloud seeding clouds, his letter to me in response to my reminding Peter where his information came from and that he had been clueless about the clouds of Israel before my trip, and my comprehensive letter to Peter reminding him of this.  These are displayed here for the purpose of documenting what happened.

Nevertheless, despite of Peter’s “won’t be hired again” letter in January 1987, I was hired back into his group in December 1987 when a grad student in his group working on ice in clouds suddenly left to take gainful employment.

We both realized that we made, for all our conflagrations, a good team.

===============FOOTNOTES====================

1I had volunteered to present this lecture with the subject being,   “The Rise and Fall of Cloud Seeding in Israel,” but was turned down.

2I bought the 1971 edition of B. J. Mason’s book while I was in Durango, CO and read it avidly.

3Journal results for this experiment, Israel-4, were published by Benjamini et al. 2023) .  The results of Israel-4 were reported to me in February 2021 from a media article in Hebrew prior to the appearance of Benjamini et al.  by Prof. Emeritus, Z. Levin, Tel Aviv University.

==============REFERENCES========================

Benjamini, Y, A. Givati, P. Khain, Y. Levi, D. Rosenfeld, U. Shamir, A. Siegel, A. Zipori, B. Ziv, and D. M. Steinberg, 2023:  The Israel 4 Cloud Seeding Experiment: Primary Results.   J. Appl. Meteor. Climate, 62, 317-327.  https://doi.org/10.1175/JAMC-D-22-0077.1

Blyth, A. M., and J. Latham, 1998: Comments on cumulus glaciation papers by P. V. Hobbs and A. L. Rangno, Q. J. R.  Meteorol. Soc., 124, 1007-1008.

Elliott, R. D., Shaffer, R. W., Court, A., and J. F. Hannaford: 1978. Randomized cloud seeding in the San Juan Mountains, Colorado. J. Clim. Appl. Meteor., 17, 1298-1318.

Hobbs, P. V., 1975:  The nature of winter clouds and precipitation in the Cascade mountains and their modification by artificial seeding.  Part I.  Natural conditions.  J. Appl. Meteor., 14, 783-804.

Hobbs, P. V., 1980:  Lessons to be learned from the reanalysis of several cloud seeding experiments.  Preprints, Intern. Cloud Physics Conf., Clermont-Ferrand, France, Amer. Meteor. Soc., Boston, MA, 02108, 88-91.

Hobbs, P. V., 2001:  Comments on “A Critical Assessment of Glaciogenic Seeding of Convective Clouds for Rainfall Enhancement.”  Bull. Amer. Meteor. Soc., 82, 2845-2846.

Hobbs, P. V.,  and A. L. Rangno, 1978: A reanalysis of the Skagit cloud seeding project.  J. Appl. Meteor., 17, 1661–1666.

Hobbs, P. V., and A. L. Rangno, 1979: Comments on the Climax randomized cloud seeding experiments J. Appl. Meteor., 18, 1233-1237.

Hobbs, P. V., L. F. Radke, J. R. Fleming, and D. G. Atkinson, 1975: Airborne ice nucleus and cloud microstructure measurements in naturally and artificially seeded situations over the San Juan mountains in Colorado.  Research Report X, Cloud Physics Group, Atmos. Sci. Dept., University of Washington, Seattle, 98195-1640.

Mason, B. J., 1971: The Physics of Clouds. Oxford University Press, 671pp.

National Academy of Sciences-National Research Council, Committee on Planned and Inadvertent Weather Modification, 1973:  Weather and Climate Modification: Progress and Problems, T. F. Malone, Ed., Government Printing Office, Washington, D. C., 258 pp.

Rangno, A. L., 1979: A reanalysis of the Wolf Creek Pass cloud seeding experiment. J. Appl. Meteor., 18, 579–605.

Rangno, A. L. 1986:  How good are our conceptual models of orographic cloud seeding? In Precipitation Enhancement–A Scientific Challenge, R. R. Braham, Jr., Ed., Meteor. Monographs, 43, No. 21, Amer. Meteor. Soc., 115-124.

Rangno, A. L., 1988:  Rain from clouds with tops warmer than -10° C in IsraelQuart. J. Roy. Meteor. Soc., 114, 495-513.

Rangno, A. L., 2000: Comments on “A review of cloud seeding experiments to enhance precipitation and some new prospects“. Bull. Amer. Meteor. Soc., 81, 583–585.

Rangno, A. L., and L. M. Hjermstad, 1975: views on the CRBPP, Durango Herald newspaper interviews.

Rangno, A. L., and P. V. Hobbs, 1980a:  Comments on “Randomized seeding in the San Juan Mountains of Colorado.” J. Appl. Meteor., 19, 346-350.

Rangno, A. L., and P. V. Hobbs, 1980b: Comments on “Generalized criteria for seeding winter orographic clouds.” J. Appl. Meteor., 19, 906-907.

Rangno, A. L., and P. V. Hobbs, 1981: Comments on “Reanalysis of ‘Generalized Criteria for Seeding Winter Orographic Clouds’”, J. Appl. Meteor., 20, 216.

Rangno, A. L., and P. V. Hobbs, 1987: A re-evaluation of the Climax cloud seeding experiments using NOAA published data. J. Climate Appl. Meteor., 26,757-762.

Rangno, A. L., and P. V. Hobbs, 1993: Further analyses of the Climax cloud-seeding experimentsJ. Appl. Meteor., 32, 1837-1847.

Rangno, A. L., and P. V. Hobbs, 1995a: A new look at the Israeli cloud seeding experiments. J. Appl. Meteor., 34, 1169-1193.

Rangno, A. L., and P. V. Hobbs, 1995b: Reply to Gabriel and Mielke. J. Appl. Meteor., 34, 1233-1238.

Rangno, A. L., and P. V. Hobbs, 1997a: Reply to Rosenfeld. J. Appl. Meteor., 36, 272-276.

Rangno, A. L., and P. V. Hobbs, 1997b: Comprehensive Reply to Rosenfeld. Cloud and Aerosol Research Group, Department of Atmospheric Sciences, University of Washington, 25 pp.

Rangno, A. L., and P. V. Hobbs, 1997c: Reply to Dennis and Orville. J. Appl. Meteor., 36, 279.

Rangno, A. L., and P. V. Hobbs, 1997d: Reply to Ben-Zvi. J. Appl. Meteor., 36, 257-259.

Rangno, A. L., and P. V. Hobbs, 1997e: Reply to Woodley. J. Appl. Meteor., 36, 253-254.

Rangno, A. L., and S. Suloway, 1974:  Pre-empting God, Deep Creek Review article on cloud seeding.

Sax, R. I., S. A. Changnon, L. O. Grant, W. F. Hitchfield, P. V. Hobbs, A. M. Kahan, and J. S. Simpson, 1975: Weather modification: where are we now and where are we going?  An editorial overview.  J. Appl. Meteor., 14, 652–672.

Willis, P. T, and A. L. Rangno, 1971: Colorado River Basin Pilot Project, Comprehensive Atmospheric Data Report, Phase II, Winter Season of 1970-71, Vol. I, Report to the Bureau of Reclamation, 71 pp.

Drizzle and Stratocumulus bonanza

No, this is not about Bonanza, the TEEVEE show, “Hoss”, or any of those ranching people, though that might be more interesting than a blog about clouds, gray ones.  First of all, the word, “bonanza” would be capitalized (its not on my view of this edit, FYI)  if this was a blog about it.  Second, there was no “Bonanza” episode about Stratocumulus and drizzle, another clue.

Your cloud diary, for those of you still reading this blog:

8:34 AM. An orographic layer of Stratocumulus tops Sam Ridge while a separate higher layer covering the whole sky sits on top of it. Neither one seem to be able to produce precip, ice or “warm rain”–precip without ice.
8:34 AM. Stratocumulus. Light rain is falling from them on the horizon. What does it mean? Those clouds over there are just that bit thicker, tops higher and colder. Could be a warm rain (no ice involved) or a case of “ice multiplication”, a still continuing mystery in the cloud and precip domain where more ice forms in clouds than we can explain. Mostly occurs when the cloud top temperatures are higher than -14°C to about -4°C. Ice crystals can be in tremendous concentrations in such clouds but we don’t know quite why yet. So, models that forecast rain and snow, as good as they are today, could be that bit better if they could accurately the ice in clouds in that cloud top temperature range I just mentioned a few paragraphs ago. That’s probably the biggest payoff for really understanding how ice forms in clouds. At the University of Washington, me and Peter Hobbs were reporting that the consensus theory on how ice formed in clouds was not capable of explaining what we were finding in the clouds we sampled with our aircraft. There was too much ice in clouds, and it appeared too fast. We were on the outside looking in and our whole body of work was criticized as being wrong by two of the great professors of ice-formation in clouds, Alan Blyth and John Latham in 1998. They used our names in the title of the article, too, “the glaciation papers of Hobbs and Rangno.”  I sent a copy to mom.  This is what happens when you’re not part of a consensus, you eventually get criticized royally because no one believes you, they think without commenting about it that your work is bogus. At the same time, it was truly GREAT that Blyth and Latham took time to look into all of our work since we scientists don’t do enough of that kind of thing, look into the work of others we suspect might be wrong. But over the years, the concensus about how ice forms in clouds has weakened and new factors are being touted as important players like drizzle drops that fragment or explode when they freeze because at certain temperatures an ice shell develops on the outside of a freezing drop, and then when the water farther in freezes and tries to get out because it wants to expand, it breaks the ice shell, and maybe spicule or ice splinter comes out helping to produce extra ice we call secondary ice particles since they didn’t form on an “ice nuclei”, something we have a though time measuring anyway. Fragmenting drops as they freeze has been known about for decades, but now its being thought that maybe a lot fragments result, not just a few as was thought before.  So those extra ice crystals end up creating concentrations of  ice crystals  we can’t quite explain in clouds here even in 2018,  such as those ones over there that were raining north of Saddlebrooke to bring us full round in this photo.  Caption too long?  Let us not forget that this site originated the practice of novella-sized captions.  I think many of you forget that a picture is worth a thousand words of caption, too.  Here, we’ve only managed a few hundred.
10:13 AM. Still raining way over there NE of Saddlebrooke and Bio2 if you look carefully, lower right. Can there be a better “classic” photo of Stratocumulus? I don’t think so. Cloud bases still running about the level of Sam Ridge, or about 3,500 to 4,000 feet above the ground.
10:05 AM, maybe. Stratocumulus clouds spewing drizzle precip roared out of the west in a band, now enveloping the Catalinas toward Pusch Ridge. Drizzle is pretty rare in Arizona, so I hope you noted it in your diaries yesterday. Means the clouds overhead have low droplet concentrations, and the larger drops are greater than about 30 microns in diameter, which are those sizes that when they bump together they can coalesce into a much larger drop that collides with more and more drops to form ones that can fall out of the cloud instead of just hanging around up there not doing much. We call that process the “collision-coalesce” process of rain formation, or “warm rain” process, one that doesn’t involve ice. The formation of ice almost never results in drizzle, hence (is that still a word?), why CMP thinks it was a warm-rain process yesterday over there. Also, drizzle is often think enough to make it look like its a snow shaft, which is what we see over there, too. But we know the freezing level was really high yesterday, so it can’t be snow over there. Nor are the clouds Cumulonimbus ones that CAN produce dense shafts.

Well, let’s move ahead to sunnier conditions, those pretty scenes we see on the mountains when a storm begins to clear out.

12:27 PM. As the Stratocumulus broke up, you got a glimpse of the deeper clouds north of Oracle that had been, and likely were still raining. Estimating depth here at about 2 km, or 6600 feet. With bases at 4,000 feet above ground, that would put the tops at only around 11,000 feet, too warm for ice since it would barely be below freezing at that height. Will check now to see if that statement is true.  Actually, the soundings from the U of AZ make it a little more ambiguous than what I was thinking about too warm for ice formation, and so there’s no point in showing those soundings where people might question what you just said.
1:19 PM. So pretty. I am a lucky man to see scenes like this so often.
1:29 PM. A cloud street with this fat boy formed off the Tortolita Mountains and it passed overhead of Catalina! I wondered if some big drops might fall out since it would be a Cumulus congestus if you could see it from the side, and with “warm rain” having fallen earlier, there was still a chance that the drops in this guy, toward the tops, would reach sizes where they coalesced into drops.
1:29 PM. Nice. One of our photo niches is cloud bases, and here’s one of the best. Am waiting outside for big drops, not Godot. Can’t go inside because they might only fall for a few seconds or minutes, it surely won’t be shaft.  And what if no rain had fallen earlier?  I might need to report a trace.
1:41 PM. It wasn’t too much longer the drops began to fall, finally thinking to get a photo in case no one believed me that rain had fallen from that cloud.
2:11 PM. Cumulus humilis and Cu fractus are all that remain of the gray skies of morning.
3:59 PM. Just enjoy.
6:37 PM. The sun, completing its weary journey around the earth, finally goes down.


The End

PS:  The agonizing delay from typing then seeing words appear 5-10 s after you stopped typing, disappeared when I jettisoned Firefox for Safari.  So, all these months of agony, were due to a Firefox bug, not a WordPress or GoDaddy hosting service problem.  Unbelievable.  This problem I think began when I downloaded the latest version of Firefox, which also came loaded with pop up ads and web site diversions it previously was free of.  Dummy me never connected it to the venerable Firefox web browser.   So, Firefox has been trashed from this computer!

“Deception at its finest”….a study in cloud perspective

I am sure that many of you saw this last evening:

4:17 PM. Line of spreading out Altostratus translucidus.
4:17 PM. Line of spreading out Altostratus translucidus.  Many of you might have added, “radiatus” to that cloud name.  “Clearly” it is widening as it passes over.

While I hate to embarrass cloud acolytes, here’s the simultaneous satellite view, courtesy of our Banner University of Arizona Weather Department:

AZC
4:00 PM AST. That line of ice cloud looks pretty straight doesn’t it? Imagine how wide a cloud would have to spread, after seeing that Altostratus photo, to REALLY be radiating, spreading out!

As Einstein wrote, “Things are not always as they seem.”

Q. E. D.

Now, for the snow report

…from the Lake Tahoe area (after all, we made a BIG DEAL out of the incredible NWS, Reno, forecast in the prior blogulation):

0822 AM     HEAVY SNOW       NORTHSTAR               39.28N 120.12W
01/11/2017  M42.0 INCH       PLACER             CA   PUBLIC

NORTHSTAR AT TAHOE REPORTED 42 INCHES OF NEW SNOWFALL IN  THE LAST 24 HOURS. 48 HOUR TOTAL OF 78 INCHES AND A 7 DAY TOTAL OF 122 INCHES1.

1This note passed along to the Arthur by Mark Albright.

Looks like a bite has been taken out of the Cal drought this water year, a drought it was said would take years to end!  Folsom Lake, near “Sacramenta”, Cal,  has risen 30 feet in the past 30 days! Oh, my.

Now for some more of them cloud pictures…

Been holding out as other chores fill up the day:

7:19 AM, Jan 10. Pretty Altocumulus, some Cirrus above.
7:19 AM, Jan 10th. Time seems to be standing still, as we look a a cloudlet spewing heavy virga.
Also 7:19 AM, Jan 10th. Time seems to be standing still, as we look a a cloudlet spewing heavy virga.
7:22 AM, Jan 10th, time moving ahead again. Close up of that Altocumulus with virga. Top must have been turreted, colder maybe a half hour or hour before this photo to have so much ice compared to its brethren.
7:22 AM, Jan 10th, time moving ahead again. Close up of that Altocumulus cloud with virga. Top must have been turreted, colder maybe a half hour or hour before this photo to have so much ice compared to its brethren.  That’s the learning part of this sequence.  Doesn’t look like an artifact from an aircraft because there is droplet cloud at the top, and not just a clear spot, which usually happens when an aircraft makes ice in a “supercooled” droplet cloud.
5:14 PM, Jan 10th. THought this was a neat scene, Cirrus uncinus, the long trail of ice crystals falling behind, the overhead view.
12:57 PM, Jan 8th. Makes you want to cry... This Cirrus spissatus is trying so HARD to be a precipitator to the ground, and doesn't know that those bottom ice crystals are evaporating 25,000 feet above it.
12:57 PM, Jan 8th. Makes you want to cry… This Cirrus spissatus is trying so HARD to be a precipitator all the way to the ground, and doesn’t know that those bottom ice crystals are evaporating 25,000 feet above it.

The weather just ahead

U of AZ latest mod output (from 11 PM AST last night) has a substantial rain on the doorstep.  Starts here in Catalina Saturday afternoon with projected totals over half an inch nu mid-day Sunday.  Check it out:

Totals valid at 11 AM AST, Sunday, Jan. 15th.

HECK, this storm wasn’t even predicted 10=12 days ago!  The major weather change was indicated about the 20th, plus or minus a day.  Those storms, indicated in the NOAA “spaghetti” plots more than 12 days ago, are still in the pipeline after we have a brief “recovery” from the “surprise” storm about to arrive on Saturday!  Yay.

This sequence of storms is so great for the AZ water situation, too, as well as giving it to Cal good again around the 20th as well.  No doubt, as the humans we are, the peoples of Cal  will be complaining about TOO MUCH WATER!

This will lead to apathy about water issues, you can bet on it!  See the well-known “cloud seeding cartoon” about drought and apathy posted so many decades ago in a journal article on cloud seeding by editorial nemesis1, Bernard A. Silverman, J. Appl. Meteor.,
termed the “Hydro-illogic Cycle”:

Published in 1978, but was around in the cloud seeding culture for many years before that. Used without permission. hahaha
Published in 1978, but was around in the cloud seeding culture for many years before that. Used without permission. hahaha  I believe it was drawn by the founder of Atmospherics, Inc., Tom Henderson’s daughter.  Atmospherics, Incorporated performed numerous cloud seeding operations in the US and around the world beginning in the early 1950s.  Yours truly worked for them on several occasions in the  early 1970s as a “radar meteorologist” directing seeding aircraft.  Later, I became a published critic, mostly with Prof. Peter V. Hobbs,  of a number of cloud seeding projects.

The End
——————————-
1Nothing yours truly submitted during the era of BAS as Editor of the J. Appl. Meteor. “got in”, including the benchmark paper reporting that our own aircraft was creating ice in clouds at temperatures as high as -8° C.   Three sole-authored papers critical of cloud seeding that I submitted were rejected in 1983 alone!  All or parts of them were published years later.

The paper on our aircraft, submitted originally in 1981, was rejected twice before being accepted and published in 1983. The effect was confirmed in experiments conducted in the Mono Lakes area in 1991, by the president of Atmospherics, Inc. mentioned above! Aircraft produced ice particles at unexpectedly high temperatures is a now well-known phenomenon that researchers have to be aware of when re-sampling the same cloud with an aircraft at below freezing temperatures.

Soap box:  It really is the editor of journals that determines whether you’re going to get in or not. They know, or should know, those who are going to keep you out or not, those with axes to grind, and those who are more objective.  However, let me say this, I like Bernie.  Has a great sense of humor. Below, Bernard A. Silverman.  You can see the twinkle in his eye:

Bernard A. Silverman, publisher of the "Hydro-illogic Cycle" at the Cape Town, SA, WMO award
Bernard A. Silverman, publisher of the journal article containing the  “Hydro-illogic Cycle” cartoon at the Cape Town, SA, 2006 WMO award ceremony for achievements in weather modification.  He acknowledged in that  1978 article that he was a cloud seeding advocate.

Cumulus congestus cloud grows into a Cumulonimbus over Sutherland Heights! 0.45 inches falls in 20 min after transformation!!

Also, I am also posting way below a new (!) not-previously-published. but rather rejected- by-important-scientists-a-long-time-ago-manuscript FYI!

Very exciting! (Hah!)

Its published now, though, isn’t it???!!!

“Online.”

Its about science and how it works, and how it has failed;  examples given.   I put it down toward the bottom of a normal blog because I am shy.

——————————————-

Clouds from a few days ago, August 26th, now that the “choke point” in uploading photos to Word Press  has been, at least temporarily ameliorated.

Here’s the sequence as a great cloud bottom drifted toward us from Pusch Ridge on the afternoon of the 26th.  If you saw this coming, you should have been clearing channels around the house for excessive water flow.  I forgot to.

Unloaded 0.45 inches at this site. 1.69 inches up on there on ol’ lady Lemmon. We sure needed this dump! Below, one of the great cloud bottoms of our time, that of a Cumulus congestus cloud, filled, as we say here, with rainy portent (maybe hail, too):

attachment4
1:44 PM, August 26th. Note just a tinge of shading on the right side. First drops, the biggest ones, or even hail stones are just coming out.
Attachment1
1:48 PM. Cloud beginning to bust open with rain now; updraft collapsing over there. Now its a Cumulonimbus.
Attachment2
1:53 PM. Nice shafting over there, but will the  cloud base overhead now split open  over us?
1:54 PM. Looks really good almost overhead toward Saddlebrooke! Just don't unload after you go by!
1:54 PM. Looks really good almost overhead toward Saddlebrooke! Just don’t unload after you go by!  Note scruff of lower cloud (called, “pannus”) caused the the outflows of storms to the SW of Catalina.  Not long enough really to be a “arcus” cloud, but clouds like this are almost always associated with a shift in the winds that helps build clouds overhead by acting like a micro-cold front, the rain-cooled air lifting the warmer, humid air ahead of it, and some of that warmer air being cooled to its condensation point producing these lower shelves of cloud.
Attachment 3
2:07 PM. The height of the storm, the visibility down to a hundred yards or two is all. This particular intense period hardly lasted a couple of minutes before it let up noticeably.


—————————————-

Pedagogical or possibly, pedantic (boring) module

Update alert for the posting of new (!) not-published rejected items by this Arthur:

The Cloud Seeding Literature and the Journal Barriers Against Faulty Claims:  Closing the Gaps

(the original title, submitted first in 1997), final rejection in 1999 (Bull. Amer. Meteor. Soc.)

The reviewers, Harold O., Danny R., and someone named “Anonymous Reviewer B”, guessed as, “”B”, for “Bernie S.”

Those in the cloud seeding culture don’t need the names spelled out.  Harold O. is part of the “old guard” cloud seeding culture, while Danny R. is part of the new cloud seeding guard, one that has gone on to be a science superstar since his early work at the Hebrew University of Jerusalem under the leader of the Israeli cloud seeding experiments.   He  did some work there on the clouds of the Mediterranean and satellite interpretations of them (available in Hebrew only the last time I checked).

While Danny R was there during the time of the reporting of the benchmark Israeli 2 randomized experiment by the leader of the experiment  (1976-1986) he himself was not involved in those (ultimately flawed) analyses.  Later, he participated in the unraveling of the 2nd experiment with Israeli statistician, K. Ruben Gabriel in 1990, J. Appl. Meteor.  Half of the 2nd experiment’s results had been previously omitted, an omission which produced an apparent, unambiguous “confirmatory” success of the Israeli 1 experiment, for the short of it.

The 1990 development in Israel, in essence a retraction of what everyone thought was an unambiguous cloud seeding success, plus the fall of the equally important, earlier benchmark randomized experiments in Colorado, at one time also claimed to have proved cloud seeding by the National Academy of Sciences (Malone et al 1973),  were the primary reasons for composing the piece being posted today.  You may also know that your very own Catalina  “cloud-maven” was in Israel in 1986 for 11 weeks, in doubt of those “hard-to-rain” clouds that were being described by the leader of those experiments, resulting in “Rain from Clouds with Tops Warmer than -10° C in Israel”, (1988, Quart J. Roy. Meteor. Soc.).  This was to some degree the first crack in those experiments.  (Of course, I would say that!)

How could such glowing,  but ultimately critically flawed journal papers appear ultimately involving hundreds of journal pages?  What went wrong with peer reviews?

I attempt in this piece to describe in this piece how science is supposed to work, and these pretty amazing chapters of science in cloud seeding,  and offered some possible solutions.

At one time, Prof. Peter V. Hobbs, named to write up a status piece on Clouds-Climate for the World Meteorological Organization (WMO) in 2003 or so, was going to use the “rise and fall” of the Colorado and Israeli experiments  in this piece I have just posted.  He was going  to demonstrate how we scientists can think we have proved something,  but upon closer inspection, find that we have not proved at all!

Peter Hobbs was concerned that the then many unknowns about clouds were not being treated properly in climate models (being parameterized too crudely), and therefore those parameterizations of clouds in climate models could  lead to erroneous conclusions concerning the amount of global warming that might be ahead.

In his take on this MS, and that “rise and fall” section in particular, Peter, who was not one to dole out compliments very often said of it, “This is pretty good.”  Peter had not reviewed it beforehand.

Ultimately, Peter contracted pancreatic cancer and was unable to submit his status summary to the WMO.

Some recent clouds I have known; updating “not pubbed” list

7:21 PM, August 13th. A sky so full of portent that evening after a clear day. This our last chance for rain for quite awhile, but Sutherland Heights and Catalina whiffed on this incoming complex of thunderstorms.
7:21 PM, August 13th.
A sky so full of portent that evening after a clear day. This our last chance for rain for quite awhile, but Sutherland Heights and Catalina whiffed on this incoming complex of thunderstorms.  But, we had a fabulous light show from a cell that developed almost overhead, pf Sutherland Heights as dark fell, but a little to the SE, dumping heavy rains in the Romero Canyon/Pusch Ridge area.
7:16 PM. A very dramatic looking shelf cloud spread across and otherwise completely clear sky that evening providing a great sunset photo op.
7:16 PM., August 13th.    A very dramatic looking shelf cloud (Stratocumulus) spread across and otherwise completely clear sky that evening providing a great sunset photo op.  Northerly winds of 25-35 mph and a temperature drop of about 10 degrees accompanied this scene.
6:57 PM. The churning, roiling motion of this turret was remarkable, almost like time-lapse there was so much of it. That easily seen churning was evidence of how unstable the atmosphere was this day, unusually cool for summer at 20, 000 feet or so leading to a strong drop in temperature from the 100 F or so here. which results in the warm air that clouds represent being more buoyant than usual, a hotter than usual hot air balloon, if you will, one that goes up faster.
6:57 PM. The churning, roiling motion of this turret was remarkable, almost like time-lapse there was so much of it. That easily seen churning was evidence of how unstable the atmosphere was on this day.  It was unusually cool for summer at 20, 000 feet or so  above us. leading to a strong drop in temperature from the 100 F or so at the ground.   So, as the warmer air that clouds represent relative to their surroundings, made them more buoyant than usual as they climbed upward;  a hotter than usual hot air balloon, if you will, one that goes up faster.  Stronger updrafts are thought to lead to more lightning compared with Cumulonimbus clouds having weak updrafts.
3:57 PM, August 13th. Even slender clouds could shoot up and reach the "glaciation level", and sent long plumes of ice out. The long trail of ice shows how much the wind increased with height at the top of this cloud. As that evening's storm approached, all of the anvils from the many Cumulonimbus clouds were mostly kept from view so that you couldn't see them.
3:57 PM, August 13th. Even slender clouds could shoot up and reach the “glaciation level” where the tops became comprised of only ice crystals,  and sent long plumes of ice out from the parent cloud. The long trail of ice shows how much the wind increased with height at the top of this cloud. As that evening’s storm approached, all of the anvils from the many Cumulonimbus clouds that were approaching were mostly kept from view so that you couldn’t see them.  This cloud also poses a naming enigma.  Its got an ice plume, a very little rain fell out on the left side where Pusch Ridge begins, but no shaft is visible.  It can hardly be called just a “Cumulus” cloud, and yet the more accurate label, “Cumulonimbus” with all of its attributes, makes one a little uncomfortable due to the lack of a visible shaft.


The End (of the cloud discussion)

New “not pubbed” item:

I’ve added RViewpoint_10-24-06_submitted date Aug 31, 2006_final, something that’s been sitting around for years!   Spent a lot of time writing it, but ultimately deemed it a hopeless task that it would be published in the Bulletin of the American Meteor.  Soc. under then current leadership in the weather modification domain of that journal, and ultimately never bothered to submit it.  I was sick of the conflict, for one thing.   Haven’t read this piece in years, either, but just wanted to do SOMETHING with it so here it is on this blog.

A longer piece, “Cloud Seeding and the Journal Barriers to Faulty Claims:  Closing the Gaps“, also worked on again in spare time at home, for about two years, with the final rejection in 1999 under pretty much the same Bulletin editorial leadership.  In this MS, I had a chance to get in, but the specific reviewer whose demands the Editor said I had to meet, insisted that I indicate in the manuscript that the lead scientists in the faulty published reports I wrote about “did the best they could under the circumstances” in the  two early benchmark experiments, those in Colorado and Israel.  I knew from direct personal experience that wasn’t true;  I couldn’t write such a bogus statement that might have made the difference in “getting in.”  So two years of on and off effort went down the drain.  Sometime soon I will add this second futile effort to the “not pubbed” list!  I have a number of those…..  It didn’t help either that the two leading scientists whose work I questioned were also the two most beloved scientists in this field.

As with all but one of these pubs (Hobbs and Rangno 1978) in the domain of weather modification, they were done at home, outside of grant funding work while I was at the University of Washington in the Cloud and Aerosol Research Group.  And, as I sometimes alert audiences to, working at home on stuff year after year. thousands of hours involved,  could be considered a “crackpot alert”.  Well, I think of myself as a “good crackpot.”  haha.

Hurricane force winds strike the Sutherland Heights!

If you don’t believe me, and slept through it during the power outages when it was COMPLETELY dark last night, here is a MEASUREMENT of the event from a private weather station,  The arrow points to the event, 58 knots, which is about 67 mph.  This is the greatest wind measured by the PWA in seven years, here and a few down there on Wilds.  The measured (here, the max one-minute speed) wind is, of course, LESS than the actual greatest 1s or 2s puff, likely well over 67 mph.  Unless you have a fancy ultrasonic  anemometer, too much inertia in the cheaper ones to get those instantaneous puffs.

NEW:  Got to 100 mph on Mt. Sara Lemmon before tower on which an ultrasonic anemometer was installed blew away.

Hope your trees are intact:

WInd measurement from Davis Vantage Pro Personal Weather Station located right here somewhere in Sutherland Heights.
WInd measurement over the past 24 h from a Davis Vantage Pro Personal Weather Station located somewhere in Sutherland Heights.  (Remember in Israel, that popular top 40 radio station that said, “Braodcasting from SOMEWHERE in the Medeterranean” and every one knew it was that ship located a half mile or so offshore of Tel Aviv.  Played Springstein, that kind of thing for all to hear.


Only 0.17 inches tipped by the Davis Vantage Pro, but with wind blowing as it was, you KNOW that’s going to be substantially low.  We really can’t measure rain that accurately in any thing but perfectly calm conditions.  The more accurate measurements are made if your gauge is sheltered by vegetation that is about the height of the gauge top right near the gauge, but then increases like the inside of a bowl as you gradually move away from it in all directions.  No trees, please, too close!  Preferably your gauge is on the ground not up somewhere, too, which would exaggerate the losses from wind.

Now, I will go outside and measure the rain in two ground mounted gauges, one a NWS-style 8-inch gauge, and the little toy 4-inch gauge from CoCoRahs, that national group that wants your measurements! Sign up now.  Here are the other totals:

NWS gauge, 0.22 inches

CoCoRahs gauge, blew over, no total!  Dammitall!  Wasn’t as protected in the weeds as I thought.  That total “likely” was around 0.24 or 0.25 inches.  CMP had privately predicted, 0.28 inches for this storm, whilst a major forecast professor from CSU who lives in Catalina predicted an INCH1!

Brutal out there, too. Temp only 43° F, still windy.

The weather way ahead

Sorry to say no rain for Catalinaland in our latest computer forecasts through the middle of February as the Big Niño hyped so much here and elsewhere is turning out to be  big poop so far.

Cal rains only great in the far north of the State during January, and in the northern Sierras.

Sucked in by the Big Niño thoughts here, CMP  was predicting quite the mayhem in Cal during the last 15-16 days of January, and 25-30 inches at some locations during that time here is a table for that period from CoCoRahs.  Note Shelter Cove, near the King Range, has the most.  Totals are sorted in descending order, Jan 13-31.

CoCo Jan 13-Jan 31 Cal rain

 
No doubt your curiosity was piqued and peaked by seeing how much rain could fall on you if you lived in Shelter Cove, on the Lost Coast of California. Well, here’s what its like there. Has an AP, too!

IMG_3339
A view of Shelter Cove, showing airport and control tower. Yep, you can fly right in!
IMG_3340
Another view of Shelter Cove. King Range is in the distance. NO DOUBT, rainfall up there WAS more than 25 inches if about 22 fell at Shelter Cove!

May try to get some more of that Cal precip since Jan 13, finding a modicum o direct verification of that huge amount of rain prediction.

No Mavericks surf competition yet, though larger waves have been battering the Cal coast over the past two-three weeks.  Below, surf for today.

Cal big surf Jan 31

DSC_2500
4:04 PM. Nice lenticular, devolving into flocculated Altocumulus downwind. The cells the form downwind from the smooth upwind edge are likely due to the latent heat released when condensation occurs, causing weak up and downdrafts to develop father downwind.
5:58 PM. Dusty sunset, and once again I point out that this would be a great name for a western singer. No worrisome dark spotting on sun.
5:58 PM. Dusty sunset. No worrisome dark spotting on sun.

The End

————————————-

1Maybe the “Ivory Tower” has not only protected him from the hiccups of the “real world” due to tenure and that kind of thing, but also from discerning what real weather will be like.  hahaha.  Just kidding.  Sort of.  Recall CMP was NOT tenured, but just a “staff” meteorologist with a “light” at the end of the funding grant tunnel, year after year for about 30 years.  So, I am pretty mad about “tenure”.  Hahahaha, just kidding maybe.

“Tenure” was a recent subject of a Science Mag editorial (“Wither (wither) Tenure“), too; costs everybody, especially students, a LOT of money, it was said.

Too, often young bright researchers are blocked by senior professors having tenure and making large amounts of money that hang on well past their productive years.

Cloud Maven Person:  Resigned from the U of WA Cloud and Aerosol Research Group due to feeling he wasn’t earning his high “Research Scientist III” pay anymore, brain dimming, though there was a pile of money that he could have continued on with.  Title of resignation letter:  “Time to Go”.  This free-ed up monies for staff folks that remained in our group, too.

Com’on decrepit tenured faculty, give up!  Resign now!

PS:  My friend tenured fac is STILL active, gives talks/presentations around the world still, even though he’s quite a geezer now, as is CMP.

.

Weather “stagecoach” full of storm presents set to arrive on Friday

Don’t really need me anymore.  Everyone’s on top of this ” incoming” now, set to begin in the area overnight on Thursday, the one you’ve  been reading about here since maybe last October I think.  So, feeling sad today, also because it looks like its going to be a bit too warm for snow, which I think I mentioned about a dozen times. Maybe I will take it out on you by boring you with a science story, one about ice in clouds…but one featuring such stalwarts as Sir Basil Mason, Stan Mossop, John Hallett, Pete Hobbs, Alexei Korolev, and others.  Interested now?

But first, a few nice cloud shots from yesterday so you don’t get too mad at me for boring you first:

2:07 PM.  CIrrostratus fibratus (has detail, not just an amorphous veil).
2:07 PM. CIrrostratus fibratus (has detail, not just an amorphous veil).
4:21 PM.  Cirrus spissatus patches and dog, Zuma (named after the acclaimed dramatic series, Baywatch, which took place at Zuma Beach, also where the author, whilst not storm chasing spent a LOT of time.
4:21 PM. Two dense patches of Cirrus spissatus patches and dog, Zuma (named after the acclaimed dramatic series, Baywatch, which took place at Zuma Beach;  also where the author, whilst not storm chasing,  spent a LOT of time.


5:22 PM.  Cross section of a Cirrus uncinus (hooked at the top).  This shows how the ice crystals forming at the top first get heavy enough to fall out, but if encountering drier air, start to evaporate, slow in fallspeed, and as in this case, form a flat layer of tiny crystals at the bottom of the head of Cirrus uncinus.  Likely a little moist again at that bottom location so the tiny guys don't away very fast.
5:22 PM. Cross section of a Cirrus uncinus (hooked at the top). This shows how the ice crystals forming at the top first get heavy enough to fall out, but if encountering drier air, start to evaporate, slow in fallspeed, and as in this case, form a flat layer of tiny crystals at the bottom of the head of Cirrus uncinus. Likely a little moist again at that bottom location so the tiny guys don’t away very fast.
5:29 PM.  Sunset in Cirrus (spissatus and others).
5:29 PM. Sunset in Cirrus (spissatus and others).


Cloud ice science story

(drink some coffee, maybe take an extra swig of an “energy drink” if venturing forward)

Kind of takes the fun out of it when other people are saying what you want to say by yourself, lilke today’s forecast for Friday’s storm.  Kind of like being second when you publish “new” results behind other researchers who “got in” a little a head of you (like Korolev et al.-with Hallett!) did in 2004 reporting the FIRST image of a shattered frozen drop they said.

Drop shattering during freezing; what about it?

It was thought not to happen in natural clouds after that embarrassing episode back in the 1960s when the Great Knighted, Sir B. J. Mason1 and his student, Swinbank (1960), reported drops exploded with they froze.  Liquid centers tried to get out of the ice shell as the drop froze from outside in, as you would expect, but then blew up when the freezing water expanded inside the shell.  Looked pretty good.

There was only one thing wrong, their findings weren’t valid for real clouds.

They put too much CO2 in their cloud chamber (that’s right, the very SAME stuff that’s supposed to make the earth warmer and warmer year after year but has been sitting around lately, about 15 years actually, not doing anything) and that CO2 in the experiments turned out to make the outer ice shell real weak, and also the CO2 came out of solution in the water in the liquid center to make matters worse by expressing gas through the shell.  I wonder how many people have done that?

This was found out by researchers in my very own group before I got there, Jim Dye and Peter Hobbs, a few years later.  When real air was used, the drops didn’t explode.  So, down that hypothesis went that exploding drops caused a lot of ice to form in natural clouds.

End of story?  Nope.

Later, Hobbs with grad student, Abdul Alkezweeny, repeated the experiments with freezing drops, but this time instead them just sitting there, had them rotate as they froze and they DID shatter some, but not a lot!  This was back in 1968.

But no one was reporting images of shattered drops.

In those days,  there was a HUGE amount of unexplained ice in clouds.  Cloud chambers on the ground and in aircraft, found that little ice formed until the air IN THE CHAMBER was at least as cold as -20 C (-4 F), but instrumented aircraft repeatedly found tremendous amounts of ice in clouds that had never been colder than -10 C (14 F).  Hence, an enigma.

But the explanation that a few drops exploded, sending out thousands of ice shards never gained any ground because there was never any observational evidence that it happened.  Instead, an Australian researcher, originally from South Africa, Stanly C. Mossop, with John Hallett, discovered in 1974 that a bar moving through a cloud chamber between -2.5 C and -8 C, caused ice splinters to eject from SOME of the little drops hitting the bar and freezing on it.  But the drops had to be at least 24 microns in diameter, fairly large for cloud droplets, or nothing happened.  Also, if they moved the bar too fast or too slow, nothing happened.  So, there were a lot of criteria involved in this process, temperature range, drop sizes, speed.

So, the Hallett-Mossop riming-splintering hypothesis was born.  They assumed the bar, moving at the fall speeds of soft hail, showed what soft hail did inside clouds:  multiply ice content!

It was an exciting time to see that the mystery of all that ice in clouds at higher temperatures was finally explained, not needing, shattered drops or anything else.

But there were some problems.  In the early days, it was thought that this process, to raise the ice concentrations in clouds much, would take as long as 1-2 hours because it was a “cascade” process.  The few first splinters had to grow to sizes there they fell fast enough to bump into drops and cause ice splinters to eject.  Well, that wasn’t right.  Natural clouds formed ice MUCH faster than that, as you here in Arizona know so well.

The experiments continued and it was found that shattering helped this process (assuming it occured, but even more important was the freezing of drizzle and raindrops.  When those froze, they became instant rimers, splintering objects, and so the time for a cloud, but one having drizzle and raindrops in it, and in the right temperature zone, just between -2.5 and -8 C, was cut down to minutes, something like 10-20, to get ice concentrations from about 1 per cubic meter, to tens of thousands per cubic meter, a real rain cloud.

Except for a single image of a drop half by a researcher using a cloud camera with a glider in the 1970s, no one had reported a shattered drop.  Then along come Korolev et al. (with the great Hallett!) in 2004 reporting shattered drop images in a Canadian frontal band using an advanced cloud camera.  They wrote that it was the FIRST images ever reported of shattered drops.  Rangno and Hobbs (2005) also reported images of shattered drops in clouds around the Marshall Islands, thinking at the time that they were going to be first in line, and then discovered the Korolev et al. report.  It was a sad day to find that reference, as a researcher that was thinking about the glorious days ahead, the keynote addresses to important conferences, that would result from being first in line with something and then other people would always have to reference you.

As Ecclesiastes wrote, their is hardly anything new under the sun if you’re slow going about it.

Published another paper on shattered drops back in ’08.  But, found they didn’t SEEM to be making a big contribution to the ice content in clouds, less than 10%.  You can go here to see that I didn’t make that part up. That was kind of sad finding, too.  You want what you find to be HUGE, and it wasn’t so huge as I hoped.

So, riming and splintering remains our best, most accepted explanation for the great amounts of ice in clouds that aren’t so cold, though the author and Hobbs, have mostly found it wasn’t powerful enough to account for the speed of ice development.  Only the author’s friends, Stith et al (2004),  have reported a lot of ice that couldn’t be explained by the riming-splintering mechanism as have  R&H over the years.

But it would be so great if others confirmed the Stith et al findings.

The End for now.


———————-

1Wiki doesn’t do a very good job, and doesn’t even list his outstanding updated, Physics of Clouds text published in 1972, the “bible” of cloud physics in those days!  Unbelievable.

2Riming: Think of what happens to an airframe in a liquid drop cloud at below freezing temperatures.  HELL, here’s a photo by the author from the author-occupied Lear Jet 35 flying in supercooled clouds over Saudi Arabia, 2006,  The weapon-looking things under the wings image precipitation particles like raindrops and snowflakes using laser beams with light sensitive diodes at the other end, one that when shadowed, give you a two dimensional image of what went through the laser beam.

ann DSCN1223 rime icing
8:01 AM, December 16, 2006.


11:02 AM, December 10th, 2006.  Had to land at Hail, a small, pretty town north of Riyad to pick up some supplies, ones for the randomized cloud seeding experiment underway.  It was interesting that we could carry these boxes labeled "Explosive" to the Lear Jet without any notice.   Hmmmm.
11:02 AM, December 10th, 2006. Had to land at Hail, a small, pretty town north of Riyadh to pick up some supplies, ones for the randomized cloud seeding experiment underway. It was interesting that we could carry these boxes labeled “Explosive” to the Lear Jet without any notice. Hmmmm.  They were there because that’s where another NCAR radar was besides the one at Riyadh, and a plane might have to land to continue seeding if it ran out of the seeding flares like the ones inside these boxes.


Not blogcastin’ today; but an old science story “filler” from the Middle East!

Lettin’ the past few weather blogcasts about a good chance of snow here in Catalina during the Christmas season ride the old stagecoach into town.  Doesn’t seem to be any need to change it…  In the meantime this.

A science story for you, while we kill time waiting for some snow

You’ve probably read about snow in Jerusalem and elsewhere in the Middle East.  I saw it snow in Jerusalem when I there for 11 winter weeks, January through the middle of March, 1986, on a self-funded cloud investigation. Its not terribly uncommon to see snow in Jerusalem, believe it or not.

I was single in 1986, so I could do stuff like that, quit my job at the University of Washington for awhile (2 years), with no need to ask a spouse, “Honey, do you mind if I quit my job today and spend the equivalent of $40,000 going to Israel to look at clouds for a couple of months, and then spend a year without income working on a publication about ’em?”

Not gonna happen.

I had just sold a house in Durango, Colorado, so had some money to waste;  I could be a “gentleman scientist” as in the old days of science before WWII and Vanevar Bush and the onset of big government funding for science, and maybe what some would call the beginning of “careerist” science, that followed WWII and the beginning of the Cold War to propel us forward.

So off I went in early January 1986 to see the clouds of Israel.

Jerusalem was often a city in the clouds during storms; it was so COLD and windy during them, unbelievably so considering what we think of there from Bible stories.  I was outside a lot, experiencing the weather and rain, and on one occasion I remember I couldn’t pull the shutter on my old Rolleicord medium format camera, my fingers were so cold.

The three wisemen/magi came in the winter, didn’t they?  They don’t seem to have enough clothes on in the Nativity scenes that I have seen, given what the weather can do in the winter there.  Below, Jerusalem in the clouds, with 20-30 mph wind, at about 40 F:

I_TALK_001
Part of the new construction of the Hebrew University of Jerusalem. Might have been a hospital wing. Note leaning cypress or juniper trees.


Looking down King David Blvd, Jerusalem,  during a storm.
January 12, 1986.   Looking down King David Blvd, Jerusalem, during a storm.
January 21st, sunset over the Med, from the beach fronting Tel Aviv.
January 21st, 1986:  sunset over the Med, from the beach fronting Tel Aviv.

I really loved it in Israel. The Israel national weather service (IMS, Y. L. Tokatly, Director) was great to me, letting me have a little research area in their offices after I just showed up on their doorstep, unannounced.  Later, in a display of incredible scientific idealism, when the Director learned that the key scientist and I had a falling out about the clouds of Israel after my second week there, he allowed me to continue to use their historical records and my little space in their offices, terming what happened between that researcher and myself, as “merely a scientific dispute.”

Oh, my; where has that pure idealism fled to in the global warming wars?

But I loved the clouds there in Israel the most as they rolled in off the Mediterranean, borne on the cold winds of continental Europe, then boiled upward from flat little guys that they started out as by the warm waters of the Mediterranean into big Cumulus and Cumulonimbus clouds, the latter often spewing lightning, by the time those clouds and cold air got to Israel.  It is a gigantic lake-effect situation there in the Mediterranean, the kind that is produced by the warmer waters of the Great Lakes as Arctic air traverses it, such as the storm buried folks in New York recently.  Over over the Mediterranean, the air has a chance to really warm up after leaving Europe due to its low to mid 60s late fall and wintertime water temperature.

January 15, 1986.  Cumulonimbus marches ashore north of Tel Aviv.
January 15, 1986. Cumulonimbus calvus marches ashore north of Tel Aviv.
February 9, 1986.  Skies open up near Nahariyya, in extreme northern Israel.
February 9, 1986. Skies open up near Nahariya, along the extreme northern Israeli coast near the Lebonese border.
January 12, 1986.  An epiphany moment as the first storm in daylight hours occurred during my visit.
January 12, 1986. A moment of “cloud ice” epiphany as the first storm in daylight hours occurred during my visit.  I knew with the first two hours of this storm that my hunch about those clouds was right.  BTW, showers like these can roll into Israel,  and into Lebanon for that matter, for days on end, termed “rainy spells” in that region.  Cold air troughs aloft like to “nest” in that region in the wintertime, enhancing the clouds there, and stimulating the “Cypress Low” pressure area at the surface in the eastern Med.

The short of this is, and I COULD write a book, “go long”, was that I questioned,  from afar mind you, after I plotted  balloon sounding of temperature and moisture from Lebanon and Israel when it was raining, whether the clouds being described by a leading scientist in Israel were correct. In fact, from these plots, I was rather sure they weren’t.  But it would, as I knew, be real heresy to conclude that in those days.

Of course, questioning findings goes on all the time in science. Its what makes it better.

A short paper was submitted to the J. of Applied Meteorology in 1983 reporting this discrepancy, and some other problems.  It was rejected by three of four reviewers, one being the leading scientist mentioned above. I really was of the opinion I would “get in.” so was disappointed, but not undaunted in the least! Should have taken more than ONE day, July 4th, 1983, to write it, coming into the University of Washington at 6:30 AM, I was so excited to get it off!

I knew what those balloon soundings were telling me, and so after the paper was rejected, it began to occur to me to GO to Israel and see the clouds for myself.   After all, by this time (1983) I had been punching clouds with cloud measuring instruments at the University of Washington for about seven years, and had a good idea of what was in them just from their visual (external) appearances.  And I was starting to build a list of papers on reanalyzing and commenting on cloud seeding experiments, getting some notice.

So I reasoned that even if I just looked at the clouds of Israel, I would know whether the many journal and conference reports about those Israeli clouds were in error.

Error? What would that be, you ask?  Some background, if anyone is still reading.

The clouds being described in Israel by researchers there, ones operating a cloud seeding program, were supposed to get real thick and cold before they rained. That meant the clouds weren’t very efficient and could to be seeded with a substance called silver iodide (AgI) to make it rain sooner, before they got so thick and cold.  The AgI would introduce ice, needed to start the rain process going, at higher temperatures than the natural clouds rained at, thus  seeded clouds would rain before having to be so thick and cold.

This meant that more would rain when seeded compared to not seeded clouds because not just the taller ones in Israel would rain.   More clouds raining would, of course,  add hours of rain to storms on seeded days, it was posited, and the researchers evaluating their second randomized experiment reported those very results:  seeding, on randomly drawn days, had increased the hours of rain compared to randomly drawn control days. And these increases in rain on the seeded days were statistically significant, as they had been in a first randomized experiment.

So, in not ONE but two randomized cloud seeding experiments in Israel, statistically significant results had been obtained on seeded days, and the scientists reporting these results also had what appeared to be a solid cloud foundation for having obtained more rain by seeding;  the natural clouds just had to be too thick to rain, but they fixed that by seeding with AgI.  It all made sense.

It doesn’t get better than this for scientific proof, the so-called “gold standard” of science;  statistically significant results in two randomized experiments and a solid physical reason why it happened.  Due to these attributes, these experiments in Israel were accepted as “proof” of seeding effects  by our highest scientific panels, such as the National Academy of Sciences, and every expert in the cloud seeding domain.  For a time…..

Representative of this status is a 1982 article in Science magazine;  “Cloud seeding:  One success in 35 years”  That success was the two Israeli experiments en toto.

From the outside, my trip to Israel in 1986 to investigate the clouds would have seemed ludicrous.   Why bother; too many peer-reviewed publications documenting the attributes of those clouds, and also in a number of conference papers as well.

Could they all be wrong?

Yep1.

The End, more or less.

Below, an “action shot”:

Yours truly atop the Riviera Hotel, Tel Aviv.
Yours truly atop the Riviera Hotel, Tel Aviv, January 1986, readying for clouds and storms to blow in from the Med.

——————————————-some final commentary that sort got out of hand after more coffee———–

1The short ending.  That answer is not in question anymore.  Did that leading researcher allow me to go to either of his two radars to see how thick the clouds were when they were raining?

Nope.

So my publication on those clouds (1988, Quarterly Journal of the Royal Met. Society) had to make inferences about cloud top temperatures based on primitive balloon sounding data.  But the results in that paper,  that shallow clouds were raining and had MUCH higher cloud top temperatures than had been reported to that time, were confirmed by independent researchers, the best kind, using aircraft and modern instrumentation a few years later.

Spiking fubball now!  (Can’t seem to lose that sense of irreverence, even when serious.)

Some final, “human” notes about this chapter of science:

This same leading researcher, in 1972 (published in 1974 in Weather and Climate Modification, Wilmot Hess, Ed, Wiley-Interscience) wrote what may be the BEST, most circumspect review of his experiments, as his second experiment was underway!  It is recommended reading for anyone in this field.

So, “something” happened later on when he got his radars to monitor cloud tops and likely learned there was a problem.  And you can imagine, I was his nightmare, a smart-ass with a building publication record critical of cloud seeding coming to Israel to question his cloud reports. Ideally, no problem.  As scientists “ideally” we want to be the first to know that our results are in error.  We care only about truth.  (Right.)  Ufortunately, our humanity sometimes gets in the way.

The leader of the Israeli experiments died only a year after my visit at the age of 54, aware at that time (1987) that the paper on clouds of Israel was going to be published in the QJ (Prof. Peter Hobbs, the Director of my group,  had communicated this news to him after we got word from the QJ that year.)   So….we can speculate.

But our meetings were cordial at all times;  he was a great story teller, and there was no shouting, even when he firmly asked me to leave his office and never come back (2nd visit when I was telling him about my “findings”, which included a mention of drizzle, something his clouds were never supposed to do).

In fact, I felt bad for him, and still do, knowing the position I was putting him in, how this might end when other researchers began asking more questions about his cloud reports and eventually they would have to be overturned.   At one point, on top of the old Hebrew University of Jerusalem, during our first very cordial meeting, I said, “Maybe we can co-author something if I find anything.”  Coming from a “newby” like me, I am sure, as cordial as he was, he would have liked to have pushed me off the roof.

Some day I will post the whole technical thing on this experiment, and another one that was its mirror image in the Colorado Rockies. That future post (Cloud Seeding and the Journal Barriers to Faulty Claims:  Closing the Gaps) will be piled high with references   But this is already too much for now.