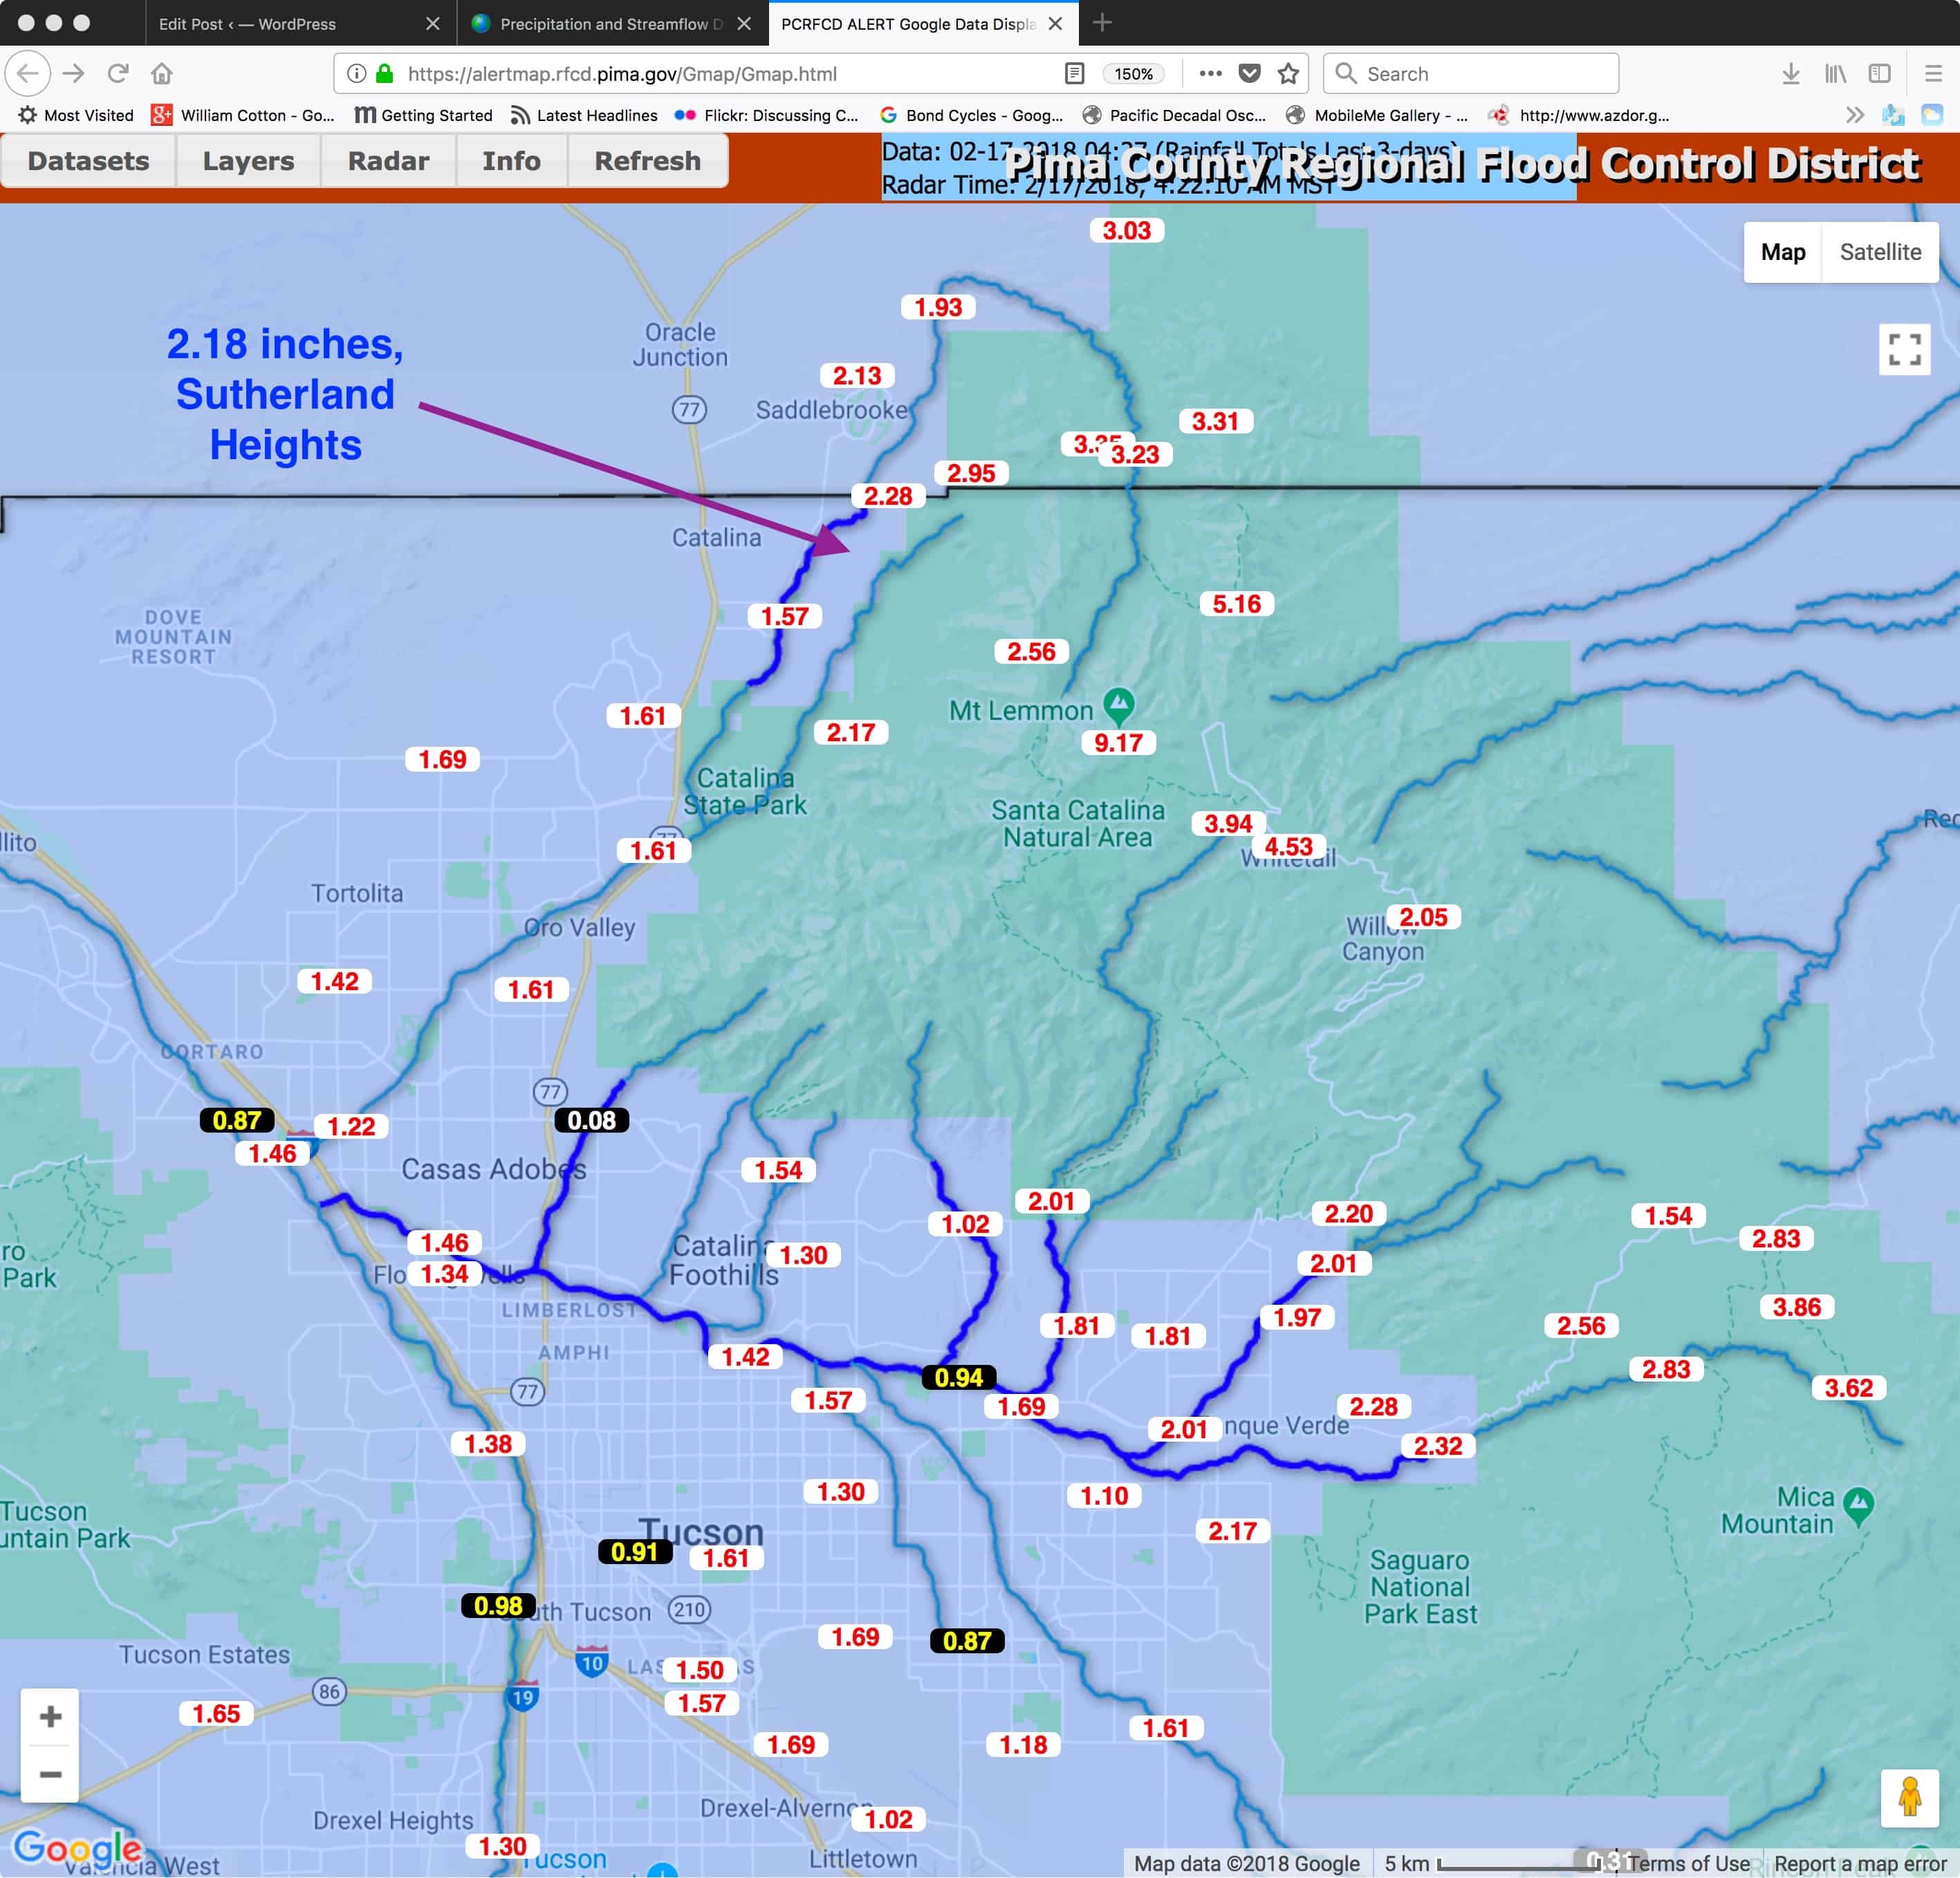
Toot, toot, drip, drip. Rain fell on Catalina, Arizona, for the third day in a row, bringing our three day total, at least in Sutherland Heights, Catalina, to 2.18 inches, and over NINE inches at Ms. Mt. Lemmon, subject to quality control later.
Here’s a nice map, courtesy of the Pima County ALERT network, whom I haven’t actually asked to post this but you can go here and see it in the original:
The three day totals for the Valentine’s Day starting storm of February 14th, of course, through the 17th, 4 AM to 4 AM AST. The map has been enhanced with a total over that time period from Sutherland Heights for comparison.
Yesterday’s clouds
No photos, still suffering from WP or godaddy hosting chokehold. Even text takes seconds to appear! Worse than dial up. The above jpeg, just 1.4 mb, took several minutes to upload!
The weather way ahead and soap-boxing the erroneous, “warm temperatures” expression
While the NOAA ensembles let us (me) down in mid-January when it appeared that troughs would dominate in late January through early Feb (it wasn’t even close to that interpretation, and the first time I’ve seen those crazy plots do so badly, will go with them now and present a couple that strongly suggest the drought pattern has been decimated for Arizona and the Southwest; no more weeks of no rain or rain threats, with ridiculously warm days (note, not days with “warm temperatures”, a temperature is a unit of measurement, not a thing that can be cold or warm—-got it? Its the AIR that’s warm or cold, or a day, a month. What if, when a high pressure sat on Arizona, that I said we had really “dense millibars today”, to make a comparison showing how WRONG it is to say, “warm temperatures.” Its HIGH temperatures or LOW temperatures, etc. Tell your friends….
OK, will go through that bit more of uploading misery with these stupefying spaghetti factory plots. Inspect them and be happy if you like unsettled weather, storms threatening or actually occurring every few days. The first one is a week from nows, then ten days from now, and the last one two weeks from now. Exult over the troughulent regime we’re now in! Yay!
Note how the red and blue lines dip southward over the whole southwest US. That dip represents the location where upper air troughs will be occurring at this time. The red lines are more or less the periphery of the jet stream on the warm or tropical side, and the blue lines nearer the heart and cold side of the jet stream.
This “ensemble” approach, where tiny errors are deliberately input into the model data as the computer run begins is deemed one of the great advances in forecasting, this due to more powerful computers that can crunch so much global data so fast. There are always errors in the data, and we can’t measure the atmosphere over the whole globe in an instant, and this is a way of determing what the errors might do to the forecast. Heck, we don’t even know what the real errors are. So we input some and see what happens.
The greater the effect errors have, the more spread out and chaotic the patterns are. When the red and blue lines stay close together, it indicates that at least, tiny errors, don’t have much effect. Normally, after ten to 15 days, the lines are kind of a mess, with only general patterns discernible. (Sure is annoying typing and waiting seconds to see what it is you’ve typed!)
In last evening’s global data runs, the red lines in our domain stay pretty bunched up, indicating a strong indication of troughing over these next two weeks, even out to 15 days! So, cloud maven person is pretty excited thinking that maybe a wildflower or two can now pop up, and our spring greening will go forth.
Just yesterday on a dog walk to the Sutherland Wash, tiny plants were bursting forth from the ground. What a miracle that is. (The wash had no water in it.)
“Rainy portent”; is there a better phrase for a desert than that? I don’t think so. See mini-discussion below, and below that, some soapboxing! Very excited today! Where are my pills?
Now, let us discuss the top 100 weather blogs:
Bob Maddox‘ superb site, representing Tucson, makes the list ! This note and info from pal and fellow weather fiend and fellow science investigator, Mark Albright1:
11) Cliff Mass Weather and Climate (U of Washington Huskies!)
28) Judith Curry, Climate Etc (once worked at U of Washington Huskies as a visiting grad student
30) RealClimate (from the Huskies)
33) Wasatch Weather Weenies, Jim Steenburgh (graduated from from the U of Washington Huskies!)
65) Mike Smith
70) Madweather – Bob Maddox (Tucson AZ) (Was grad student of mighty prof and neighbor, Bill Cotton, whose heard of the Huskies!
83) West Coast Weather – Michael Fagin”
Not sure if “we” (to distribute poor performance beyond a single author) even made the top 1000; the list doesn’t go that low (or high).
But, we’re not really a weather site, per se, to put a positive spin on a glum finding. We talk mostly clouds here. not so much weather. Contains sophomoric, droll, and tongue in cheek “humor”, too. Maybe Cloud Maven Person’s blogulations would make the top 1000 CLOUD sites!
The weather ahead and beyond ahead
Cool with passing rains every coupla to few days, maybe some snow with one of those events, as they continue into February. The first storm begins on January 20th, and then its one threat after another. This new “troughy” regime should bring the January rainfall total in Catalinaland over average of 1.60 inches (1978-2017). Currently, we’ve logged 1.10 inches in a NWS style 8-inch diameter gauge.
Looking for tiny green sprouts out of our desert soil now.
The End
(except for all the footnoted sci commentary below)
sci commentary and soapbox module——
1Mark Albright routinely calls attention to suspect temperature data that’s out there, and other questionable aspects of some climate statements2. He is widely well thought of for these conscientious efforts in bringing temperature errors to people’s attention3. Mark was former State Climatologist of Washington State, to be redundant, for many years. Was more or less fired for questioning claims of HUGE snowpack losses in the Pac NW between the late 1940s/50s (a cold era that started after a warm era in the 30s and 40s) and the late 1990s (a Niño-filled warm decade); to wit, it was a cherry-picked study, as we learned later via Stoelinga et al 2010 pdf, and by the mountainous snows that occurred immediately after that bogus claim was published in the Bull. Amer. Meteor. Soc.
Could snowpack go down gradually over the years in the Pac NW due to warming? Sure! But there was no need to cherry-pick data to create the appearance of an imminent calamity! It destroys credibility when objective investigators like Stoelinga, Mass, and Albright check into them. Michael Mann, of Penn State and “hockey stick” fame, also fueled the fires of skepticism and doubt needlessly by refusing to give the details (data and methodology) on how he created “The Stick” which eliminated such climate anomalies as the Medieval Warm Period and the Little Ice Age that followed. If you read Science magazine, they often refer to the MWP and LIA! What’s Up With That? It can’t be both,; didn’t happen but did happen????!!!!! Dammital.
“Fellow investigator”, CMP? Oh, yeah, baby! Your CMP likes questioning exaggerated cloud seeding reports after they’ve been published in peer-reviewed journals! Or checking into suspect cloud reports *(after all, he is the “Cloud Maven”) that are the foundations of seeding results. He’s even gone to foreign countries (well, one) to check out suspect cloud reports, help the people of that country understand their clouds.
While CMP has a number of peer-reviewed pubs that are critical of cloud seeding (nearly all co-authored with the late mighty Prof. Peter V. Hobbs), maybe today, as do so many good scientists and others, those critiques would just be in blogs? I dunno.
Journal editors have tremendous power over your getting in these days via who they give your manuscript to to review. (Well, that’s always been the case).
But today that power has grown enormously since they (a single editor or an editorial board) can refuse your manuscript on first sight (its “D. O. A.)” and not even send it out for peer-review! This is an intolerable situation since non-objective factors will certainly creep in to such a process. As an example of unwanted but valid science, Stoelinga et al took years to get into the J. of Climate.
Note to journal editors: Send the damn thing out! Let legitimate, even adversarial reviewers, determine the fate of a manuscript, with the stipulation that the author (s) have a chance to rebut adversarial reviews which will likely reject a manuscript prima facie. They’re the best ones!
And, no “pal reviews”! They’ve cost us so much in the early published cloud seeding claims here, and in Israel , believed to be accurate by our best scientists and national panels, but cost us and Israel tens of millions of dollars of worthless cloud seeding based on those ersatz published results.
2Some professors and students at the U of WA delete Mark’s e-mails on arrival; they prefer not to hear about discrepancies or other weather data that might cast doubt on today’s climate issues. As far as I know, only Prof. Cliff Mass has, from time to time, openly supported Mark’s findings putting him even more in the cross hairs of some of his fellow faculty members and especially some other climate scientists and students/post docs since he has often scrutinized and found wanting some gross claims on climate change. We are in a science era where questioning even the magnitude of the warming ahead, even if we believe its coming, is seen as untoward. Science is not as it should be!
3If you believe that, I also have some ocean front property in Nebraska I’d like to sell you.
I was disturbed last evening (Dec. 13th) by a piece on the California wildfires, and their cause during the venerable PBS news hour. As with so many cases when opinions differ, PBS usually interviews those with differing opinions.
Not so last night.
It would seem that issues in climate have been removed from debate and critique except in the more or less underground blog world; bad for the public and bad for science.
Differences of opinion should be addressed head on in the most public of places, not hidden as though they don’t exist!
So I feel those alternative opinions on the cause and frequency of Cal wildfires omitted in the PBS news hour should be exposed:
These opinions are contained in the Washington Times, a counterpoint newspaper to the liberal-oriented, Washington Post. (We need objective news so BAD!)
Perhaps the PBS producers should listen to the FTC statement on fraud, which reigns in advertisers statements that can mislead consumers. I post this FTC statement because this is what happened last night on PBS, IMO. If what they presented last night on wildfires was a “product”, in effect, one “harming consumers” due to not having proper warnings (balance), you would see the injury lawyers lining up:
“Certain elements undergird all deception cases. First, there must be a representation, omission or practice that is likely to mislead the consumer.” —FTC Policy Statement on Deception
Yep, that’s what happened in the PBS news hour last night. Shame on you, PBS. You can do better.
————————-
Disclaimer 1. Two of the scientists quoted in the Times article are friends and ones I greatly admire; they are first rate scientists with numerous peer-reviewed publications; Cliff Mass, professor of atmospheric science at the University of Washington, and Roger Pielke, Sr., emeritus professor of atmospheric science at Colorado State University.
Disclaimer 2: The writer is firmly of the opinion that the world will be warmer in the future.
Disclaimer 3: I am corrupted in a sense about scientific literature published in polarized domains due to having seen hundreds of pages of peer-reviewed literature describing ersatz cloud seeding results. I have a fair body of literature published on those, in essence, “corrections.” The bogus published cloud seeding results led to an erroneous scientific consensus on cloud seeding skill in the 1970s and 1980s.
Why did that happen?
The experimenters responsible for those faulty results knew beforehand what they would find and made sure they found it (sound familiar?), and due to inadequate and/or “pal” peer-reviews that let faulty literature into peer-reviewed publications (also sounds familiar).
The End
(Thanks to Mark Albright, I guess, to alerting me to that Washington Times article; I lost sleep over that and whether the Geminid meteor shower, peaking last night, would destroy the space station, killing all on board.)
3:55 PM. Rainbow fragment and solar home, an extraordinary combination.. It was yesterday’s visual highlight. Yours for $1995.95. And, if you order now, we’ll throw in a second, exact copy of this extraordinary, magical scene FREE!
Here’s a nice one from the day before as the clouds rolled in, starting with Cirrus and Altocumulus, lowering to Stratocumulus later in the afternoon.
Yesterday’s clouds; an extraordinary day with a little drizzle amid light showers
Hope you noticed the true drizzle that occurred yesterday, namely, fine (larger than 200 microns, smaller than 500 microns in diameter), close TOGETHER (critical to the definition of “drizzle”) drops that nearly float in the air. They may make the least impression, or none, when landing in a puddle.
When you see drizzle, you have the opportunity of chatting up your neighbor by educating them informally to what drizzle really is (many, maybe most, TEEVEE weatherfolk do NOT know what “drizzle” is, btw), and 2) by telling your neighbor, if he/she is still listening to you, that the droplets in the clouds overhead must be larger than 30 microns in diameter, or better yet, “larger than the Hocking-Jonas diameter of 38 microns, at which point collisions with coalescence begins to occur” and “drizzle is not produced by ice crystals in the clouds overhead; they’re not enough of them to produce ‘fine, close together drops.'” Your neighbor has likely left the building at this point, but, oh, well, you tried.
Here, in Arizona, shallow clouds, such as we had yesterday, hardly ever can produce the broad droplet spectrum in which clouds have droplets larger than 30 microns in diameter. Its because this far inland from the ocean, where the air is very clean, the air has picked up natural and anthro aerosol particles that can function as “cloud condensation nuclei” (CCN). As a result of ingesting dirt and stuff, clouds have too many droplets here as a rule for the droplets in them to grow to larger sizes. They’re all mostly less than 20-25 microns, sizes in which even if they collide, they can’t coalesce.
In “pristine” areas, if you go to one, such as on a cruise out in the oceans, droplet concentrations in clouds are much lower, and even a little water that might be condensed in a shallow cloud can produce a broad spectrum, one that extends to droplet larger than 30 microns.
So even little or shallow layer clouds can precip over the oceans, produce drizzle or light rain showers (in which the larger drops are bigger than 500 microns in diameter). Of course, here we recall that the (whom some consider “villainous”) geoengineers want to stop drizzle out over the oceans so that clouds have longer lifetimes, are darker on the bottom, and reflect more sunlight back into space.
Those guys can be lumped into the same ilk as those who want to change the color of the sky from blue to whitish or yellowish by adding gigantic amounts of tiny particles in the stratosphere, again for the purpose of cooling the planet! Unbelievable. Please ask before doing this!!!
A Pinatubo sampler for what “geoengineering” would do to our skies, say, sunsets in particular. I took this photo from the University of Washington’s research aircraft in 1992 off the Washington coast in onshore flow. But we saw these same sunsets, sunrises, yellowed by the Pinatubo eruption of June 1991 everywhere we went, including in the Azores in June 1992.
OK, pretty boring, whiney, really, so inserting picture of a nice horse here to make people feel better if you’ve been depressed about what our scientists have been pondering to do about global warming other than controlling emissions:
8:57 AM. Zeus. Led cloistered life for 13 years; likes to bolt, now that he’s getting out on the trails.7:40 AM, yesterday, Dec. 31st. The low hanging Stratocumulus clouds, about 1500 feet above Catalina, and the mountains had a bit of an orange tinge. It was probably due to sunrise color on a separate much higher layer.
Later….drizzling Stratocumulus, same view:
10:30 AM. Stratocumulus praecipitatio, if you want to go “deep” into cloud naming. “Stratiformis”, too, covers a lot of the sky. Note misty-like view, lack of shafting.12:48 PM. More Stratocu P., an example of those clouds in the distance that kept dropping little and light rain showers on Catalina.1:01 PM. Highlighting amid the RW– , (weather text for “very light rain showers”). Stratcu P., with maybe Stratus fractus or Cumulus fractus below. The shadowed, dark shred clouds in the mddle would be Stratus fractus IMO.3:55 PM. Zooming in on that pretty rainbow. You know, this is a cloud heaven here. I hope you all appreciate it! Maybe that’s why I get upset over “geoengineering” and changing the sky anywhere.3:57 PM. Between showers, but new ones erupted upwind. This one have a shaft, implying a higher cloud top than the prior, non-shafting clouds that brought us semi-steady RW–.
The second extraordinary thing about yesterday was that the top temperatures of these clouds was around -10° C (14° F), temperatures that ice does not form act as a rule in Arizona. To get ice at temperatures that high, you also need larger cloud droplets, and they have to occur in the -2.5° C to -8° C range. In this range, it was discovered that falling ice crystals, mostly faster falling ones like “graupel” (aka, soft hail) when colliding with larger drops, ice splinters are produced. The cloud droplets must be larger than 23 microns in diameter in THAT particular temperature zone, something that would occur more often in our warm, summer clouds, but would rarely be expected in our winter ones.
Why?
Again, it goes back to clouds in inland regions ingesting lots of natural and anthro aerosols that cut down on droplet sizes in clouds (by raising droplet concentrations in them). Our recent rains have helped cut down on that process on ingesting dirt, for sure, and was a likely player yesterday. Furthermore, our winter clouds are moisture challenged relative to the summer ones with their tropical origins and high cloud base temperatures, a second reason not to expect larger droplets in our winter clouds.
Here is the TUS sounding with some writing on it for yesterday afternoon from IPS MeteoStar. (Satellite imagery was also indicating warmer than usual tops for precipitating clouds yesterday.):
The TUS balloon sounding (“rawinsonde” in techno speak) launched at about 3:30 PM yesterday afternoon. Balloon rises at about 1,000 feet a minute, FYI. Typically they pop up around 100,000-120,000 feet! Instrument package is parachuted down so it doesn’t conk somebody on the head. Sometimes they are found and returned to the NWS and re-used! How great is that?
Here’s the punchline: If clouds are drizzling, then they are ripe, if the tops get to lower temperatures than about -4° C for what we’ve termed “ice multiplication” or “ice enhancement”. A very few natural ice nuclei at temperatures between -4° and -10° C, say, starts the process, those forming “soft hail” which then leads to ice splinters. This is the leading theory of this anomaly of ice in clouds at temperatures only a little below freezing, if you think 23° to 14° F fits that definition.
There are exceptions where this process did not explain the ice that formed at such high temperatures, so standby for further elucidation about how in the HECK ice forms in clouds at some point in the future.
As usual, no time to proof, so good luck in comprehending what’s been written.
The weather just ahead:
The second main rainband is just about here at 9:25 AM. Cloud tops will be deeper and colder than in the prior rains, raising the possibility of some thunder today, and maybe another third of an inch of rain. Watch for an windshift line cloud (“arcus” cloud) might well be seen today. That’s always dramatic and exciting here in Catalina cloud heaven.
Of course, only CLOUDS can rain, so the title is a little silly, but it sounded more dramatic like that. This is the first measurable rain, it fell between 9 and 10 PM here, in EIGHT weeks!
And you could sure smell that special fragrance from the ground and desert vegetation as soon as you stepped outside to do your exercises this morning!
Nice sunrise yesterday morning to start the day. In case you missed, of course, I am there for you.
BTW, in the captions below, I have included for you a discussion of climate issues in a kind of stream-of-consciousness format. OK, its a rant that came upon me out of the blue. CM sometimes gets mad and loses control for a few seconds; need to get some counseling maybe…
6:56 AM. Altocumulus perlucidus. Say no more. Might be a lenticular sort of on the right. Not the classic almond shape, but it did hang on for a long time in that spot. Say no more.
Kind of gray after that in Altostratus with an undercutting, lower layer of Altocumulus by mid-afternoon darkening the sky up some more. Some virga here and there with sprinkles-its-not-drizzle reaching the ground by late afternoon in the Catalina area. Here is your cloudscape for later in the day, very Seattle like during approaching storms that actually rain lightly on you for hours:
10:35 AM. Classic Altostratus translucidus, ice path in cloud all the way to the sun.10:39 AM, after walk down a slope to give YOU a view to the southwest, classic Altostratus as seen when not looking toward the sun. Hard to tell if its translucidus or opacus looking this way. By the way, even when you can see the sun, As clouds are thousands of feet thick, tops usually at Cirrus clouds levels.1:26 PM. Here come the lower, flocculent masses of Altocumulus clouds, ones composed of droplets.3:15 PM. It was all downhill for cloud bottoms after the Altocumulus moved in. Now, the bottoms are lumpy and much larger, casting them as Stratocumulus. There was some virga and very light rainshowers reaching the ground at this time, too. A few drops fell at 3:11 PM. Only the great cloud mavens of all time would have noticed. Lasted maybe one minute.3:15 PM again. Lot going on here, so I thought I would point out some things on a gray day, in particular for my fellow meteorologist Mark A at the U of WA who winters in the Tuscon smog plume. Mark is a super sleuth when it comes to snowpacks, but maybe doesn’t have so much moxie when it comes to smog. Mark, as you know may now, was fired as Assist State Climo for Washington when he demonstrated and kept complaining, along with two faculty members, that the claims of gigantic snowpack losses due to global warming (now repackaged as “climate change1“) in the Cascade Mountains were hugely exaggerated, likely the result of cherry picking a cold snowy beginning and ending with a run of El Nino winters, ones that lead to less snowpack in the Cascades of Washington and Oregon. Such cherry-picking led to a wonderful suggestion of huge declines that has led to a bounty of funding and continued employment, promotions, accolades, citations by Big Media, etc, because such claims, even if exaggerated and untrue, are what we want to hear! And, no one ever got a job for claiming they can’t find any sign of global warming, or only a little one, but rather are vilified for even suggesting exaggerations in the “global warming” domain. Mark, BTW, continuing his sleuthing has recently shown that similar claims for declines in snowpacks in Montana near Glacier National Park, have not been decreasing but rather increasing. He’ll get HELL for this one! So, more vilification is likely ahead for poor Mark, as well as more smog.
What’s ahead, besides the Big Pac 12 Fubball Game on Friday evening?
More clouds. Maybe a few more sprinkles especially tomorrow after dawn. See nice map below from the U of WA Dept of Atmospheric Meteorology (original colors on the map below by that big troublemaker, Mark Albright)
Valid for 8 AM AST, tomorrow morning, which is Thursday, in case you’ve lost count of the days of the week. The arrow denotes an upper level trough, or bend in the winds. Ahead of the bend (sometimes referred to as vorticity, or curling air, or red curly air) the air tends to rise producing cloud sheets, whereas behind red curly air, the air descends. See Seymour Hess, Introduction to Theoretical Meteorology, 1959, Florida State University Press. As you can see by the arrow, that slight bend in the winds is about to pass over your house in Catalina, and the U of Az model output from last evening sees a little rain here with that passage. Yay! Also note suggestion of bifurcated jet flow with a minor maximum in wind (slight bunching of contours) to the south of us, nearly always required for rain here in the cool season.
Here we go…..some pretty, but also dull, photos, along with some novella-sized captions as mind wandered into the obtuse while writing them.
6:44 AM. Nice sunrise due to Altostratus/Cirrus ice clouds.2:00 PM. Kind of a dull day yesterday, kind of like this blog. Stratocumulus (Sc) clouds topped Samaniego Ridge most of the day, below that gray Altostratus ice cloud layer. But those Sc clouds were too warm to have ice in them, and droplets were too small to collide, stick together, and form misty drizzle. Have to get to at least 30 microns in diameter before they stick to one another. Misty drizzle? Could be a great name for a late night female vocalist doing earthy songs like Earthy Kitt back in the ’50s. “Earthy” was much hotter than global warming.3:29 PM. An Altostratus translucidus to opacus, mostly ice-cloud with a dark patch of Altocumulus droplet cloud blocking the sun. If you look closely, (upper center) you can see a that there’s this Altotratus layer may be topped by a Altocumulus perlucidus droplet cloud layer. Yes, droplet clouds at the top of As where the temperature is lowest? Yep, this counter-intuitive finding happens all the time, up to about -30 C -35 C. Been there, measured that; in aircraft research. Ma Nature likes to form a drop and have it freeze before forming an ice crystal directly from the water vapor.4:40 PM, shot taken as we entered a local restaurant. You’ve got your two layers of Altocumulus, with some Altostratus translucidus above those, filling in the gaps. Gaps? Huh. I am reminded that I have a failed manuscript about “gaps”, these kind; Cloud Seeding and the Journal Barriers to Faulty Claims: Closing the Gaps., rejected by the Bull. Amer. Meteor. Soc. way back in ’99. It was an instruction manual, in a sense, about how to prevent all the bogus cloud seeding literature that got published in the 1960s through 1980s, and was not only published, but cited by our highest national panels and experts, like the National Academy of Sciences. Amazing, but true. I give examples. You can read about this chapter of science in Cotton and Pielke, 2007, “Human Impacts on Weather and Climate”, Cambridge U. Press, a highly recommended book. That cloud seeding distortion of cloud seeding science was due to many factors, of which perhaps the primary one was, “nobody ever got a job saying cloud seeding doesn’t work1.” This was a great segue. Of course, we have similar stresses on those researchers looking for effects of global warming nee “climate change” now days. Nobody will ever get a job (a renewed grant) saying they can’t find evidence of global warming, “Can I have some more of that money to keep looking?” And beware the “Ides of March” if you criticize published work in that domain! Think of poor Judy C , a heroine to me, and how she’s been vilified for questioning climate things.
5:29 PM, took leave from Indian food there in R Vistoso for this. Its not just anyone who would excuse himself from dinner to do something other than visit the laboratory.
That’s about it. No use talking about the rain ahead again. Seems to be a couple chances between the 20th and the 30th.
The End
—————————-
1You can make a cloud snow a little by seeding it with dry ice or silver iodide. This has been shown since the earliest days of experiments. Below, to demonstrate this, an aircraft inadvertently “seeded” this Altocumulus cloud layer. However, whether the small amount that falls out from previously non-precipitating clouds is economically viable is not known. Increasing precipitation due to seeding when the clouds are already snowing/raining has not been satisfactorily proven. As prize-winning stat man, Jerzy Neyman, U of Cal Berkeley Golden Bears Stat Lab would tell you, you need a randomized experiment and followed by a second one that confirms the original results, with measurements made by those who have no idea what days are seeded and evaluations done by those who have no vested interest in cloud seeding. Wow there’s a lot of boring information here. Getting a little worked up here, too.
Ice canal in supercooled Altocumulus clouds over Seattle, bases -23 C, tops -25 C (from PIREPS). Photo by the Arthur.
Forgetting about yesterday’s unforecast subdued afternoon convection hereabouts after about 1 PM), lets talk about the misery of others; the little crybabies that leave Arizona in the summertime, decimating its economy, so that they can be cooler and “happy” in northern climes (while dodging hail and tornadoes, we might add).
Well, how about them birdies being really COLD before very long, due to record breaking low July temperatures? Yes, that’s right, what’s left of the “polar vortex” will once again, due to global warming, of course, spin out of control and down into the northern US in just about 5-7 days. And with it, long term July low temperature records will fall in the eastern US. Count on it.
So, once again, as some scientists alleged last winter, global warming will actually cause cooling. (Almost everything that happens is due to GW these days, as we know. (“GW”, BTW, now repackaged in the catch all, temperature-neutral phrase, “Climate Change”, during the past few years because, globally, it stopped getting warmer way back in ’98, and when the years began to pile up without global warming, scientists had to find another phrase to hang their mistaken hats on. (Where was the usual scientific “caution” back then?)
HOWEVER, continuing on with this harangue, and being a “lukewarmer”, we must watch out that the coming big El Nino doesn’t release a spring-loaded, pent up release of global heat. Might well happen, so don’t give up on “GW” quite yet; hold some cards on that question for another few years.
And, of course, if there is a step jump up in global temperatures just ahead, the phrase, “climate change” will be dumped by scientists and media for “global warming” again. Count on it, #2.
But, I digress, mightily, mainly due to yesterday’s cloud disappointments.
—————————-
Not in a great mood after yesterday’s bust, as you can tell, except for that strong thunderstorm that pummeled the north side of the Catalinas beginning about 11:30 AM, that was pretty cool; had continuous thunder for about an hour and a half, too. Dan Saddle up on Oracle Ridge got 0.63 inches, but you can bet 1-2 inches fell somewhere up there.
I was so happy then.
I thought the “Great Ones” would arise upwind of us in the direction of Pusch Ridge, but no. Those clouds got SMALLER as the afternoon wore on, it was incredible, and by sunset they were gone with only trashy debris clouds of Altocumulus and Altostratus cumulonimbogenitus from great storms in Mexico drifting over our sky. Even the sunset was disappointing.
Well, that 3:15 am to 3:30 am little shower this morning than dropped 0.15 inches here in the Heights, and 0.24 inches down there at the Bridge by Lago del Oro gave a psych boost1 that got me here on the keyboard.
10:55 AM. Nearly invisible veil of ice crystals begin to fall from an older Cumulus congestus turret. This was about an hour and a half ealier than the prior day, indicating that the Cu tops were reaching that level sooner than the prior day, suggesting bigger things (I thought). When you see this happening this early, you also look for an “explosion” some massive turret to suddenly blast out of these developing clouds, and that did happen within about half an hour after this.
10:55 AM. Close up, in case you don’t believe me.
11:04 AM.
7:33 PM. Your sunset.
Today? Check here. Once again, mod expects early Cumulonimbus on The Lemmon, then groups of thunderstorms move in during the evening (as was more or less predicted yesterday, but didn’t happen.) Will go with mod again, though, because I would like that to happen.
The weather way ahead
We’ve talked about cold air, now to balance things off, how about a discussion of the warm air ahead? Real hot air.
Was blown away by the spaghetti outputs from last night for the period of about two weeks from now. You can see the whole package from the NOAA spaghetti factory here. Below, our weather in 12-15 days, usually beyond confident predictions, but not here:
Valid at 5 PM AST July 22nd. Massive blob of really hot air settles in over the western half of the US. In this map, the most reliable long term predictions are over the western half of the US and over the Saharan Desert (indicated by the lack of lines in those two areas. A lot of lines means the weather pattern is pretty unpredictable.)
Valid at 5 PM July 25th. Massive upper level blob of really hot air continues to dominate the western half of the US.
&
So
The hot blob of air should lead to record HIGH temperatures all over the place in those days beginning around the 20-25th of July. Rainfall here? Indeterminant. If the high center sits over us, it might just be hot, real hot, but dry.
But, if the configuration aloft is as shown in the second plot, it could be very wet as tropical disturbances shift northwestward from Mexico into Arizona.
Sorry, can’t do much with precip from these, I don’t think.
The End, and covering all the possibilities, CM
==================================== 1Paraphrasing, the song for weathermen, those speaking to clouds; “Rain on me, when I’m downhearted….”
Valid two weeks from now, Thursday, 5 AM, March 20th. Massive trough, at last, settles into the West for awhile, more in keeping with climo. Keep jackets at the ready. Rain? Dunno yet, but probably on the correct side of 50-50 beginning around the 17th. Changes! Warm and dry for a coupla days, followed by a parade of troughs, quite a few minor ones over the next week or so, before the Big One forms. Above, this is a VERY strong signal in the spaghetti for two weeks out, and so got pretty excited when I saw it, as you are now, too. So, when mid-March arrives, get ready!
Was going to close with this NWS forecast for Catalina (might be updated by the time you link to it), but then saw just now that Saturday, the day a cold, dry trough is over us, it’s predicted to be 76 F here in Catalina, too warm. I would prepare for upper 60s.
Canadian model has even had rain near us at times as this trough goes by on Saturday, but only here in the 11th hour (from yesterday’s 5 PM AST run) has the US model indicated that the core of the trough and rain near us on Saturday, as the Canadian one had for a few days before that. Hmmm…
The fact that any trough is ending up stronger than it was predicted, as the one on Saturday, is a good sign of being close to the bottom (farthest S lattitude) of the “trough bowl”, that location where troughs like to come and visit. So, maybe this is a precursor for us, this unexpected little cool snap on Saturday. Maybe climatology is beginning to work its wonders at last in the West.
Powerful storms begin affecting the interior of the West and Great Basin in 10 days, and that pretty much marks the time when the winds here start to pick up to gusty at times as strong low centers develop to the north of us, and the major jet stream subsides to the south toward us.
It will be the end of the warm winter era for us, too. While cold settles in the West, it will mean very toasty weather back East from time to time, something those folks will greatly enjoy.
———————–Climate issue commentary; skip if you’re happy with the climate as it is now—————————-
As you likely know, much of the upper Midwest had one of its coldest winters ever, and just a few days ago Baltimore (locally, “Ballimore”, as in “Ballimore Orioles”) had its lowest measured temperature EVER in March, 4 F!
“RECORD EVENT REPORT
NATIONAL WEATHER SERVICE BALTIMORE MD/WASHINGTON DC
0930 AM EST TUE MAR 04 2014
…DAILY AND MONTHLY MINIMUM TEMPERATURE RECORDS SET AT BALTIMORE
MD…
A DAILY RECORD MINIMUM TEMPERATURE OF 4 DEGREES WAS SET AT BALTIMORE MD TODAY…BREAKING THE OLD RECORD OF 5 SET BACK IN 1873.
THE MINIMUM TEMPERATURE OF 4 DEGREES FROM TODAY WAS ALSO THE LOWEST MINUMUM TEMPERATURE RECORDED ON ANY DAY IN MARCH FOR BALTIMORE. THE PREVIOUS RECORD MINIMUM TEMPERATURE FOR MARCH WAS 5 DEGREES ON 4 MARCH 1873.”
(Thanks to Mark Albright for this official statement; emphasis by author)
If you’ve followed some media reports, the exceptional cold of this winter has been attributed to global warming, a hypothesis that has been questioned by climo Big Whigs. However, if it is right (which even lowly C-M doubts), parts of the upper Midwest may become uninhabitable due to cold in a warming world, quite a weather “oxymoron.”
Also, if you’ve been hearing about weather extremes and global warming (AKA, “climate change”) you really should read this by a scientist I admire, Roger Pielke, Jr., at Colorado State Univsersity, his rebuttal to a Whitehouse science adviser’s characterization of his testimony before Congress about weather extremes (they’re not increasing).
What seems to be happening in climate science is the opposite of what our ideals are. Our conglomerate of climate models did not see the present “puzzling” halt to global warming over the past 15 years or so as CO2 concentrations have continued to rise. However, instead of being chastened/humbled by this failure, some climate scientists seem emboldened and only are shouting louder about the danger ahead. Presently we are struggling with a number of hypotheses about why the hiatus has occurred (e.g., drying of the stratosphere which allows more heat to escape the earth, more aerosols in the stratosphere in which incoming sunlight is dimmed some as it was due to the Pinatubo eruption in 1991, ocean take up of extra heat, the Atlantic Meridional Overturning Current slowing down, causing northern hemisphere continents to cool off.)
UPdating at 8:28 AM: This from the “current”issue of Science (Feb 28th) about the Global Warming Hiatus (GWH): It might be due to the cold waters of the eastern Pacific, now reigning year after year almost for the whole time of the “hiatus.” (BTW, you’ve heard of it, haven’t you, that hiatus in rising global temperatures? If not, write to your local media sources about this. Its pretty important.) Science mag is $10 if you want to buy it off the newstand.
What ever the cause of the puzzling hiatus in warming, it was not accounted for in our best models right from the get go, and so, naturally there SHOULD be caution on everyone’s part until we know what happened and can get it right in those many climate models..dammitall! Unless we know what done it, how else can we have confidence that they are going to be very accurate 100 years out????
———————————————end of climate issue/rant module————————–
Here are a couple of nice sunset scenes from March 4th, that same day it was SO COLD in Ballimore, these to help you cool off personally after I got you pretty worked up with climate issues. Hope I didn’t spoil your day, and try not to be mad at work thinking about it.
6:19 PM. Row of Cirrus lenticulars appears below CIrrus/Altostratus layer. I think they were too high to be Altocumulus lenticulars, and dissipated into ice puffs right after this shot.6:31 PM. Cirrus spissatus (thicker parts) with strands from Cirrus uncinus under lit by the sun.
I smiled seeing the groundskeepers scurrying about, sweeping and scraping snow off the courses and environs at the Dove Mountain golf tournament yesterday. I was smiling because the golf culture here is so different from that in Seattle, Washington, much more “pampering” here. Due to frequent inclement weather in Seattle, we have to toughen our skins against weather if we want to play golf. Rain? Snow? No problem.
In Seattle, golf season begins on March 1st. That’s because in March in Seattle, its only raining (or occasionally snowing) on every other day by then, not every day, as earlier in the winter.
So we’re going golfing on March 1st, dammitall, no matter what!
So shop keepers like this one below on Aurora Avenue in the north end of Seattle, knowing that Seattle golf culture, exult with big signs like this one when March 1st arrives!
The golf weather culture in Seattle, Washington, as represented by this sign. Photo by the writer, March 1st, 1990.
Inaccuracy in media re Catalina snowfall or maybe it wasn’t: a tirade
I was thinking that maybe a tirade would be a nice change of pace for you before some cloud discussions.
First, since I heard a weather presenter report that “2 inches” of snow fell in Catalina, a visual correction to that report. There was FOUR inches on the ground after settling/melting during the day and night of the 20-21st. If there is FOUR inches the following morning, it HAD to have snowed quite a bit MORE than FOUR inches! (The total depth of snow that fell was 5.5 inches here on Wilds Road).
Here is the proof, 4 inches of depth as measured by a raingauge dip stick, one tenth inch markers are 1 inch in length–I didn’t have a regular ruler. Some of the labels indicating light amounts of rain have worn off while the stick was being used in Seattle for 32 years, so you’ll have to count down from the 1.00, 90, 80 hundredths labels, ones clearly visible. For added proof I have added a second photo, and if you call now, you’ll get a third photo free plus for $75 for handling and shipping…
7:02 AM, February 21st. A raingauge measuring stick protrudes from a FOUR-inch depth of snow on a hitching post (where some snow could have even slipped off, or blew off!)7:04 AM. A slightly higher depth on a second hitching post–oh, yeah, leading the big western life here in Arizony with a horse and hitching posts.
I felt sad, though, remembering the words of humorist Dave Barry, speaking to the National Press Club back in ’91 I think it was, when he diverged from humor into a serious note, admonishing his Press Club Audience: “Why can’t we get it right?1”
Maybe in our case of the missing snow, it was because the person that called in the report was not a Cloud Maven Junior, and did not know how to measure snow. Maybe less actually fell where that person was (unlikely). Let us not forget that the snow on a flat board in Sutherland Heights, above Catalina proper, measured at nearly the same time as this, was SIX inches!
Yesterday’s clouds, and those snow-covered mountains
While it was sad to see so much snow disappear so fast, it was, overall, another gorgeous day in a long nearly continuous series of ones since the beginning of time here in Arizona, except maybe for those days of upheavals and dinosaurs and then when it was underwater, a remnant of the latter epoch as shown here in this fossil of a hydrosaurus, a precursor to grain eating critters like the Perissodactylas we have today…(horseys and such). As you can see, the teeth here were for eating something like mueslix, not for ripping flesh. I can’t believe all the information I am providing you today!
Possible hydrosaurus fossil encountered on a hike in Catalina State Park (still checking on what it is). Finding was reported to park rangers.
Here are some shots with some notes on them or in the captions. First those MOUNTAINS!
8:21 AM, February 20th, looking east from Sutherland Heights, which had SIX INCHES of snow on the ground at this time. Stratocumulus clouds top Samaniego Ridge.9:13 AM. The snowy Tortolita Mountains with some Altocumulus perlucidus above.
2:25 PM. With most of the snow already gone around Catalina, the majestic Catalina Mountains remind us of our great February 20th snowstorm and why we live here.
2:26 PM. While it was serene-looking over the Catalinas, to the southwest the sky was filling in with Cumulus and slightly higher Stratocumulus clouds. Why don’t you see virga even though we know they are at below freezing temperatures? In unison: “NO ICE!” (Tops too warm and cloud droplets likely on the small side.) This was to change in the next couple of hours.
3:24 PM. But first, another look at the Catalinas from Shroeder Ave in Catalina because I think its worth it before continuing. Golder Ranch Drive is on the far left.
5:25 PM. Clearly there has been a change in the temperatures at the tops of these clouds, likely now colder than -10 C. A trough of colder air was approaching aloft, and that likely lifted and cooled cloud tops. The cloud layer was due mostly to the spreading out of Cumulus tops (Stratocumulus cumulogenitus). The TUS sounding indicated cloud tops were about -13 C, capped by a very strong stable layer. There was a fall of sparse drops around this time, so some of it was getting to the ground.
The weather ahead
Cold then HOT. Hot when? Heat’s on already by March 1st for sure. Look at this “signal” in our trusty NOAA “ensembles of spaghetti” from last night:
Valid for 5 PM AST, March 1st. You won’t see a signal stronger than this one for 8 days from now. Likely will reach into the 80s when this ridge of warm air is fully developed.
The End, at last. Anyone still there?
—————————
1Deadlines have a way of getting in the way of “truth.”
With no rain in sight, and only modest temperature fluctuations ahead, some reading material is presented to you today with commentary today, a “soapbox day.”
Cloud photos from yesterday are at the bottom if you want to skip to that and avoid thinking about things because its too early in the morning to get riled up.
I will start with an opinion piece concerning climate change and climate science from Australia. It also mentions a recent event in the climo community concerning a Southern Hemisphere temperature reconstruction and the apparent rejection of what would have been an important paper by the peer-reviewed journal it was submitted to after crucial errors were found by an outsider/reviewer. The author of this opinion article also mentions “climategate” a chapter of science that had a profound effect on this writer. Now there are polemical aspects, not all of which this writer would agree with, still, its worth reading:
The link to this article was circulated to our Atmos Sci Dept by one of my best friends, and really a science hero to me, Mark Albright, the former Washington State climatologist. Mark was a mild-mannered researcher lurking in the background at the U of WA for many years until he got upset over what he (later joined by two allies there) was to show were vastly exaggerated journal-published and media accounts of snowpack losses due to GW in his own backyard, in the Cascade Mountains of Washington and Oregon. Mark felt science had been corrupted by dogma, perhaps the pursuit of funding; he has not been the same since. Believe me, I know what he has been through.
A retired distinguished professor at the U of WA Atmospheric Sciences Department circulated a counter articleto the one that Mark circulated, also worth reading for the “other side.” It appears below, along with that professor’s note about the article Mark circulated. I felt this note by the professor should be included, too:
In the headline of this second article, the word “denier” is used in its title as a pejorative, mass label for those who question some of the global warming publicity stunts (assigning particular storms like Sandy to GW) down to results published in peer-reviewed journals, such as reports of exaggerated snowpack losses. Not good, and that headline tells you where that article is headed: criticism is not to be tolerated. But it also shows that the majority of science being published on climate change supports the finding that a warmer earth is ahead. But there is a reason for that; its being pushed by the monumental amounts of money being poured into that climate research domain.
There are many of us out there that do believe that funding is pushing the research on global warming in one direction in this job-poor era we’re now in, just as it did, and still does, in the cloud seeding domain: no one ever got a job saying cloud seeding doesn’t work. In my own career–yes, Mr. Cloud Maven person had a professional research one, and one spiced with controversy1 over several decades–the opinion article from Australia rings true in many aspects about how science works and what influences a preponderance of “conclusions” that get published in journals.
In the climate funding domain, don’t look for more funds if you conclude a million dollar study by indicating that you didn’t find any sign of warming over the past 30 years, as is the actual case in the Pacific Northwest. NO ONE is going to touch that hot potato and serve a finding like that up to a climate journal. Its not gonna fly. It makes explaining global warming difficult. And as Homer Simpson advises, “If something’s hard to do, its not worth doing.”
But at the same time, a counter finding to global warming presents to those of us who try to be truly ideal, disinterested scientists, a fabulous opportunity to look into something that is not immediately explicable. As scientists, we should live for opportunities like this!
But will it happen, will some brave soul at the University of Washington or elsewhere delve into this counter trend and try to explain why its happened in a journal article? Its hoped so.
But those of us, still on the GW bandwagon, if grudgingly so due to the actions of some of our peers, know that regional effects of GW are dicey. Some areas will warm up more than others; cooling is possible if the jet stream ridges and troughs like to hang out in different positions than they do today. And of course, if we smog up the planet too much, all bets on warming up much are off since clouds act to cool the planet, and pollution makes clouds last longer, especially over the oceans where pollution can interfere with drizzle production, which helps dissolve shallow clouds, and pollution causes more sunlight to be reflected back into space. The cloud effects are being more carefully, precisely evaluated in our better computer models.
——————-
It is ironic, too, that the second article, the one passed along by the professor, ends with the mention of plate tectonics “as the ruling paradigm of science” as it is.
But, some word about how that paradigm came about; it was a “long and winding road.”
Alfred Wegener, a meteorologist, first proposed the theory of continental drift/plate tectonics around the turn of the century. A nice account of this science chapter about origin of the theory of plate tectonics is found in the book, Betrayers of the Truth, by then NYT science writers, Nicholas Wade and William J. Broad.
Because Alfred Wegener was a meteorologist, however, and NOT a geographer, namely was an outsider to the official science community studying the continents and how they got that way, his ideas were laughed at, not taken seriously for more than 40 years! Only in the 1960s was the idea of plate tectonics accepted.
I mention this tectonic chapter of science because there is a similar chapter that reappears constantly now in the climate debates. Several of the strongest critics of GW results, critics that have delved deeply behind the scenes into published findings of climate change in a scientific manner, much as this writer did concerning cloud seeding experiments in the 1970s-1990s, are criticized for being “outside of the group”, just Alfred Wegner was in his day rather than those “in the group” considering and acting on whether the findings of outsiders are valid.
Fortunately, this is beginning to change because, guess what? Outsiders have found some pretty important stuff that HAD to be addressed in spite of the desires of some idealogues out there pretending to be objective, disinterested scientists. Science as a whole, still works.
A cloud note: Alfred Wegner is also known for proposing the idea that ice crystals in the presence of supercoooled water (a common event in the atmosphere) grow and fallout, leading to precipitation at the ground, known as the Wegner-Bergeron-Findeisen mechanism. Every 101 meteorology textbook points this out.
The last photo below is a demonstration of that effect; those sunset supercooled Altocumulus shedding a few ice crystals that grew within them.
Yesterday’s clouds
7:33 AM Cirrus fibratus radiatus. Sometimes perspective makes banding look like its converging or radiating. I estimated that this was not the case here.4:31 PM Parhelia-Sundog-Mock Sun in an ice cloud with hexagonal plate llike crystals, ones that fall face down and cause the light to be refracted and separated. Here’s is a link explaining this phenomenon.5:24 PM. A classic Arizona sunset due to the under lighting of Altocumulus perlucidus. Some very fine virga from these clouds can also be seen. When the virga is this fine, the concentrations, as you would imagine are very low and the crystals falling out are especially beautiful because they have not collided with other crystals and broken into pieces as happens in heavy virga shafts.
——————————————————————————-
1Some examples of the controversy the writer has been involved with:
“We don’t hate you but we don’t love you, either.”
This quote from a leading US cloud seeding scientist to the writer at an American Meteorological Society conference on cloud seeding and statistics after his cloud seeding experiments had been reanalyzed by the writer.
“I want you to leave my office and don’t come back. Just do your own thing.”
This quote from THE leading cloud seeding scientist of the day when I went to his country to see for myself the clouds he was describing in peer-reviewed journal articles, descriptions that I had doubts about. His descriptions were later shown to be far from reality.
And, from an outside observer, and well-known cloud researcher at the National Center for Atmos. Research in Boulder, a comment to the writer when he visited the University of Washington:
“I think the (cloud seeding) community sees you as a ‘gadfly’.”
From the Oxford Concise Dictionary, “gadfly”:
“A cattle-biting fly; an irritating, harassing person.”


