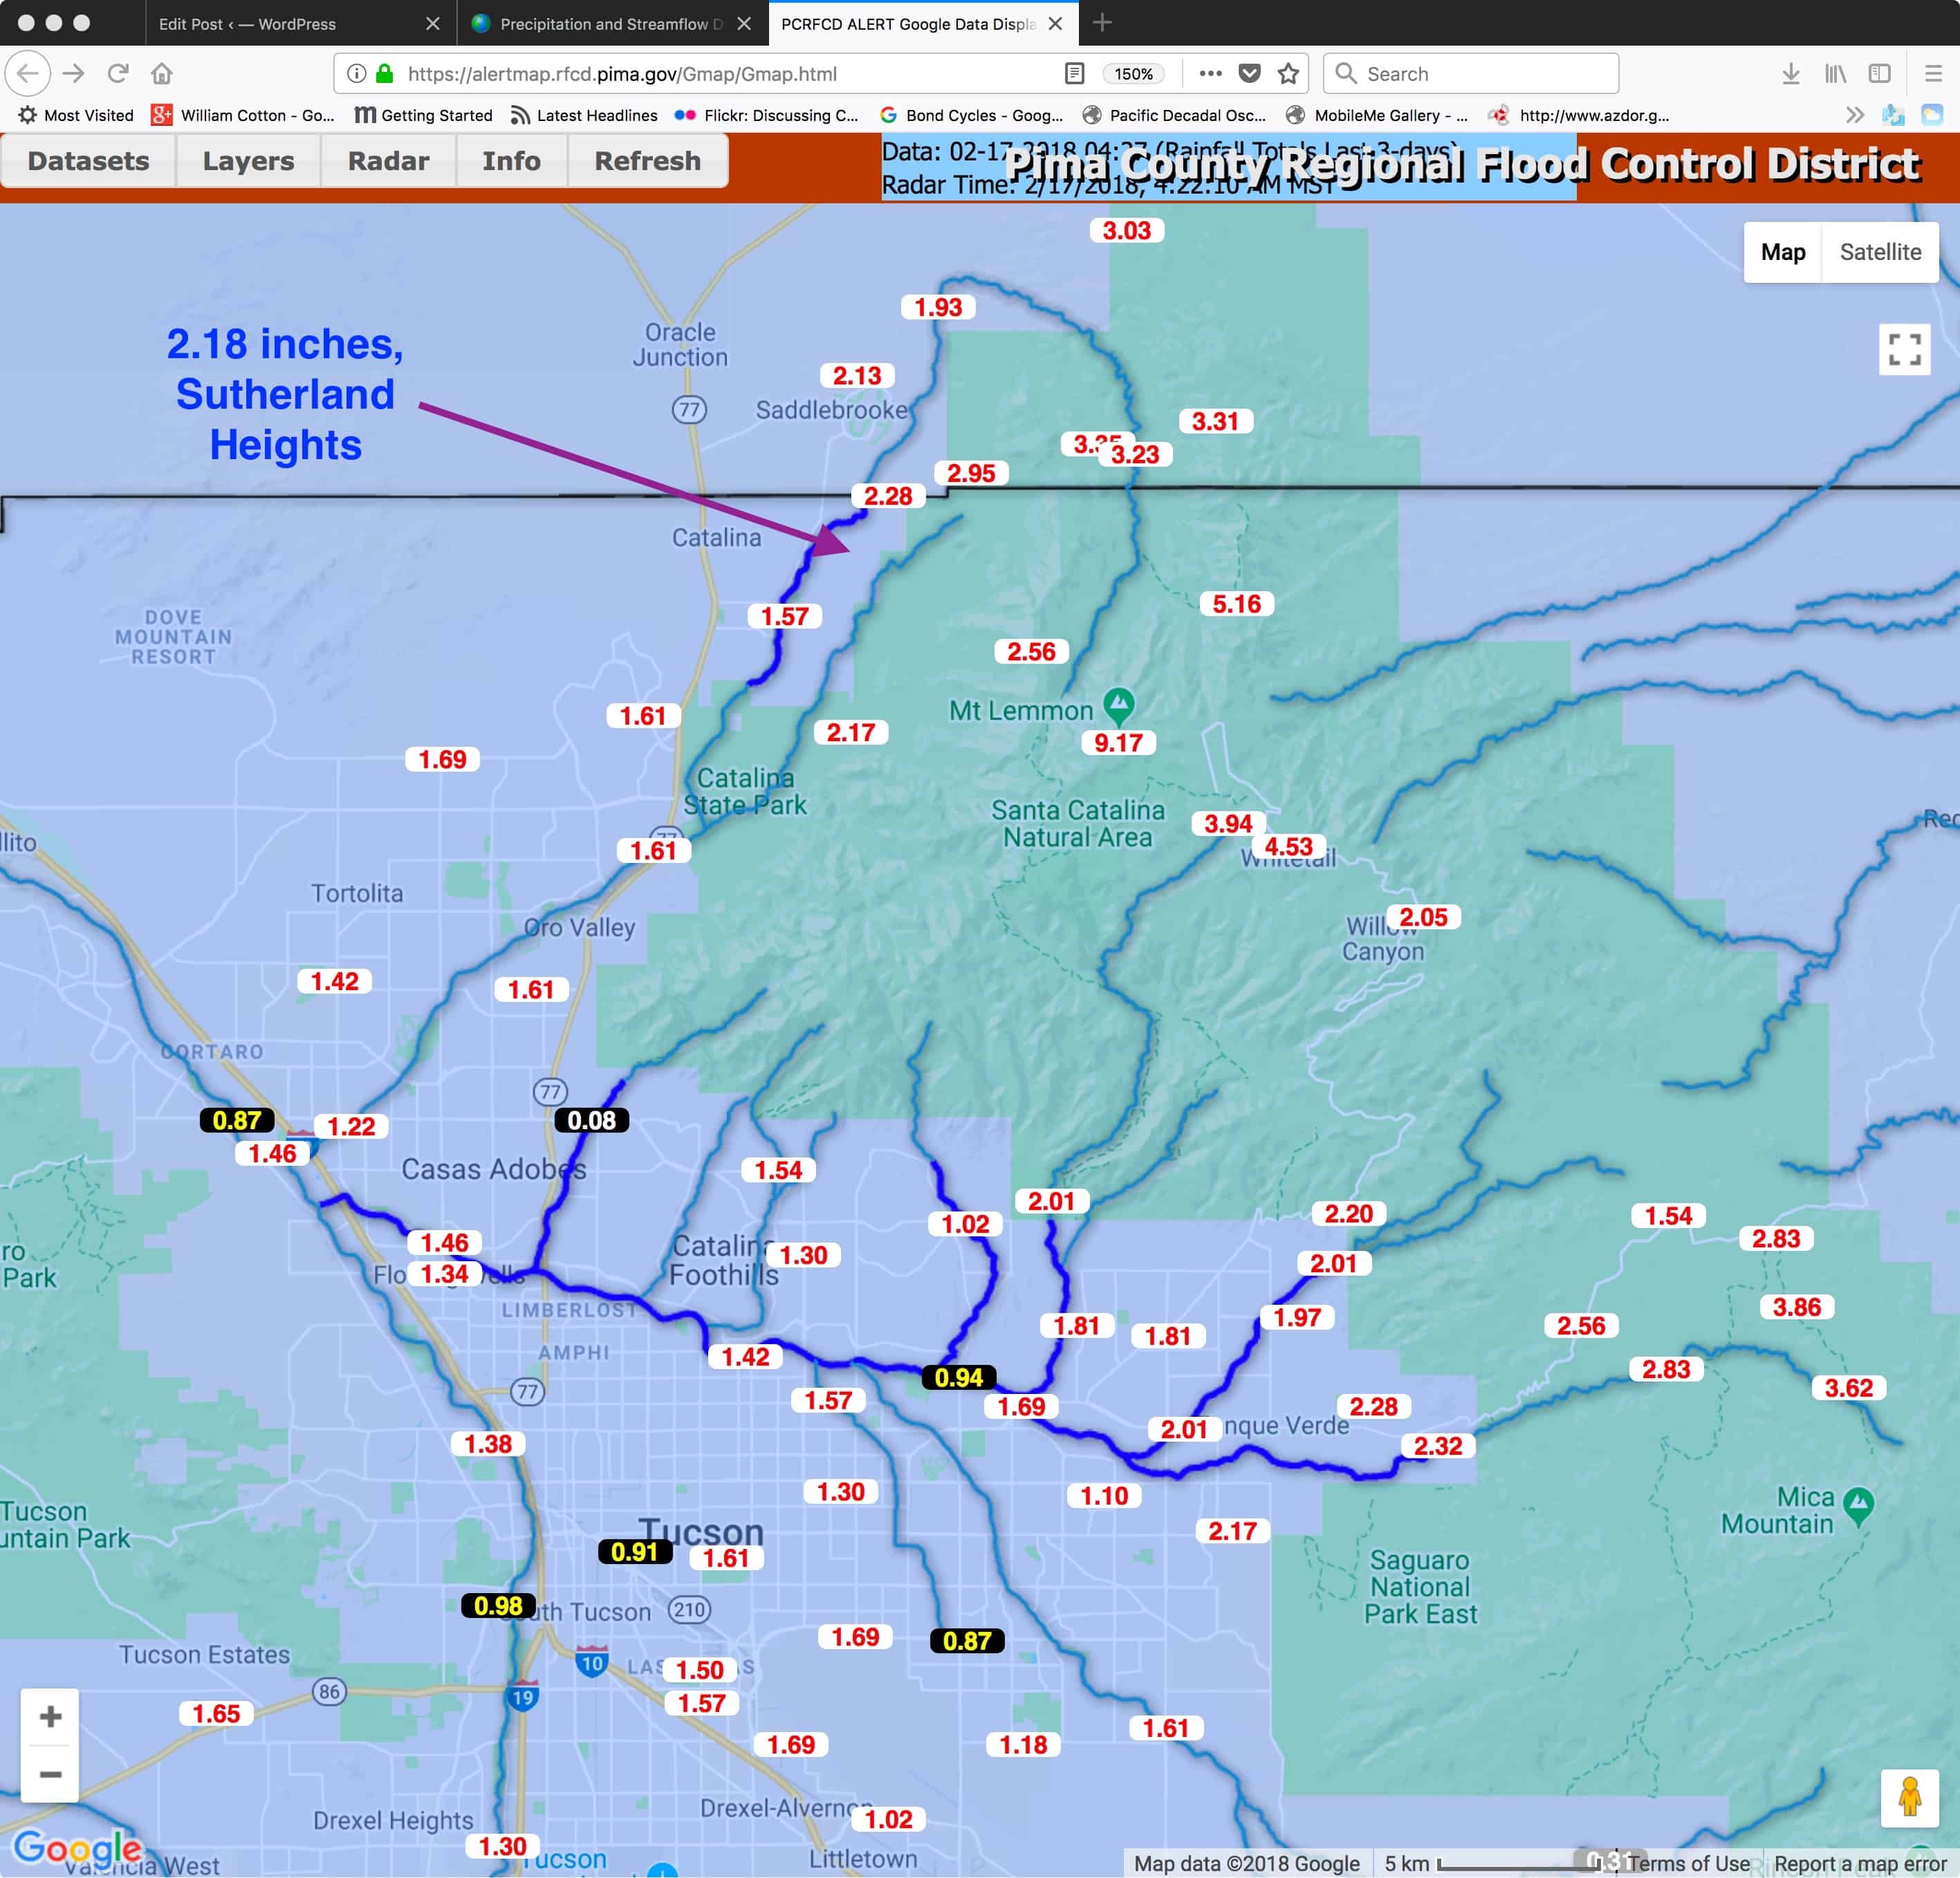
Toot, toot, drip, drip. Rain fell on Catalina, Arizona, for the third day in a row, bringing our three day total, at least in Sutherland Heights, Catalina, to 2.18 inches, and over NINE inches at Ms. Mt. Lemmon, subject to quality control later.
Here’s a nice map, courtesy of the Pima County ALERT network, whom I haven’t actually asked to post this but you can go here and see it in the original:
Yesterday’s clouds
No photos, still suffering from WP or godaddy hosting chokehold. Even text takes seconds to appear! Worse than dial up. The above jpeg, just 1.4 mb, took several minutes to upload!
The weather way ahead and soap-boxing the erroneous, “warm temperatures” expression
While the NOAA ensembles let us (me) down in mid-January when it appeared that troughs would dominate in late January through early Feb (it wasn’t even close to that interpretation, and the first time I’ve seen those crazy plots do so badly, will go with them now and present a couple that strongly suggest the drought pattern has been decimated for Arizona and the Southwest; no more weeks of no rain or rain threats, with ridiculously warm days (note, not days with “warm temperatures”, a temperature is a unit of measurement, not a thing that can be cold or warm—-got it? Its the AIR that’s warm or cold, or a day, a month. What if, when a high pressure sat on Arizona, that I said we had really “dense millibars today”, to make a comparison showing how WRONG it is to say, “warm temperatures.” Its HIGH temperatures or LOW temperatures, etc. Tell your friends….
OK, will go through that bit more of uploading misery with these stupefying spaghetti factory plots. Inspect them and be happy if you like unsettled weather, storms threatening or actually occurring every few days. The first one is a week from nows, then ten days from now, and the last one two weeks from now. Exult over the troughulent regime we’re now in! Yay!
This “ensemble” approach, where tiny errors are deliberately input into the model data as the computer run begins is deemed one of the great advances in forecasting, this due to more powerful computers that can crunch so much global data so fast. There are always errors in the data, and we can’t measure the atmosphere over the whole globe in an instant, and this is a way of determing what the errors might do to the forecast. Heck, we don’t even know what the real errors are. So we input some and see what happens.
The greater the effect errors have, the more spread out and chaotic the patterns are. When the red and blue lines stay close together, it indicates that at least, tiny errors, don’t have much effect. Normally, after ten to 15 days, the lines are kind of a mess, with only general patterns discernible. (Sure is annoying typing and waiting seconds to see what it is you’ve typed!)
In last evening’s global data runs, the red lines in our domain stay pretty bunched up, indicating a strong indication of troughing over these next two weeks, even out to 15 days! So, cloud maven person is pretty excited thinking that maybe a wildflower or two can now pop up, and our spring greening will go forth.
Just yesterday on a dog walk to the Sutherland Wash, tiny plants were bursting forth from the ground. What a miracle that is. (The wash had no water in it.)

The happy ending
Art- I’m in the blue spaghetti: We’re going to see snow, wind and colder temperatures. Winter has arrived late, but it’s here at last.
My friends in Seattle are complaining already. We’re gonna get awfully cold, too! Will be nice to see some snowpack buildup in the AZ mountains.
a