I submitted a long “review and enhancement” on this article by Dr. Bernard A. Silverman’s 2001 massive (14,000 word) review article in the Bulletin of the American Meteorological Society (BAMS) in March 2002. My “Comments” were too long, the Bulletin editor said, and so it never even went to peer review. And, he was right, it was too long.
Silverman’s long review article is here. It’s well worth reading and there is much we agreed on in those days, if anyone cares:
2001 Silverman Critical assessment 2001ocr
Most of my “review and enhancement” of Silverman’s excellent, unbiased article despite his pro-cloud seeding stance, concerns the Israeli clouds and cloud seeding experiments. I am an expert in that domain, having spent 11 weeks in Israel in 1986 studying their clouds, rain and sounding data with the full cooperation of the Israel Meteorological Service. The ensuing article was published in the J. Roy. Meteor. Soc. in 1988. The gist of it: the clouds of Israel were not being described correctly by the leaders of cloud the seeding experiments at the Hebrew University of Jerusalem. They described them as plump with cloud seeding potential when they were not.
In the early 1990s, I re-analyzed the Israel-1 and Israel-2 randomized experiments along with my co-author, Peter V. Hobbs, director of the Cloud and Aerosol Research Group at the University of Washington, Seattle. The article, which concluded that there had been no cloud seeding induced increases in rain in these experiments, was published in the J. Appl. Meteor. in 1995. Several cloud seeding-centric scientists commented on that paper in 1997 along with our “Replies.”
When I saw Dr. Silverman’s 2001 article and that he had misdescribed some of my own work, I went into a controlled rage of objectivity (haha), as scientists do from time to time, and decided to write a “Comment.” But, as I added more and more material, my “Comment” became an article in itself, even a “novella” of sorts. Eventually those 2002 “Comments” led to a full blown article: “The Rise and Fall of Cloud Seeding in Israel,” that manuscript submitted in 2017 and rejected by BAMS in 2019 (J. R. Fleming, private communication) after two split reviews. BAMS did not allow me to respond to the comments of the two reviewers or revise my manuscript.
Well, after all these years, I just re-read my critique of Silverman’s 2001 article and thought it had some merit for those of you interested in 1) cloud seeding, 2) Israel. So, here it is, as it was submitted with a couple of minor corrections and an update. Caution: the subject of scientific misconduct is broached. That didn’t help me in 2002, either, but I’ve left it in anyway.
———————————————————————
- Introduction
Silverman (2001, hereafter S01) is to be commended for attempting the prodigious task of making sense of all of the randomized cloud seeding experiments targeting cumuliform clouds during the past 40 years. In large measure he has succeeded and made a significant contribution to the field of weather modification. Still, some comments and clarifications are needed .
In his historical overview of cloud seeding, S01 should have mentioned the great effort that an independent agency, the U. S. Weather Bureau (USWB), made in attempting to replicate the early and often spectacular claims of seeding successes that began to appear in the late 1940s (e.g., Kraus and Squires 1947). The USWB (i.e., Coons et al. 1949; Coons and Gunn 1951) seeded dozens of summertime cumuliform clouds in Ohio and along the U. S. Gulf Coast that were similar to clouds in several of the projects examined by S01 with up to “60 lbs of dry ice per mile.”
They found no evidence of any particular seeding effect.
On the contrary, USWB observers found that the turrets usually dissipated or settled back in altitude after they had been seeded.
The USWB scientists also made an unexpected and important discovery: ice was already forming in clouds with tops as warm as –6°C before they had seeded them. The occurrence of ice was at far higher temperatures than was expected from ground ice nucleus concentration measurements on which seeding hypotheses were based. Those ground measurements suggested that ice would not form until clouds reached temperatures of –15° to –20°C. This stunning USWB observation was to be confirmed in more sophisticated aircraft measurements more than ten years later in Missouri during Project Whitetop (Koenig 1963).
The USWB’s independent seeding trials that showed little evidence of seeding having affected rain on the ground, crude as it was, stands tall today relative to the same conclusions about the seeding of cumulus clouds reached by S01 50 years later.
- Why weren’t seeding effects produced in the projects reviewed?
One would think that we know how to seed clouds successfully with indisputable scientific evidence for more rain on the ground after more than 50 years of attempting to do so. However, the production of seeding effects in rainfall on the ground have been preempted by three crucial cloud factors, particularly so in the projects examined by S01: 1) Due to the relatively warm cloud bases in the projects he examined, natural ice forms in, or can be expected to form, in the targeted clouds either within or soon after their summits ascend above –5° to –10°C, the temperature range where seeding might take place; 2) the formation of ice crystals is vastly increased in the temperature range of –2.5° to –8°C in clouds with warm bases once ice has formed due to an explosion of ice splinters and fragments caused by secondary ice-forming mechanisms associated with large drops; and 3) perhaps most surprising to the Bulletin reader: we don’t yet know what the true concentrations of ice particles are in clouds today due to past instrument limitations that have only recently been overcome.
Today’s knowledge concerning ice in clouds has been limited because of our inability to reliably measure ice crystals smaller than about 100 mm in maximum dimension. Thus, published concentrations, even as high as they have been, have had to necessarily omit the contribution of very small ice crystals to the total in the cumulus clouds that have been sampled (e.g., Koenig 1963; Rangno and Hobbs 1991, 1994; Levin et al. 1996). Early measurements with a new probe capable of measuring these small ice crystals suggest that the total ice crystal concentrations in clouds will be several times higher than previously thought (e.g., Lawson and Jenson 1998). Hence we are once again on the verge of learning what the USWB did more than 50 years ago: there is more natural ice in clouds than we imagined.
Therefore, the seeding experiments discussed by S01 were, in a sense, premature since the experimenters had made, and perhaps unavoidably, erroneously low estimates of the amount of natural ice that formed in clouds. In essence, they were pouring water into a river without knowing whether there was a flood already in progress.
This fact has been demonstrated by Stith et al. (2002) who found little liquid water in tropical cumuli above the –12°C level and but “traces” of liquid water by –18°C. The clouds studied by Stith et al. represent the kinds of clouds seeded in several of the projects reassessed by S01, those in tropical regions with warm cloud bases and moderate updrafts. The liquid water in the clouds studied by Stith et al. had been consumed by the explosive natural ice formation taking place in rising turrets at temperatures before they reached the –12°C level and that were glaciated by –18°C.
- Project Whitetop
Project Whitetop (Braham 1979) still remains as one of the most important, enigmatic, and well designed of all the randomized cloud seeding experiments carried out to this day and it was surprising that it was not mentioned by S01. It was worthy of discussion because of its design and results, and because of the seeding method employed, which probably constituted its only major design flaw.
- What made Project Whitetop so special?
Project Whitetop had the three critical attributes that characterize sound experimental design: the experiment was 1) randomized, 2) the target area and the specific rain gauges for evaluation purposes were identified before the experiment began, and 3) the results were evaluated contractually by those removed from the conduct of the experiment, the institution carrying it out, and the evaluators had no vested interests in cloud seeding.[1] The importance of these attributes in the conduct and evaluation of cloud seeding experiments cannot be overemphasized. We do not know from S01 which, if any of his reviewed experiments, had these essential design attributes.
Project Whitetop stirred great interest and controversy when the initial analyses following its conclusion suggested strong decreases in rainfall had been produced by cloud seeding over a wide area (e.g., Lovasich et al. 1969). Later analyses, however, found that rain was also less on seeded days over wide areas upwind of the seeding line as well and subsequently, most scientists now believe that the random draw was uneven and produced a false negative (Type II statistical error or “unlucky draw”) and seeding actually produced a null result overall (Braham 1979).
What went wrong in Project Whitetop? First, just as the USWB scientists had found in similar clouds more than 10 years earlier, natural ice was forming in the Project Whitetop clouds at shockingly high cloud top temperatures, between –5° and –10°C, and clouds glaciated (turned completely to ice) with great rapidity (Koenig 1963; Braham 1964). Without doubt, “ice multiplication” as this phenomenon was later dubbed by Hobbs (1969), seriously compromised the chances of creating more rain on the ground through cloud seeding. This is because the purpose of the seeding was to create more ice in clouds that were (erroneously) believed by the experimenters to have little ice.
The warm-based Missouri clouds, like those projects in tropical settings discussed by S01, and also like those in Israel, produce copious quantities of large drops (>23 mm diameter) and even precipitation-sized drops (>200 mm diameter) as they ascend past the freezing level, making them ultra-ripe for the onset of various natural ice multiplication mechanisms (e.g., Hallet and Mossop 1974; Mossop 1985; Hobbs and Alkezweeny 1968). In themselves, these mechanisms can produce effects similar to those produced by cloud seeding (Rangno and Hobbs 1991, 1994).
- Were the clouds seeded effectively in the experiments reviewed?
Again, Project Whitetop has something to say about the projects assessed by S01. Project Whitetop had, in retrospect, a key design flaw: the seeding method used. Instead of injecting the seeding agent into updraft regions of clouds upwind or over the target as would be done today, the three aircraft used in this experiment dispensed it in lines about 50-km long upwind of the target at a height that was just below the bases of the cumulus clouds that might have been forming in the area. Suitable cumulus clouds (building ones with, or about to have supercooled tops) with updrafts above the aircraft as they dispensed silver iodide was not a criterion for releasing the seeding agent in Project Whitetop.
Whether the silver iodide released by the aircraft in Project Whitetop ever got into suitable clouds, whether it did so at the right locations upwind or in the target, and in what concentrations if it did, was never established. In fact, the “patrol” seeding, as it is sometimes called, appeared to be relatively ineffective from the ground measurements of ice nuclei concentrations that were made downwind in the target (Bouqard 1963).
Thus, a crucial link in the chain of events in the seeding process in Project Whitetop was completely missing. The method of seeding suggests another reason why results of Project Whitetop were doubtful; the seeding hypothesis itself may never have been fully tested.
The questionable seeding method used in Project Whitetop was similar to the one that was adopted in the first experiment in Israel that was begun at about the same time as Whitetop, and this in turn affected the choice of seeding method used in the Puglia experiment (List et al. 1999) that S01 discussed. Patrol seeding was used in the Puglia experiment because it appeared to the Puglia design team that the first experiment in Israel had been a statistical success, and they wished to replicate exactly in their own experiment the seeding methodology that had apparently brought success in Israel. Whether, in fact, the first experiment in Israel was a success is now subject to doubt on several accounts (e.g., Rangno and Hobbs 1995, 1997a,b.)
The assumptions about dispersion made by the Project Whitetop design team also represents one of several recurring themes in cloud seeding experiments: an exaggerated view of dispersion, an accompanying lack of dispersion measurements prior to cloud seeding experiments, and an underestimate of the natural ice concentrations in the clouds to be seeded.
- The two randomized seeding experiments in Israel
The two randomized experiments carried out in Israel deserve special attention beyond that given by S01 because of their importance for a number of years in convincing the scientific community, even the most skeptical scientists, that randomized cloud seeding experiments had finally produced a measurable result (e.g., Mason 1980, 1982; Kerr 1982; Silverman 1986; Dennis 1989; Young 1993; Cotton and Pielke 1995). Indeed, many have believed that they were the onlyexperiments in cloud seeding that had demonstrated a seeding success among all those that have been conducted. In this context, S01 must be admired for his ability to move from one who has previously validated the results of the experiments in Israel to one who now believes as the author does that they did not prove cloud seeding effectiveness after all. However, some descriptions by S01 of the Rangno and Hobbs (1995, hereafter RH95) reexamination of these experiments are incomplete and require further discussion.
First, why did the experiments in Israel have such great credibility as successes to such a wide audience? This was because they seemed to have had, for a time anyway, all of the requisites for unambiguous scientific credibility: a sound design that included randomization, a choice of evenly spaced rain gauges (at least in the first experiment) that was limited to all of the gauges in a pre-existing recording rain gauge network, an apparent confirmation of a statistically significant result in a follow-up confirmatory experiment, and a sound cloud microstructural basis for believing that the statistical successes reported were achievable because the clouds were so deficient in ice.
For example, the experimenters reported over a period of many years that the clouds in Israel achieved rather great depths and low cloud top temperatures (to –21°C) while producing little ice or precipitation (i.e., Gagin and Neumann 1974, 1976, 1981; Gagin 1975, 1980, 1981, 1986, hereafter GN74, GN76, GN81 and G75, G80, G81, and G86, respectively). This left a wide window (–12° to –21° C) for seeding to initiate ice and precipitation in those clouds. The higher temperature mentioned above demarcated the highest temperature at which appreciable concentrations of the silver iodide seeding crystals would have begun to nucleate and the lower temperature where it was reported that the natural ice concentrations were high enough that seeding was not required to boost ice content.
With cloud bases regularly at 800 m or so above sea level at 5-9°C (GN74, G75), this meant, according to these reports, that there was a large population of non-precipitating or barely precipitating clouds moving into Israel from the Mediterranean Sea that were as much as several kilometers deep. Furthermore, in support of this picture, the effects of seeding, according to the experimenters, had been in duration of rainfall, not in intensity (G86), a fact compatible with the kind of seeding done. From these many reports, it all made sense to outside scientists.
It will surprise and trouble many readers who do not follow the cloud seeding literature closely that the reporting of the results of the experiments by those who conducted them was not apropos according to normal scientific expectations. This unfortunate element of these experiments, which necessarily impacts the reliability of the body of literature about them, is discussed in Section e.
- Seeding logistics and heterogeneities in the two experiments in Israel
Perhaps because the patrol method of seeding described in Section 4 had just been adopted by the United States in its major test of seeding in Project Whitetop, the experimenters in Israel, about to embark on their own major seeding trial at about the same time (in the late winter of 1960-1961), also chose this method. In fact, patrol seeding was used almost exclusively in the six years of the first experiment (National Academy of Sciences 1973, GN74).[2]
However, the experimenters in Israel used a seeding track that was 65-75 km long, or about 15-25 km longer than the one used in Project Whitetop (Gabriel 1967). Moreover, they had but a single twin-engine aircraft available to them to seed a longer experimental period over which rainfall was to be evaluated for seeding effects, a 24 h day vs. Project Whitetop’s 14 h experimental period. Most remarkably, seeding by this method was carried out for an average of only about 4 h of the 24 h experimental day and yet still seemed to have produced statistically significant results (Gabriel 1967; Wurtele 1971; GN74). The precipitation climatology of Israel, that makes this an astonishing fact, was discussed by RH95.
Not surprisingly, the experimenters themselves came to realize the inadequacy of coverage of the 4 h per day of patrol seeding by a single aircraft in the first experiment. When their second experiment began in the fall of 1969, they had added no less than 42 ground generators and a second aircraft with aircrews to man them 24 h a day (National Academy of Sciences 1973).
These new and greatly extended sources of seeding in the second experiment constituted an enormous heterogeneity in seeding coverage in the amount of seeding material released, and a shift in the methodology between the two experiments from solely airborne seeding to mainly ground seeding supplemented by airborne seeding. Yet, implausibly, according to the partial statistical reports of the experimenters, the enormous increase in seeding and the shift in methodology produced virtually the same seeding result as in the first experiment, a 13% increase in rainfall in the North target (e.g., GN81) compared with the 15% overall increase in both targets of the first experiment when only seeding 4 h per day took place.
- The cloud microstructure of Israel does not make a case for seeding having produced statistically significant results in the experiments
A second factor that makes it implausible that the 4 h of seeding produced the statistical results reported in the first experiment, or effects in the second is that the clouds of the eastern Mediterranean are, in fact, largely unsuitable for seeding due to high concentrations of ice and the onset of ice at slightly supercooled cloud top temperatures (e.g., Rangno 1988; Rangno and Hobbs 1988, 1995, 1997a,b; Levin et al. 1996).
However, S01 stated that a “fraction” of the clouds of Israel do not correspond to those required for seeding to be effective. S01, by using the phrase “a fraction of” the clouds may have been “unsuitable” for seeding, presumably means that some of the clouds making landfall on the Israeli coastline where they were to be seeded already contained high natural ice crystal concentrations and thus had no seeding potential, or had tops that were too warm for seeding to be effective, or were stratiform in nature with no updrafts below them to draw the seeding material upward as was noted in RH95.
However, the word “fraction”, as used by S01, is ambiguous and may inadvertently mislead Bulletin readers by suggesting that it means “a small amount of.”
In fact, it would be a rare day in which high ice concentrations are not observed in mature and aging cumuliform clouds with tops >–14°C. Levin et al. (1996) gathered ice concentrations in clouds with tops warmer than about –14°C on several rather ordinary shower days in Israel and found tens to hundreds per liter in those clouds. The author directs the reader to papers that discuss the cloud microstructure of Israel (Rangno 1988, 2000; Rangno and Hobbs 1988, 1995, 1997a,b).
2. The stratifications of seeding effects by the cloud top temperatures in the second experiment are unreliable
S01 repeats the cloud top temperature stratifications that were reported on numerous occasions by the experimenters as having strongly partitioned seeding effects in the second experiment. The experimenters reported, for example, that the maximum seeding effect in the second experiment was a 46% increase in rainfall compared with control days when the cloud top temperature was in the range of –15° to –21°C (e.g., GN81).
However, the cloud top temperature stratifications by the experimenters are unreliable for several reasons and should not be quoted (RH95). Also, in view of the tens to hundreds per liter ice particle concentrations found in the clouds of Israel with tops warmer than about –14°C on rather ordinary showery day situations (Levin et al. 1996), combined with the discovery that rain routinely falls from clouds with tops warmer than –10°C (Rangno 1988), it is no longer scientifically credible that the strongest seeding effect was produced in clouds that had top temperatures between –15° and –21°C where excessive natural ice crystal concentrations already exist.
3. Discussion of statistical issues: Israel-1
S01 stated that RH95 concluded that the results of the first experiment were due to a false positive or Type I statistical error based solely on evidence reported by Wurtele (1971). RH95 performed a “cradle to grave” analysis of the first experiment and several significant factors, besides the fact that the greatest apparent seeding effect was in a region that was avoided by the seeding aircraft, led us to our conclusion. We direct the reader to our paper and subsequent discussions of this issue (Rangno and Hobbs 1995, 1997a, 1997b; Rosenfeld 1997).
On the other hand, S01 himself offers no explanation in his evaluation of the first experiment about why the statistical significance was highest in the little-seeded Buffer Zone (BZ) that lay between the two targets. In ignoring this fact S01 does not heed the same large “red flag” that should have raised skepticism about the statistically significant results in the first experiment more than thirty years ago.
No less than the chief meteorologist for the first experiment[3] stated, with notable candor in Wurtele (1971), that the BZ could only have been seeded 5-10% of the time, a conclusion sustained in RH95. Moreover, GN74, themselves puzzling over this same statistical anomaly in the BZ, concluded that relying on a seeding argument for the BZ anomaly was weak (though they did it anyway) since the statistical significance in the BZ also accrued on seeded days in which the lone seeding aircraft did not even fly!
It would be interesting to learn what knowledge S01 has developed to refute these assessments by the experimenters themselves.
b. Israel 2
Two Type I statistical errors in a row (lucky draws) is a slim possibility as some have noted concerning RH95. However, two false positives in a row did not occur in the Israeli experiments when the same crossover scheme was used to evaluate both of them as was called for in the a priori design (Gabriel and Rosenfeld 1990, Silverman 2001).
Second, when using the South target gauges as the control for the North target area, as was also specified in the a priori design (e.g., GN74), a null result for the second experiment was produced again (Gabriel and Rosenfeld 1990; RH95).
However, in a third design component of the second experiment, a statistically significant result was evinced when a few rain gauges in a coastal plain upwind of the North target area were used to assess seeding effects in the target (GN81). The statistical significance so obtained in the third of the three design evaluation components comprises the second statistically significant result in a row that S01 refers to. Are you following me, reader?
At first glance, perhaps the achievement of any statistical significance in even one of the three design components is an impressive result even if it is outweighed by two null results (both of which went unreported at the time).
However, in a wider analysis than that performed by the experimenters, or by Gabriel and Rosenfeld (1990), RH95 found comparable or even heavier rain that fell on the seeded days in the North target area also fell over a wide region in and outside of northern Israel; namely, in central and southern Lebanon, western Jordan, and in Israel south of the North target area including Jerusalem itself! Ironically, the experimenters had their offices in Jerusalem and were somehow oblivious to the heavy rain they were receiving when they seeded the North target area some 100 km to the north.
The single exception to this regional pattern of markedly heavier rain on North target area seeded days was in the coastal plain upwind of the North target area that had been pre-selected as a control zone.
The widespread regional pattern of bias in rainfall discovered by RH95 on North target seeded days suggests to meteorologists that the random draw was flawed or compromised by a bias in the weather systems that favored heavier rain over a synoptic scale region on North target area seeded days.
The second point that weakens the statistical significance obtained in the North target area is that those conducting the experiment did not specify the rain gauges for the evaluation prior to the experiment contrary to good scientific design (e.g., Court 1960). Not naming gauges, or not using all of the established gauges in post analysis allows for “cherry-picking” of those gauges to find whatever result one wanted to find[4].
c. The delayed reporting of statistical results and other actions by the experimenters constituted scientific misconduct and therefore the body of work by those researchers is inherently compromised
S01 should be applauded for his valiant attempt in his review to ferret out the misleading reports of statistical significance. However, there is a far more important test of the reliability of published results that S01 did not consider: if demonstrable scientific misconduct occurs in the reporting of results, then no publication by the wayward author(s) before or after this time can be considered reliable and they should not be quoted.
But what is “scientific misconduct”?
“Drug Maker Admits That It Concealed Tests Which Showed Flaws.”
“The Warner-Lambert Company, one of the nation’s largest drug companies, pleaded guilty yesterday to criminal charges and agreed to pay a $10 million fine for hiding from the Food and Drug Administration faulty manufacturing processes used for several drugs….”
–New York Times, p1, 29 November 1995
Most readers can recognize egregious scientific misconduct such as concealing data that impact and change the conclusions of an experiment in which only favorable and therefore, deceptive results are published, as described in the newspaper story above.
Misconduct also occurs when researchers conceal for many years the results of new experiments that contradict those of their previously published “successful” experiments on which the scientific community and public have depended upon.
Misconduct can also be understood to have occurred when a researcher denies access to his “lab” to bonafide workers in his field who have come to study and validate his unique long-published results, results that only his lab in all the world have produced with the “equipment” he has used.
We can all recognize these acts as contrary to the values of science and its pursuit of truth. An action such as the latter is particularly odious when the researcher’s much ballyhooed results are later shown to be wholly fictitious.
Very regrettably, all three acts of misconduct occurred in the cloud seeding experiments in Israel. It is a matter of record that the experimenters chose to conceal the negative statistical results that accrued in the randomly seeded South target area of Israel-2 from the time that experiment ended in the spring of 1975 until 1990. These omitted statistical results, when incorporated into the mandated crossover evaluation of that experiment, resulted in a null (-2%) seeding effect (Gabriel and Rosenfeld 1990).[5] Thus, the complete second experiment had not replicated the results of Israel-1 as Silverman (2001) also concludes but had been widely believed based on the experimenters’ partial reports limited to the North target area (e.g., Tukey et al. 1978, Kerr 1982; Silverman 1986).
The experimenters also chose to conceal from their colleagues the ongoing results of a third randomized cloud seeding experiment, Israel-3, that was taking place in central and southern Israel. This experiment began in the fall of 1975 and ended in 1994. The random seeding in this experiment suggested year after year that seeding was having no effect or possibly decreasing the rainfall in the target (e.g., Rosenfeld and Farbstein 1992; Rosenfeld 1998). The first interim results of the third randomized experiment were not mentioned until 1992, 17 years after it had begun. This reporting behavior is in contrast to the positive reports that were issued in journals part way through the first and second experiments by Gabriel 1967 and GN74 when the effects of seeding were indicated to be positive.
In summary, during 24 consecutive years of randomized seeding in the south target in Israel-2 and -3 combined, had less rainfall (about 10%) on seeded days than on the control days. This contrary knowledge was hidden from the scientific community for more than 15 years. The original authors of the partial reports passed away before these concealed results were, or could be, reported in journals for the outside community to evaluate.
No one can doubt that the crucial negative statistical results of seeding described above in Israel-2 and -3, would have raised many questions, and should have been made known om a timely manner, first of all, to the experimenters’ own countrymen, to the outside scientific community as a whole, and especially to the scientific community in Jordan downwind of central and southern Israel that might have been impacted by the remote possibility of having their rainfall decreased.
In a third example of misconduct, this writer, known to the leader of the Israeli experiments as a skeptic[6] of the cloud microstructure reports that he had been publishing in journals, was denied access to the experimenters’ two radars during rainy spells to examine the heights (and temperatures) of precipitating clouds during his 11-week visit to Israel in early 1986. One of the radars, a vertically pointing X-band or 3-cm wavelength radar, was located near the offices of the experimenters at a satellite office of the Hebrew University of Jerusalem. The second, a C-band or 5.5-cm wavelength radar, was located on the grounds of Ben Gurion Airport to which this writer bicycled to from Tel Aviv for a meeting with the leader of these experiments who forbade him to go there during storms due to “airport security.”
From the rawinsonde data analyzed by me in 1988, and from the airborne data of Levin et al. 1996 we now know why the experimenters did this.
It doesn’t seem possible to conjure up the magnitude of incompetence required on the part of the experimenters to misinterpret so many cloud measurements over so many years from the many measurement sources they had at their disposal: their own radars, satellite thermal imagery which they used routinely for forecasting cloud seeding opportunities and in their research reports (e.g., Rosenfeld 1980; G80), their own aircraft that for two rainy seasons skimmed the tops of clouds over their vertically pointing radar at Jerusalem (e.g., G80). And, of course, they also had the Israel Meteorological Service (IMS) rawinsonde profiles launched up to four times a day from Bet Dagan (near Tel Aviv )from which it could be discerned that the clouds were not as they were describing them.
In view of these documentable instances of misconduct by the experimenters, none of the publications regarding cloud seeding, or its potential in Israel or elsewhere by those who participated in these acts, can be considered reliable. Such publications should not be quoted until the full story concerning the actions of the experimenters is revealed. Of particular interest is the original list of random decisions for Israel-2 due to the extreme one-sided nature of that draw on seeded days (Gabriel and Rosenfeld 1990). We need to be sure that the list wasn’t compromised when heavy rain was forecast by the Israel Meteorological Service. From experience in commercial projects, I know that it’s satisfying to say when someone asks that you seeded when heavy rain falls.
- But why discuss misconduct in science? Won’t a discussion of, or a finding of “misconduct” diminish public support of science? And won’t that, in turn, lessen the job opportunities that we workers in science might have?
In fact, from our own narrow purview, it could be (and will be by some) argued that we should never discuss or even mention misconduct in any area of science. Rather, we should promote the thought that as scientists, we are not like other people, but, in fact, are superior to them and never do anything wrong or fraudulent because of our training like other people. Sarcasm here.
Of course, we must not only discuss but eradicate misconduct from our ranks or others will. And, yes, it is likely that there will be some erosion of public support for cloud seeding in the face of reports of misconduct in that field. Someone may indeed lose his job.
But from a larger viewpoint, it is an outrage to not consider the question of whether scientific misconduct occurred that resulted in misspent tens of millions of public dollars.
Most worrisome, there are no guarantees that this will not happen again. We do not know, for example, if more data relative to cloud seeding or cloud microstructure are being concealed or consciously misanalyzed by this same group in ongoing efforts to justify what now appears to be a dubious operational cloud seeding program begun by the Israeli government in 1975 that was based on the experimenters’ partial statistical reports of seeding success and descriptions of fictitious clouds.
Update: Due to the re-analysis of the Israeli experiments in 1995, and the subsequent journal exchanges in 1997, a panel was formed by the Israeli government to independently examine the results operational cloud seeding of the Sea of Galilee (Lake Kinneret) that began with the winter of 1975-76. The panel found no viable evidence that cloud seeding had increased runoff into the Sea of Galilee over a 27 year period (Kessler et al. 2006, Sharon et al. 2008). Israel-4 ended with a null result after seven seasons of randomized seeding (Benjamini et al. 2023).
A reputational dark cloud will hang over the group from which these acts originated until the details are fully known and the data in these papers verified. An independent panel of inquiry into these matters, while time consuming, can only benefit all parties by lifting this dark cloud so that we can move ahead.
On the other hand, the field of cloud seeding is unique in the atmospheric sciences. Its past charlatans, quacks, and even misguided, self-deceived but sincere scientists who made ludicrous claims about seeding effects, have been well documented throughout its history (e.g., Fleming 2010). In the early days of modern cloud seeding we had the USWB with their aircraft and their independent scientists (e.g., Coons and Gunn 1951) to invalidate some of the outrageous claims being made.
Today, it seems, we have only the peer-review process to ensure that the truth is told. And, from the many reversals of published findings of major, even widely accepted experiment results, some once seen as having “proved” cloud seeding as evaluated by our best scientists (e.g., National Academy of Sciences 1973), we can conclude that peer-review is but a thin “firewall” indeed against this type of more subtle quackery.
Workers in weather modification today, like S01, with their own continuing silence on the matter of the omitted, crucial statistical results of the experiments conducted in Israel, are exhibiting an eerie tolerance for a pernicious kind of science reporting in journals on cloud seeding that, from this author’s viewpoint, threatens to destroy this field altogether.
REFERENCES
Benjamini, Y, A., Givati, P., Khain, Y. Levi, D. Rosenfeld, U. Shamir, A. Siegel, A. Zipori, B. Ziv, and D. M. Steinberg, 2023: The Israel 4 Cloud Seeding Experiment: Primary Results. J. Appl. Meteor. Climate, 62, 317-327. https://doi.org/10.1175/JAMC-D-22-0077.1
Bouqard, A. D., 1963: Ice nucleus concentrations at the ground. J. Atmos. Sci., 20, 386-391.
Braham, R. R., Jr., 1964: What is the role of ice in summer rain-showers? J. Atmos. Sci., 21, 640-646.
_______________., 1979: Field experimentation in weather modification. J. Amer. Stat.
Assoc., 74, 57-68.
Coons, R. D., E. L. Jones, and R. Gunn, 1949: Artificial production of precipitation. Third Partial Report: Orographic Stratiform Clouds–California, 1949. Fourth Partial Report: Cumuliform Clouds–Gulf States, 1949. U. S. Weather Bureau Res. Paper No. 33, Government Printing Office, Washington, 46 pp.
_________, and R. Gunn, 1951: Relation of artificial cloud modification to the production of precipitation. Compendium of Meteorology. Amer. Meteor. Soc., 235-241.
Cotton, W. R., and R. A. Pielke, 1995: Human Impacts on Weather and Climate, 2nd edition, Cambridge University Press, 288 pp.
Court, A., 1960: Evaluation of cloud seeding trials. J. Irrig. and Drainage Div., Proc. Am. Soc. Civ. Eng., 86, No. IR 1, 121-126.
Dennis, A. S., 1989: Editorial to the A. Gagin memorial issue. J. Appl. Meteor., 28, 1013.
Fleming, J. R., 2010: Fixing the Sky: The Checkered History of Weather and Climate Control. Columbia University Press, 306pp.
Gabriel, K. R., 1967: The Israeli artificial rainfall stimulation experiment: statistical evaluation for the period 1961–1965. Proceedings, Fifth Berkeley Symposium on Mathematical Statistics and Probability, Vol. 5, L. M. LeCam and J. Neyman, eds., University of California Press, 91–113.
_______, and D. Rosenfeld, 1990: The second Israeli rainfall stimulation experiment: analysis of rainfall on both target areas. J. Appl. Meteor., 29, 1055–1067.
Gagin, A., 1975: The ice phase in winter continental cumulus clouds. J. Atmos. Sci., 32, 1604–1614.
________, 1980: The relationship between the depth of cumuliform clouds and their raindrop characteristics. J. Res. Atmos., 14, 409-422.
_______, 1981: The Israeli rainfall enhancement experiments. A physical overview. J. Wea. Modif., 13, 1–13.
________., 1986: Evaluation of “static” and “dynamic” seeding concepts through analyses of Israeli II and FACE-2 experiments. In Precipitation Enhancement–A Scientific Challenge, Meteor. Monog., 21, No. 43, Amer. Meteor. Soc., 63-70.
_______, and J. Neumann, 1974: Rain stimulation and cloud physics in Israel. Weather and Climate Modification, W. N. Hess, Ed., John Wiley and Sons, 454–494.
________., and J. Neumann, 1976: The second Israeli cloud seeding experiment–the effect of seeding on varying cloud populations. Proc. II WMO Sci. Conf. Weather Modification, Boulder, WMO Geneva, 195-204.
_______, and _________, 1981: The second Israeli randomized cloud seeding experiment: evaluation of results. J. Appl. Meteor., 20, 1301–1311.
Hallett, J., and S. C. Mossop, 1974: Production of secondary ice particles during the riming process. Nature, 249, 26-28.
Hobbs, P. V., 1969: Ice multiplication in clouds. J. Atmos. Sci., 26, 315-318.
__________., and A. J. Alkezweeny, 1968: The fragmentation of freezing water droplets in free fall. J. Atmos. Sci., 25, 881-888.
Kerr, R. A., 1982: Cloud seeding: one success in 35 years. Science, 217, 519–522.
Kessler, A., A. Cohen, D. Sharon, 2006: Analysis of the cloud seeding in northern Israel. A report submitted to the Israel Hydrology Institute and the Israel Water Management of the Ministry of Infrastructure, In Hebrew with an English abstract). 117pp. No doi.
Koenig, L. R., 1963: The glaciating behavior of small cumulonimbus clouds. J. Atmos. Sci., 20, 29-47.
Kraus, E. B., and P. A. Squires, 1947: Experiments on the stimulation of clouds to produce rain. Nature, 159, 489-492.
Lawson, R. P., and T. L. Jensen, 1998: Improved microphysical measurements in mixed phase clouds. Preprints, Conf. Cloud Phys., Everett, WA, Amer. Meteor. Soc. 451-454.
Levin, Z., E. Ganor, and V. Gladstein, 1996: The effects of desert particles coated with sulfate on rain formation in the eastern Mediterranean. J. Appl. Meteor., 35, 1511-1523.
List, R., K. R. Gabriel, B. A. Silverman, Z. Levin, and T. Karacoastas, 1999: The rain enhancement experiment in Puglia, Italy: statistical evaluation. J. Appl. Meteor. 38, 281-289.
Lovasich, J. L., J. Neyman, E. L. Scott, and J. A. Smith, 1969: Wind directions aloft and effects of seeding on precipitation in the Whitetop experiment. Proceedings, National Acad. Sci., 64, 810-817.
Mason, B. J., 1980: A review of three long-term cloud-seeding experiments. Meteor. Mag., 109, 335-344.
___________, 1982: Personal reflections on 35 years of cloud seeding. Contemp. Phys., 23, 311-327.
Mossop, S. C., 1985: Secondary ice particle production during rime growth: the effect of drop size distribution and rimer velocity. Quart. J. Roy. Met. Soc., 111, 1113-1124.
National Academy of Sciences, 1973: Weather Modification: Progress and Problems. T. F. Malone, ed., 258 pp. (Available from the National Research Council, Washington, D. C.)
Rangno, A. L., 1988: Rain from clouds with tops warmer than –10°C. Quart J. Roy. Meteor. Soc., 114, 495-513.
___________, 2000: Comments on “A review of cloud seeding experiments to enhance precipitation and some new prospects.” Bull. Amer. Meteor. Soc., 81, 583-585.
____________, and P. V. Hobbs, 1988: Criteria for the development of significant concentrations of ice particles in cumulus clouds. Atmos. Res., 22, 1-13.
_____________, and __________, 1991: Ice particle concentrations and precipitation development in small polar maritime cumuliform clouds. Quart. J. Roy. Met. Soc., 117, 207-241.
___________, and __________, 1994: Ice particle concentrations and precipitation development in small continental cumuliform clouds. Quart. J. Roy. Meteor. Soc., 120, 573-601.
___________, and P. V. Hobbs, 1995: A new look at the Israeli cloud seeding experiments. J. Appl. Meteor., 34, 1169-1193.
___________, and _________, 1997a: Reply to Rosenfeld. J. Appl. Meteor., 36, 272-276.
___________, and _________, 1997b: Comprehensive Reply to Rosenfeld. Cloud and Aerosol Research Group, Department of Atmospheric Sciences, University of Washington, 25 pp.
Rosenfeld, D., 1980: Characteristics of rain cloud systems in Israel derived from radar and satellite images. M. S. Thesis, The Hebrew University of Jerusalem, Israel, 129 pp. (Available from the Department of Geosciences, Hebrew University of Jerusalem, Israel)
___________, 1997: Comment on “Reanalysis of the Israeli Cloud Seeding Experiments.” J. Appl. Meteor., 36, 260-271.
___________, 1998: The third Israeli randomized cloud seeding experiment in the south: evaluation of the results and review of all three experiments. Preprints, 14th Conf. on Planned and Inadvertent Wea. Modif., Everett, Amer. Meteor. Soc. 565-568.
___________., and H. Farbstein, 1992: Possible influence of desert dust on seedability of clouds in Israel. J. Appl. Meteor., 31, 722-731.
Sharon, D., A. Kessler, A. Cohen, and E. Doveh, 2008: The history and recent revision of Israel’s cloud seeding program. Isr. J. Earth Sci., 57, 65-69. https://DOI.org/10.1560/IJES.57.1.65.
Silverman, B. A., 1986: Static mode seeding of summer cumuli–a review. In Precipitation Enhancement–A Scientific Challenge, Meteor. Monog., 21, No. 43, 7-20.
_____________, 2001: A critical assessment of glaciogenic seeding of convective clouds for rainfall enhancement. Bull. Amer. Meteor. Soc., 82, 903-923.
Stith, J. L., J. E. Dye, A. Bansemer, A. J. Heymsfield, C. A. Grainger, W. A. Petersen, and R. Cifelli, 2002: Microphysical observations of tropical clouds. J. Appl. Meteor., 41, 97-117.
Turkey, J. W., D. R. Brillinger, and L. V. Jones, 1978b: Report of the Statistical Task Force to the Weather Modification Advisory Board, Vol. II. U. S. Government Printing Office, pE-3.
Young, K. C., 1993: Microphysical Processes in Clouds. Oxford University Press, 335-336.
Wurtele, Z. S., 1971: Analysis of the Israeli cloud seeding experiment by means of concomitant meteorological variables. J. Appl. Meteor., 10, 1185-1192.
Footnotes
[1] The University of California Statistical Laboratory under the direction of Jerzey Neyman.
[2] Four ground generators were located in hilly terrain in the extreme northeast portion of the country.
[3] The Chief Meteorologist for the seeding experiments in Israel was misidentified by Wurtele (1971) as a meteorologist with the Israel Meteorological Service.
[4] Rangno and Hobbs (1995) used a subset of rain gauges that whose data were routinely published in monthly or annual summaries by the Israel Meteorological Service and therefore, were “pre-selected” by the Israel Meteorological Service, an agency not affiliated with the seeding experiments.
5 Even then, these “full” statistical results for the second crossover seeding experiment were not published in a vacuum; but only after the leader of the experiments passed away in 1987, and after a letter-writing campaign to Israeli government offices by the former Chief Meteorologist of the experiments urging the experimenters to publish the full results.
[6] My July 1983 submitted article, asserting that rain was falling from clouds with tops much warmer than could be accounted for by the experimenters’ cloud descriptions was rejected by J. Climate Appl. Meteor. in 1983 (B. A. Silverman, co-chief Editor, private communication.) Moreover, the leader of the experiments in Israel had provided a lengthy and perhaps pivotal negative review of that paper (A. Gagin, 1984, private communication.)


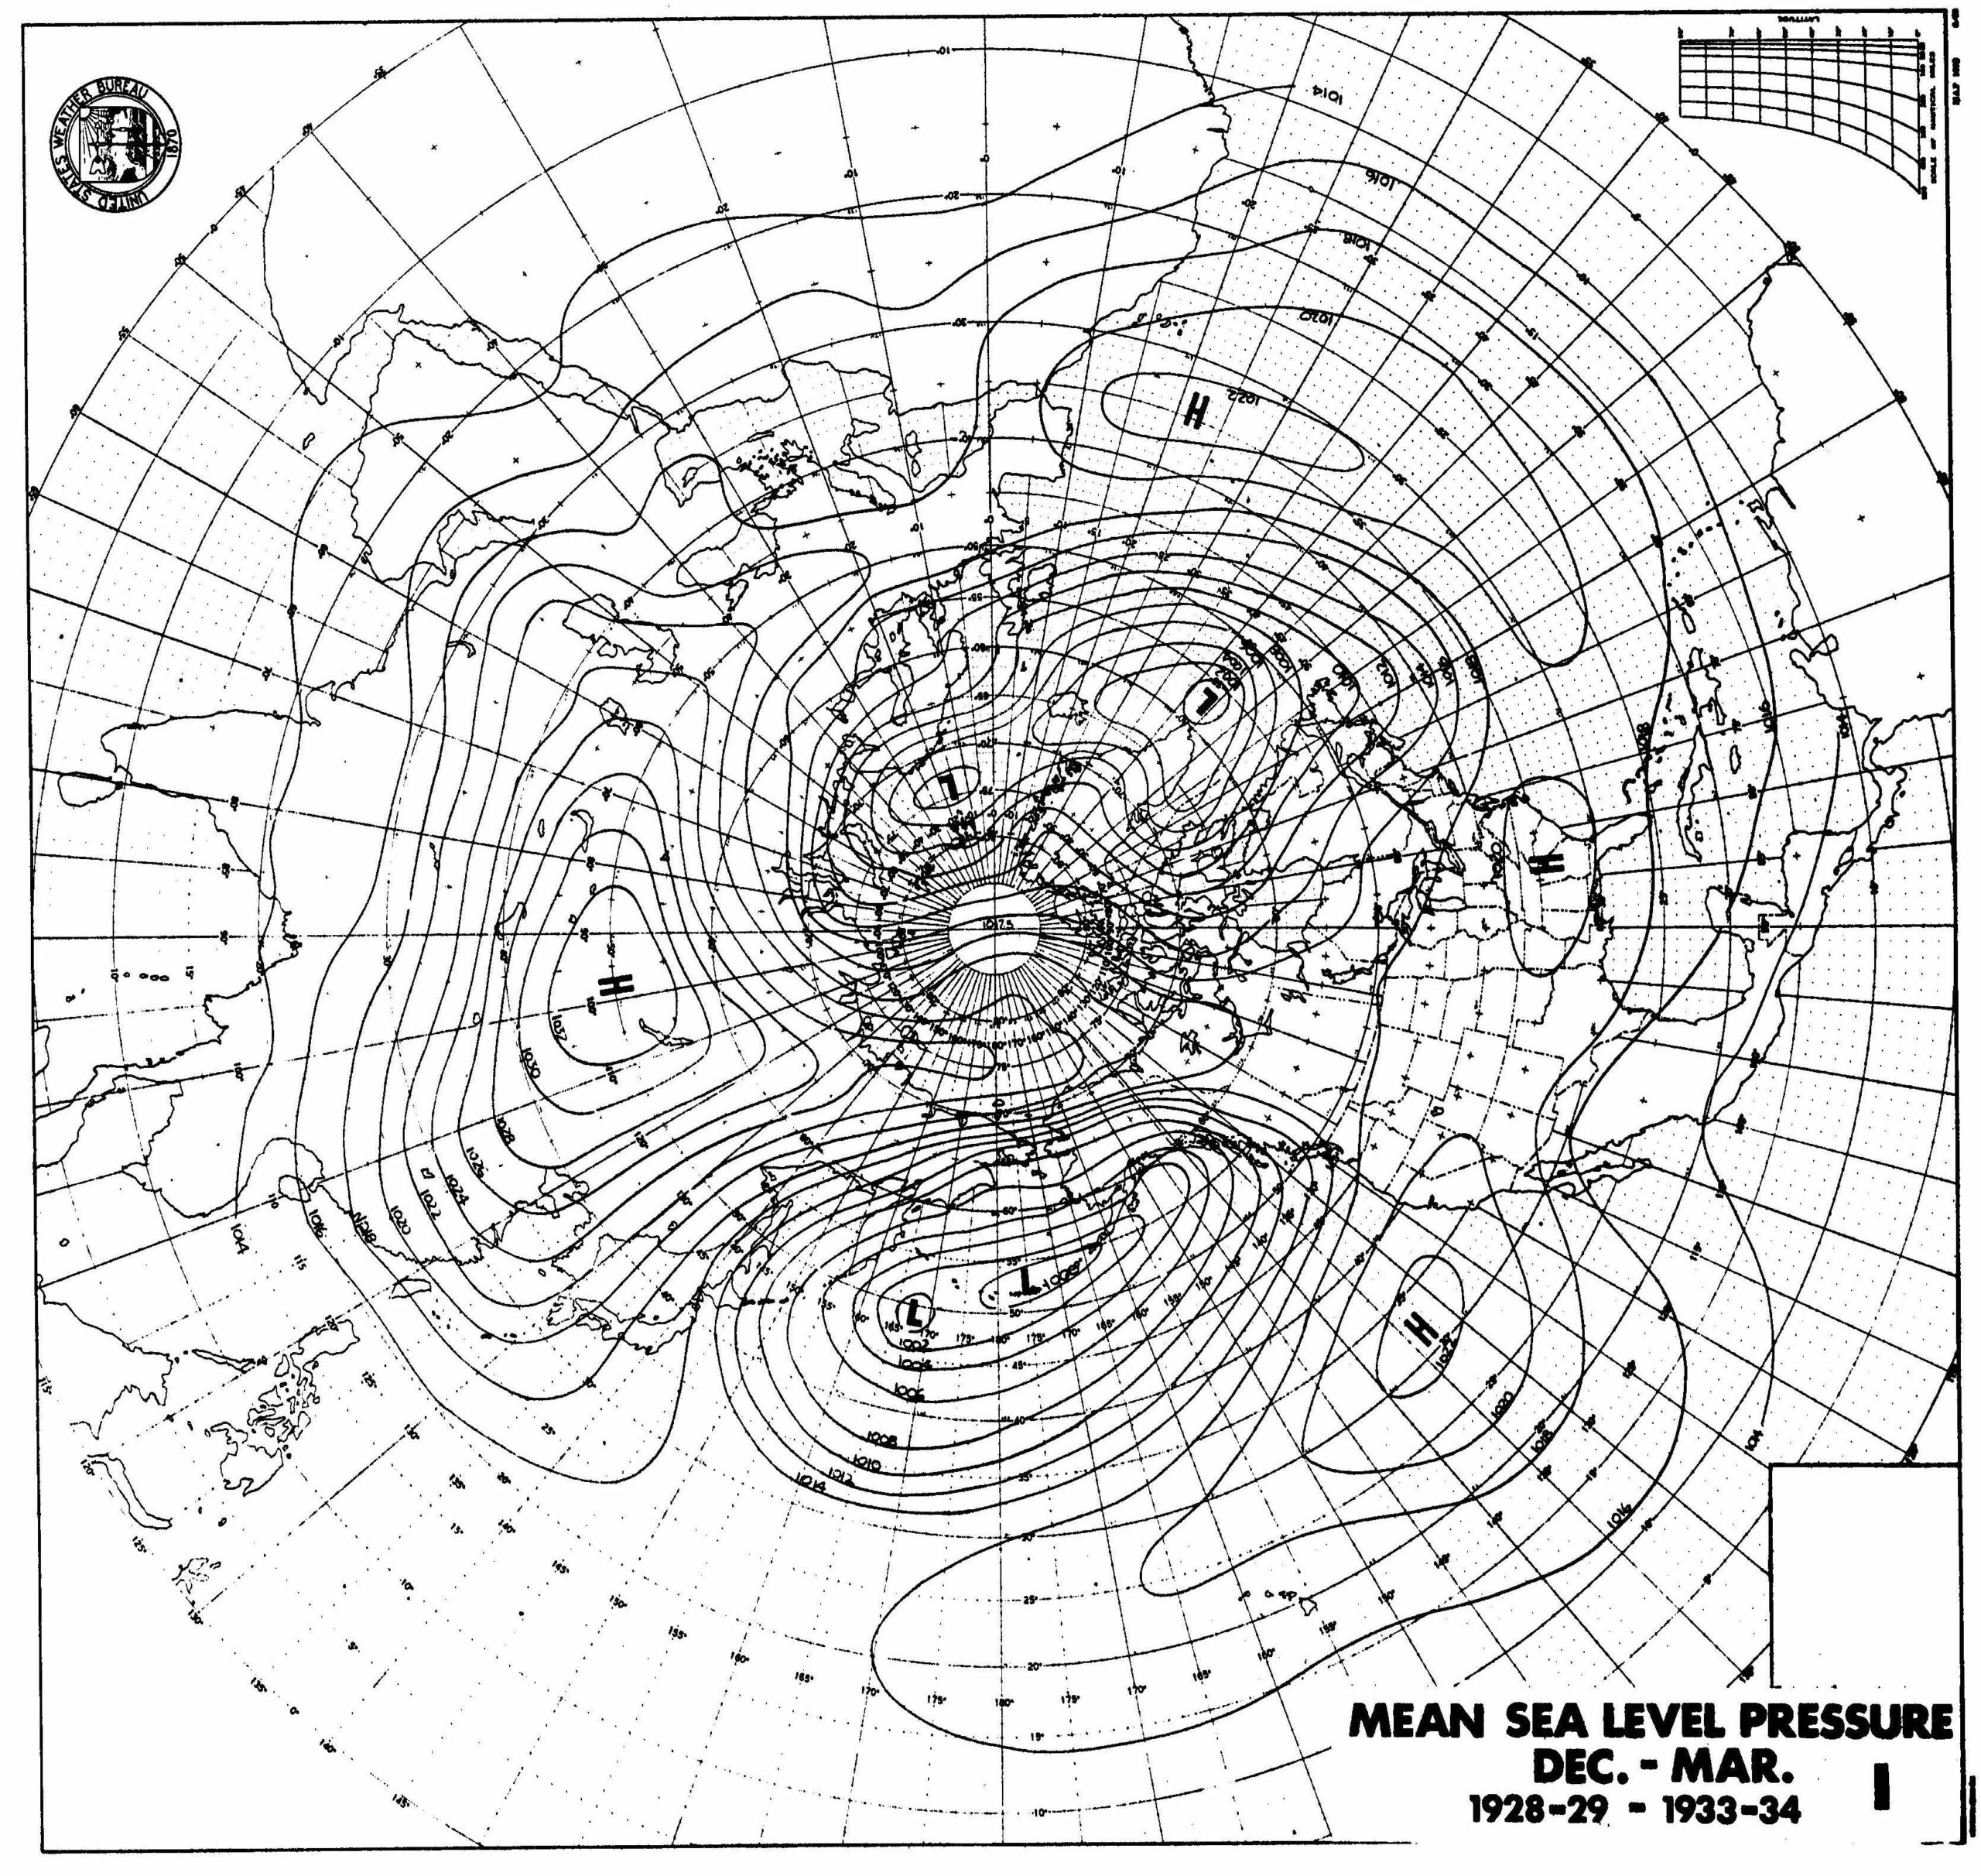
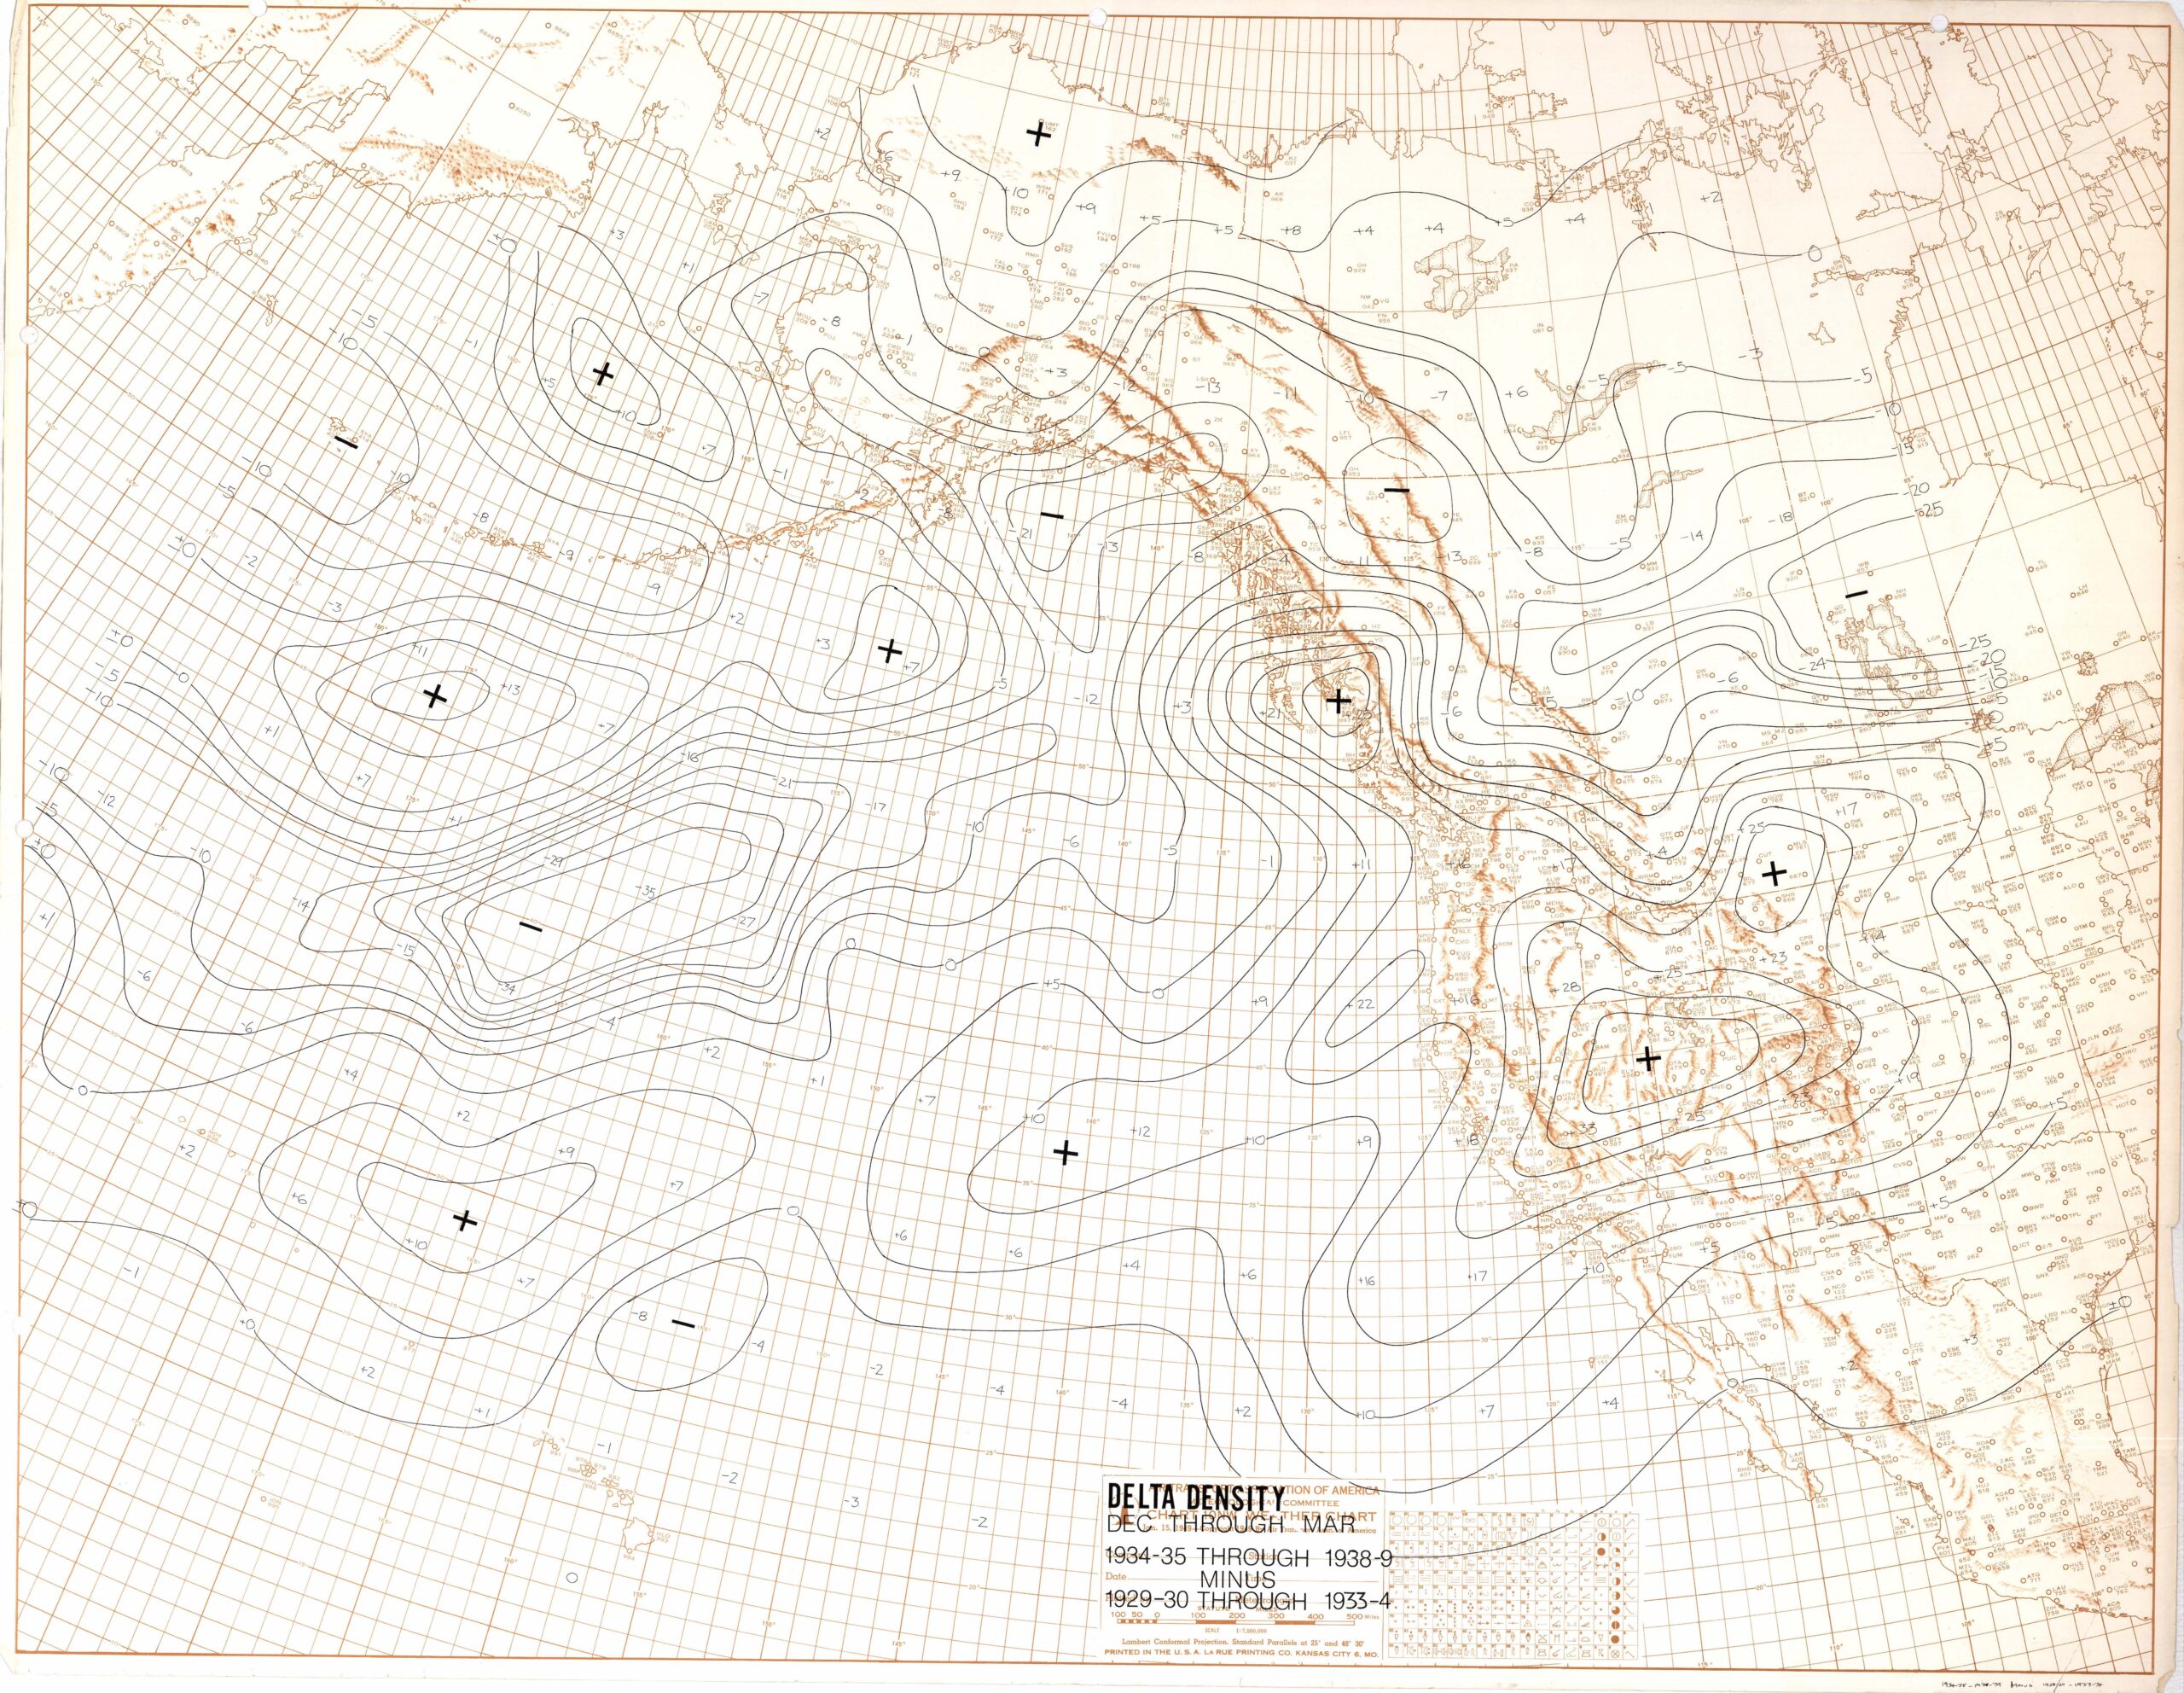 Many more low centers tracked across the extreme eastern Pacific into California and into the Great Basin low pressure cyclogenesis zone in the lee of the Sierras. This map is more illustrative than the sea-level pressure maps of those changes that happened after the shift to wetter conditions .
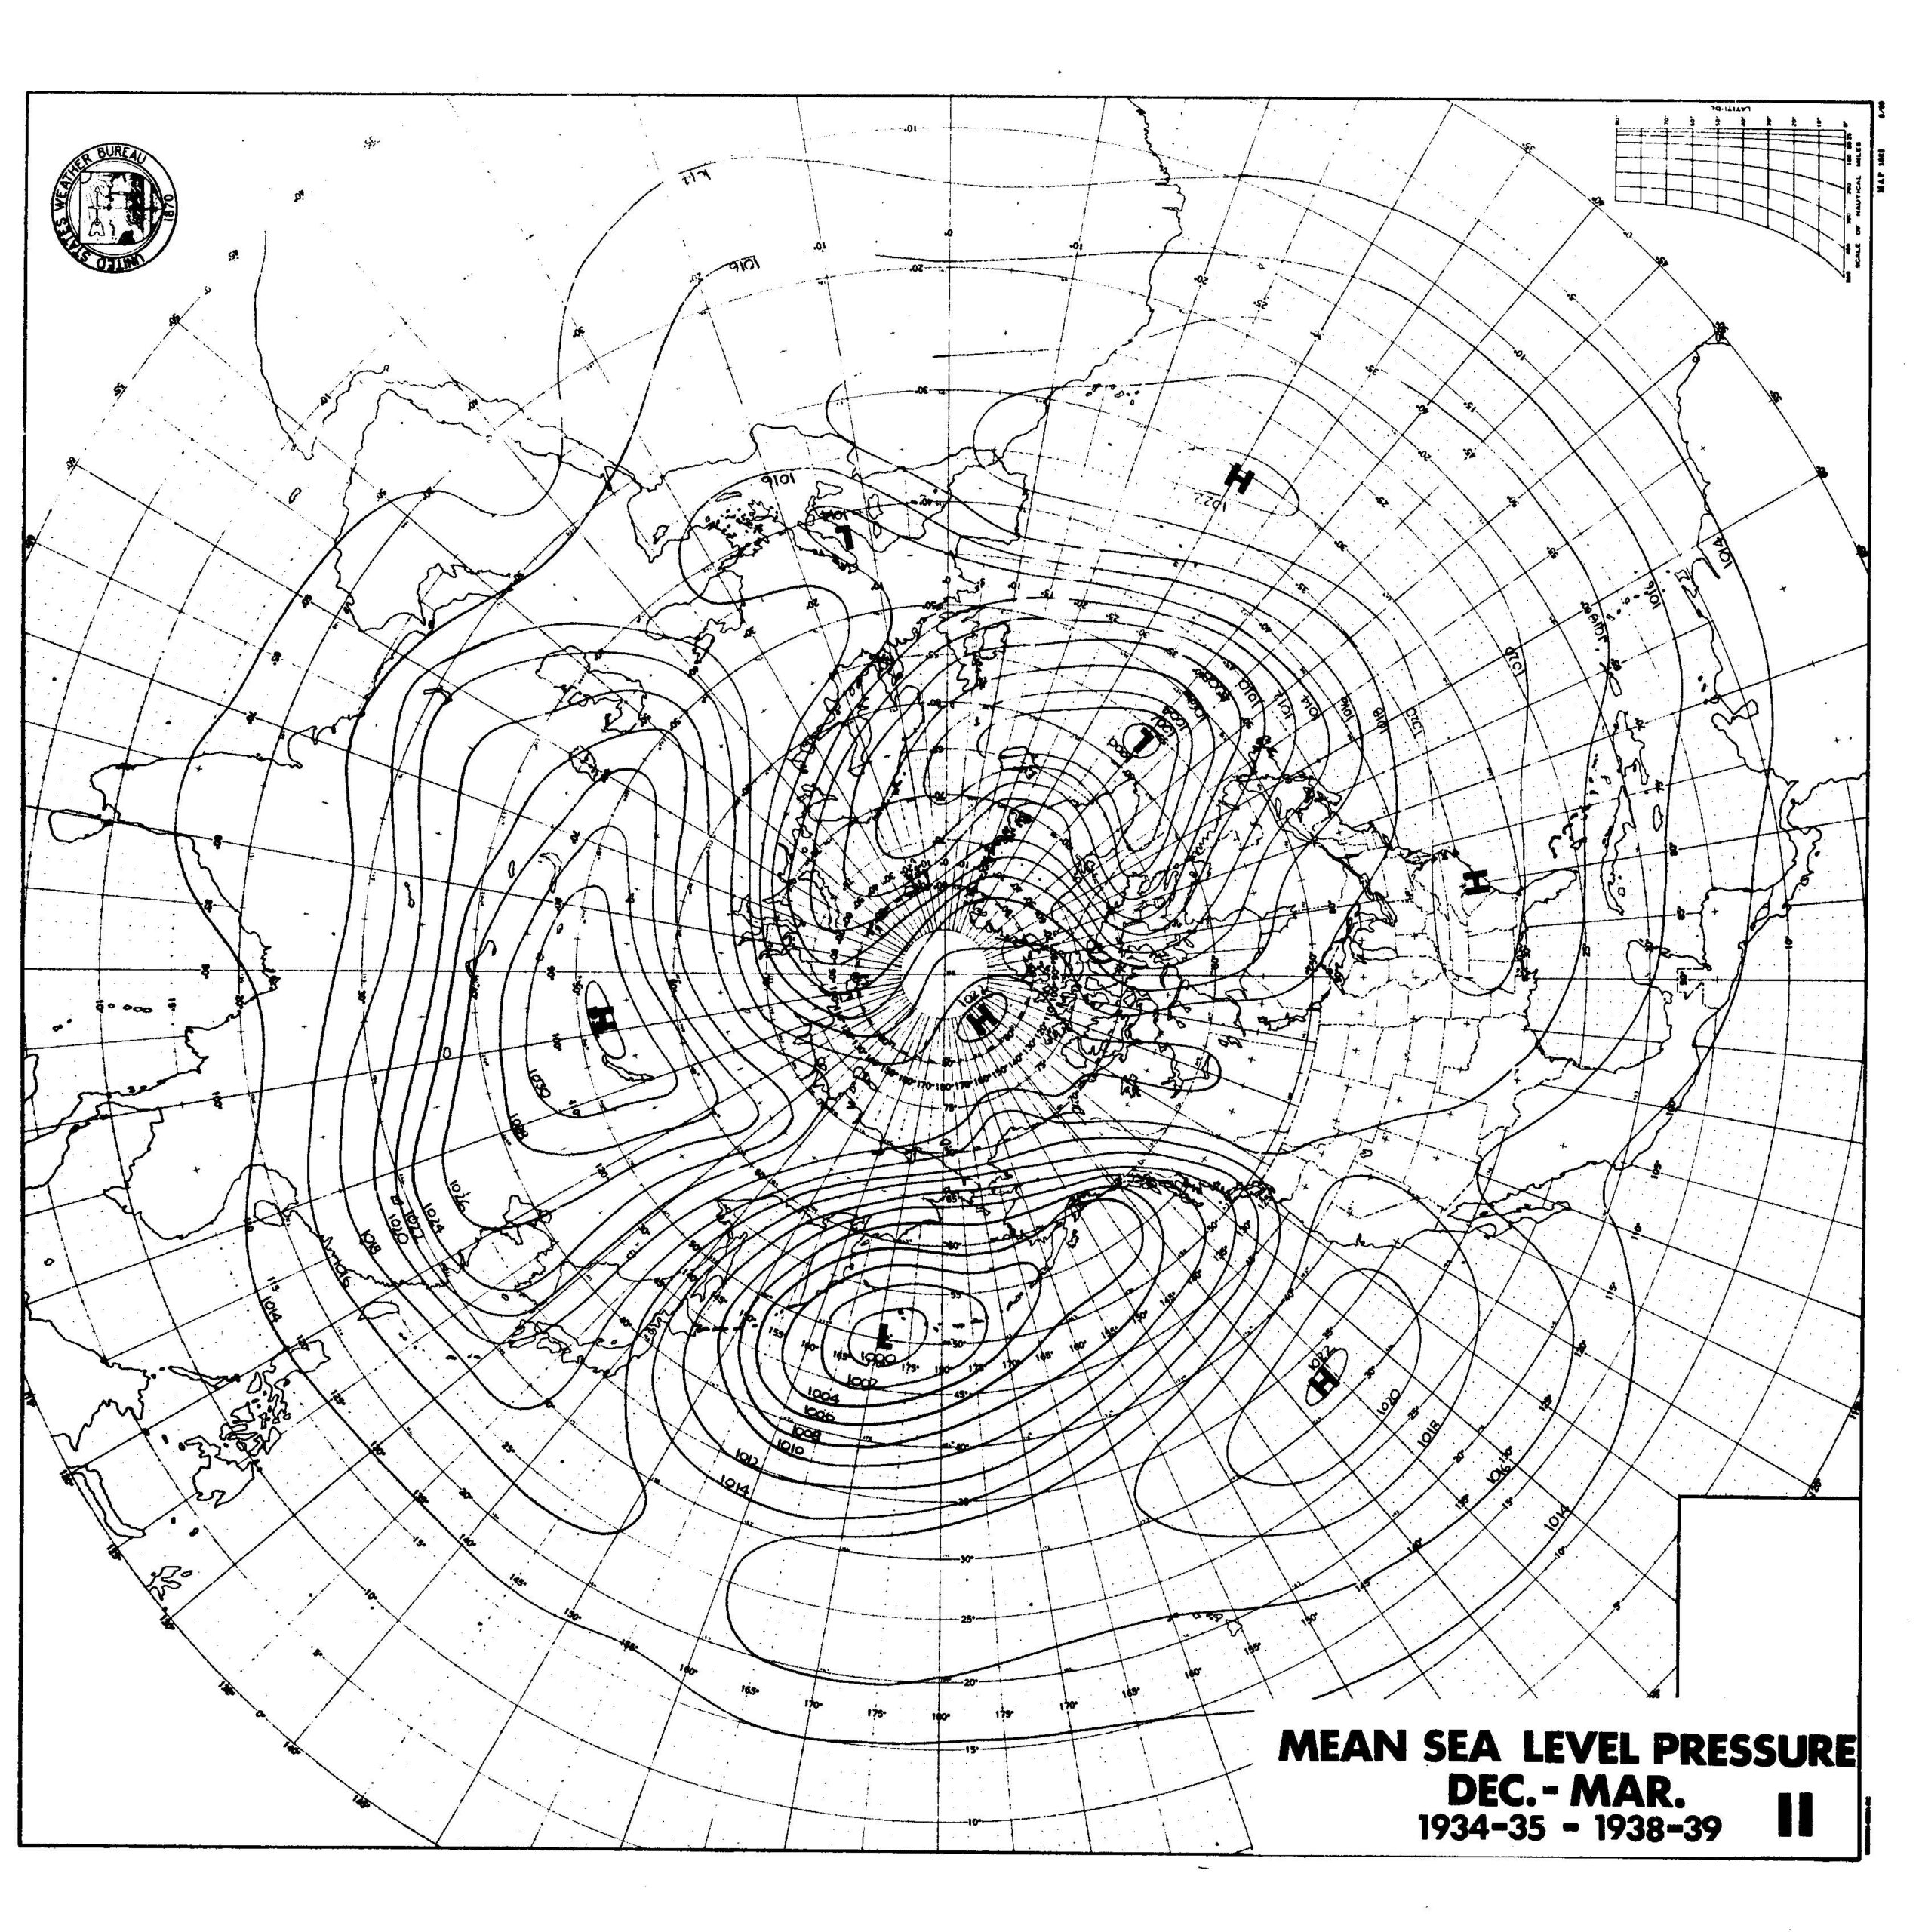