After pasting my incredibly LONG review of this article in this space, I realized it was too long for a blog, so will just put a link here where that strange person who would want to read it will find it. I’m following in the paths of F. A. Gifford and Fred Sanders, of whom it was said their reviews were sometimes LONGER than the manuscripts they were reviewing!
Review of Freud et al 2015 (monograph sized)
Below is my pathetic attempt to put my review into a viable/readable blog that I will be working on to “clean up”, add figures from the original and “other”. So look for changes as time goes by. I don’t expect the pdf to change. The figures are in the pdf above, btw.
A continuing theme of reviews like this is, as in other cases, I was not asked to review this manuscript in my expertise before publication, even though I was known by the authors as an expert on Israeli clouds, weather, and cloud seeding. Perhaps the editor of this journal, who chose the reviewers did not know??? Right now, its “Ready, Fire, Aim” to quote a book title describing the premature publication of this blog.
Oh, that Israel-4 cloud seeding experiment?! The result of the seven season randomized experiment was published by Benjamini et al. (2023, J. Appl. Meteor.). The “primary” evaluation found no viable increase in precipitation due to cloud seeding, in agreement with my 2017 review of this cloud seeding potential paper and all my prior work on Israeli clouds (Rangno 1988, Quart J. Roy. Meteor. Soc.) and cloud seeding (Rangno and Hobbs 1995, J. Appl. Meteor.)
Cloud seeding potential was grossly exaggerated by Freud et al. (2015). I wanted to scream to the Israel National Water Authority, “Don’t do a cloud seeding experiment based on these findings!” But, it was too late.
==================================================================================================
A comprehensive review of
“Cloud microphysical background for the Israeli-4 cloud seeding experiment”
by Freud, E., H. Koussevitsky, T. Goren and D. Rosenfeld,
(the article which is reviewed below was published in 2015 by Atmospheric Research)
with a recap of the Hebrew University of Jerusalem’s cloud seeding experiments
as seen by a long-time observer (me)
- A. L. Rangno[1]
Opening remarks
“What is scientific knowledge? When is it reliable?”, ask Kenneth Foster and Peter Huber (1997), in “Judging Science: Scientific Knowledge and the Federal Courts”, MIT Press. “Scientific knowledge” might be considered anything published in a peer-reviewed journal. Having passed the peer review “filter” gives, or should give, that which appears in a peer-reviewed journal particular reliability on which our scientific knowledge grows.
Much of this review addresses the second question raised by Foster and Huber, the reliability of published science. Implicitly, this review also addresses the quality of the peer-review “filter” in the cloud seeding domain: “Has it improved since the 1960s through 1980s when hundreds of pages of faulty cloud seeding claims concerning experiments in Colorado and Israel were published, ones that misled our best scientists?” In this review of a recently published paper, we must answer, “No.”
In this review[2], we examine the reporting of current and past research by researchers at one of the world’s great universities, the Hebrew University of Jerusalem (HUJ). The researchers at the HUJ in the article to be examined are reporting in a domain of science particularly susceptible to controversy, cloud seeding (e.g., Changnon and Lambright 1990); a field of study afflicted by a quasi-religious “confirmation biases”, and polarization that have corrupted it repeatedly.
Moreover, can the contents in articles published in peer-reviewed journals always be trusted in the polarized domain of cloud seeding with so much at stake for experimenters who report on their own work (jobs, prestige, confirmation of a priori beliefs, etc)? And, it is experimental work that is unlikely to have attempts at independent replication, our best safeguard against faulty claims, due to the high cost of field experiments. There may be no more vulnerable field to corruptive influences than cloud seeding due to these factors.
Conversely, pressure arises when you can’t find more rain on your cloud seeding experiment’s seeded days; you may be deemed a failure by others who KNOW that seeding worked. You may lose funding and your job since you found no response. This is because the value of a carefully conducted cloud seeding experiment with no viable proof of a seeding effect is undervalued. These factors converge to produce repeated false “happy” results in cloud seeding publications.
The idea of making it rain or snow on command, as it were, has corrupted many a good scientist since the earliest modern days of this field when Schaeffer dropped dry ice in a layer of Altocumulus clouds in 1946)[3]. The controversy largely results from reports of cloud seeding successes (precipitation increases) by the original experimenters whose findings are subsequently overturned by independent scientists “upon closer inspection” in re-analyses. This cycle of reverses has gone on since Brier and Enger (1952) right through the era of randomized experiments (e.g., Levin et al. 2010)! Randomization apparently did not remove experimenter bias. The Israeli experiments have been subject to this rise and fall cycle.
In Freud et al. (2015)—hereafter, F2015, this rise and fall cycle in the Israeli experiments conducted by the HUJ-CSG is not explained as candidly as it should have been for their Atmospheric Research ( AR) readers and funders, thus prompting this review. This review scrutinizes all aspects of the F2015 paper which apparently led to additional cloud seeding in Israel. Because F2015 was also part of a proposal to the Israel National Water Authority (INWA), it is also reviewed with more rigor for that reason. Proposals are written by “Party A” to extract monies from “Party B”; it’s a sales pitch. When this is done, one might find that Party A has painted a rosier scene for possible accomplishments (his “product”) than is viable for Party B. In droughty times, it’s always the cloud seeding salesman that wins. And it’s a win situation for funders who want to show constituents that they are doing something about a drought.
The review of F2015 is organized by topics. It also contains a “corrective history” of cloud seeding in Israel since Israeli 1. The history is based on the hope that it will be useful to potential future reviewers of manuscripts in cloud seeding that might emanate from the HUJ’s “cloud seeding group” (hereafter, “HUJ-CSG”; referring to those HUJ authors over the decades that have authored or co-authored papers on cloud seeding). This history may also be of interest to young graduate students within the HUJ science department who may not be informed about it.
Much of this critique of F2015 is due to the authors’ incomplete and misleading descriptions of prior cloud seeding results reported by the HUJ in the abstract and “Introduction” segments. The former chief editor of Science magazine says it all:
“The difficulty is that positive claims are sometimes made against a background of unrevealed negative results.”
—————– Donald Kennedy, 2004 Science editorial: “The Old File Drawer Problem.”
The word “independent” is highlighted in this review due to the remarkable number of times that outside, independent researchers, when examining the findings published by the HUJ-CSG in peer-reviewed journals, beginning with Rangno (1988-hereafter R88), could not substantiate or reversed them. This may give the HUJ-CSG the unenviable reputation as a frequent producer of published, but “unreliable, irreproducible” results. The primary reason is that the HUJ-CSG publishes ambiguous results but describes them as though they were “in concrete”, hiding the ambiguities in their findings that others bring out later. What should be troubling is that there are likely more ambiguities in HUJ-CSG publications hidden in what appear to be solid findings that have not yet been examined by independent researchers.
HUJ are you listening?
“One-sided citing” is often practiced by the HUJ-CSG, and is seen again in F2015. Those instances are called out in this review. “One-sided citing” has recently been condemned in the American Meteorological Society book, Eloquent Science, by David Schultz (2009). Here’s what Schultz had to say about one-sided citing:
“One-sided reviews of the literature that ignore alternative points of view, however, can be easily recognized by the audience, leading to a discrediting of your work as being biased and potentially offending the neglected authors (who might also be your reviewers!).” (Yep, me!)
Moreover, there is material damage to your fellow scientists when they are not cited when they should be, as by the HUJ-CSG in this and other cloud seeding articles. The impact in one’s field; promotions, awards, impact and status, is usually determined by an impact metric, such as the number of citations of your work.
Too, there is implicit damage to the reputation of the home department and institution from which one-sided citing emanates.
HUJ, are you listening? After all, “the Hebrew University of Jerusalem is Israel’s premier academic and research institution,” as the HUJ states on its web page. Thus, it should be held to a high standard of research reporting. The HUJ should be appropriately troubled to read what it finds here.
It is strongly recommended that the HUJ-CSG authors read Schultz’ book, and also that a course in scientific writing and ethics be taught at the HUJ. (Perhaps many research institutions involved in cloud seeding research would benefit from such courses.)
One-sided citing in F2015 also demonstrates a poor AR peer review process prior to publication, perhaps by seeding partisans (“one-sided reviewing”?) The obvious poor peer review of this article in the manuscript stage is a further reason why I have troubled to spend time doing a “comprehensive” , “no-stone-unturned” review.
———————–Organization of the Review——————
1) Overall assessment of this paper and its claims about cloud seeding potential in northern Israel.
2) Who should be assessing seeding potential in Israel? Ans. Not the HUJ-CSG, as told by their history.
3) The shifting cloud microstructure reports over the decades from the HUJ-CSG: how did it go so wrong in the first place? (Ans. “We don’t know yet.”)
4) The wrongful scientific consensus on Israeli cloud seeding: how did it go so wrong?
Ans. Inadequate peer-reviews, insufficient skepticism and too much trust on the part of scientists reviewing manuscripts on cloud seeding.
5) A mandated list of publically-available data from the F2015 field program described in this paper, and why (see above remarks).
6) “Filling in the blanks”: Correcting F2015’s incomplete descriptions of Israeli 1, 2, and 3, and operational seeding (in separate, titled “modules.”)
7) If you want to go further: the remainder of the original article, absent the abstract and Introduction sections follows in black type with “inline” reviewer’s comments following highlighted statements.
8) After the References follows reviewer’s disclaimers, baggage, conflicts of interest, a prior convictions about cloud seeding, and his background that qualifies him for this review, etc., items that should always be mentioned.
Line numbers have been added so that rebuttals or support for this review can be easily accomplished.
I don’t apologize for the length of this review. After all, reviews are intended to prevent faulty science from reaching the pages of journals, and help authors in explain their work. It didn’t happen under AR prior to the publication of F2015.
The excessive length? The HUJ-CSG has “earned it”; it can’t be trusted in the seeding domain under its current leadership IMO. If this sounds overly provocative, or even outrageous, read on:
“It didn’t come out of a vacuum[4].”
This review is virtually identical to the one I would have done for AR for F2015 and the HUJ-CSG’s accompanying proposal for Israeli-4 to the INWA if I had been asked. In polarized research environments, reviews of manuscripts by must be especially intense, every sentence checked for accuracy, every claim suspect until clearly proven; the discovery of omissions of critical data called out and discussed as in this review. F2015 encapsulates all that is right and wrong with the HUJ-CSG cloud seeding literature.
The decision from here on the manuscript version of this article would have been:
“Accept, but ONLY upon the authors fulfilling the required major revisions, posting mandated data online, and implementing corrections to their partial descriptions of prior work.”
As a proposal to initiate the Israeli-4 randomized experiment?
“Reject.”
There is insufficient evidence to guarantee a successful outcome. I review F2015 as a proposal that I myself would be asked to pay for (as an Israeli citizen will be doing).
This “review” will contain compliments and condemnations. Expect to get mad at someone, maybe me. The language is sometimes blunt, and the question of misconduct is raised[5].
- Overall assessment of F2015
This article, due to its “Jeckyl-Hyde” properties, presents a unique review challenge; some of the best conscientious scientific writing by the HUJ-CSG is in this very article; the kind of writing marked by caveats and qualifications made in a circumspect manner.
On the positive side, too, it was pleasant and unexpected to read in F2015 that the HUJ-CSG has finally agreed with long standing work, first published by R88, that the Israeli clouds are overall unsuitable for seeding with silver iodide due to their propensity to form precipitation/ice readily. This finding was re-iterated in Rangno and Hobbs (1995-herafter RH95). Due to an oversight, or small-mindedness, however, F2015 do not cite the original altruistic work.
In contrast to the positive writing mentioned, there are elements of writing in this paper that cast a dark shadow on the authors, their home institutions, and ultimately, the journal that their article appeared in, AR. Partial, and therefore, misleading descriptions of the prior Israeli experiments are found in several places, along with omissions of important references to work that was critical of HUJ-CSG findings, thus representing a stunningly “gorgeous” exhibition of “one-sided citing” in F2015, as is often practiced by the HUJ-CSG.
Nonetheless, the HUJ-CSG’s idea that inland clouds reforming over the Golan Heights/Mt. Hermon region might have seeding potential has merit and is worthy of further investigations and corroboration and expansion of the results in this paper by independent groups before any seeding takes place.
Viable seeding potential in the Golan region, however, is not demonstrated in this paper, as will be shown in subsequent commentaries.
Factors to consider in the extreme northern Israel seeding scenario: Cloud tops in northern Israel are usually significantly colder than those in the central and southern regions of Israel (Gagin and Neumann 1974, hereafter GN74; RH95).
GN74 reported modal radar tops on rain days in the north target of Israeli 2 near -19°C, whereas in the south target of Israeli 2, they were -16°C. GN74 (written in 1972) in preliminary analyses, used those temperature differences to explain why seeding was seemingly effective in the north target (more activation of AgI), but not in the south target due to less activation of AgI[6].
Today, however, due to R88, Levin 1992, 1994, and Levin et al 1996, hereafter L929496, and in F2015, we know thatboth cloud top temperatures given in GN74 would be associated with high ice particle concentrations as turrets mature; they would be highly unsuitable for seeding, a situation this reviewer feels would extend into the Golan on many, if not most, storm days.
3) Who should evaluate cloud seeding potential in the Golan? Not the HUJ-CSG
Perhaps the most surprising and troubling aspect of F2015 is that the assessment of seeding potential in the Golan is being undertaken by HUJ-CSG; “troubling” due to that organization’s prior reporting history in that domain, i.e., its inability to detect (or hid) the nature of Israel’s clouds for decades with so many tools at its disposal, and the inherent conflict of interest such a new study represents.
Philosopher George Santayana said it: “Those who cannot remember the past are condemned to repeat it.”
Moreover, if the present “background” paper by F2015 is the primary reason why a new randomized cloud seeding experiment, Israeli-4, was undertaken, then yes, the failed past of the HUJ-CSG’s seeding experiments (Israeli 1, 2 and 3) will be repeated providing that Israeli-4 is evaluated by independent, non-HUJ statisticians and scientists divested of cloud seeding interests!
The evaluation of the clouds in this article in AR is not complete enough to provide confidence that seeding is going to increase rain by an economically worthwhile amount in the Golan. A new randomized experiment, or operational seeding, both appear to this reviewer to be unwise or at least, premature undertakings in spite of Israel’s urgent water needs. Cloud seeding “salesmen” are drawn to drought like bees to a jar of spilled honey. Funders, too, are anxious to open their tills to show their constituents that they are doing something about drought. It’s a win-win situation for both. Thankfully, the INWA in a burst of courage, went “randomized” and not into direct operational seeding based on the HUJ-CSG claims.
The sad history of the HUJ-CSG reporting in the cloud seeding domain is reprised for the reader or reviewer who is/was likely unaware of it so that the faults in F2015 can be seen in the context of “damage control.” These faults also represent “baggage” carried by the HUJ-CSG and their efforts to recoup the HUJ-CSG’s damaged credibility when they re-write and minimize key elements of that seeding history in F2015.
What “baggage”, you ask?
What if the HUJ-CSG knew for decades that the seeding operations started by the INWA after Israeli 2 in 1975 and costing millions over the following 30 plus years were actually targeting inappropriate, highly efficiently precipitating clouds rolling in off the Med with little or no seeding effect likely?
What alternative would that group have other than posting one unreliable finding after another that seeding had worked anyway on such clouds?
Is it really possible for the HUJ-CSG to acknowledge error and cover up of that cloud knowledge as likely happened and apologize to the INWA and to the people of Israel? Absent that apology, the HUJ-CSG group should be terminated IMO.
The appearance of F2015 showed that the HUJ-CSG has yet one more chance (after Israeli 1,2, 3, and in their evaluations of operational seeding) to skew findings to impress an apparently still naïve INWA and their countrymen about seeding potential in the Golan.
This is the perfect example of the “fox guarding the hen house,” analogous to the Phelps-Dodge Mining Corporation being solely responsible for the environmental impact statement of its next mine. That Phelps-Dodge assessment could be right; but it would never be trusted as such without outside, independent confirmation.
Why doesn’t the INWA recognize this inherent, and, obvious to all familiar with the history of seeding in Israel, HUJ-CSG conflict of interest?
Why weren’t outside, independent groups, such as the University of Wyoming, Stratton Park Engineering Company, NCAR, Droplet Measurement Technologies, Tel Aviv University, etc., brought in by the INWA to make this assessment? The people of Israel and their media should be asking this question. The HUJ-CSG forfeited its right to do such an assessment decades ago due to their incompetence in assessing their clouds.
Lastly, because of our experiences with the HUJ-CSG and the unreliability factor in their cloud seeding publications, I URGE that INWA have outside, independent groups experienced in airborne work collect data and report on the seeding potential of Israeli clouds in conjunction with critical supporting ground measurements of the nature of ice crystals and precipitation at Mt. Hermon as a next step before experimentation begins. (OK, I’m late to the party, but that’s what I would have recommended to the INWA).
- The shifting sands of the HUJ-CSG cloud microstructure reports over the decades and their shifting implications on cloud seeding
The essential question that should be asked by all of us is, “Why did it take so long for HUJ-CSG to discover the true nature of their highly efficiently precipitating clouds, given all the tools they’ve had available to them since the later 1970s? The tools at their disposal included multiple radars, including a vertically-pointed 3-cm one (Gagin 1980), aircraft, IMS rawinsondes, and the skill of the IMS forecasters who were well aware of the efficiency (shallowness) of Israeli clouds when they begin to precipitate[7]. And this information was there in plain sight for all of us (e.g., GN74, Fig 13.4, GN76, Figs. 2 and 3, Druyan and Sant 1978).
The inability of the HUJ-CSG to detect the nature of their clouds can be either seen as an example of astounding incompetence or one of investigable misconduct if those within the HUJ-CSG knew that their clouds were not as they described them in journals so many times; but, rather, hid that knowledge from their peers and the INWA to keep their jobs, their seeding programs, and misbegotten prestige intact.
Donald Kennedy (2003), in another Science editorial on research fraud:
“In the real instances of research misconduct we know about in biology and physics, the motive appears to have been career enhancement, pure and simple. It is, after all, a competitive world, and the incentive to gain reputation can be powerful. But other motives may appear in those social sciences that bear upon major policy issues.” (Always was and always will be—reviewer’s comment)
You decide.
The reason why the Israeli government is now attempting to once again see if the clouds of Israel can be made to produce economically useful amounts of water via seeding is because none of the prior Israeli experiments produced credible rainfall increases due to seeding. And that due to the unsuitable clouds for seeding.
5) The false scientific consensus on cloud seeding created by the HUJ- CSG
That the HUJ-CSG could not discover the true nature of their clouds until recently, and did not report results of experiments in a timely manner[8], also produced an erroneous “consensus” view in the science community that cloud seeding had been “proven”in Israel (e,g, Tukey et al. 1978, Mason 1980, 1982, Kerr 1982, American Meteorological Society 1984, Dennis 1989, World Meteorological Organization 1992, Young 1993).
So what?
A wrongful consensus damages all of science! This false “consensus” was published in numerous textbooks, and in countless popular articles along the lines of, “Israelis make it rain in the desert.” Who will retroactively correct those statements?
- Mandated publically-available data requirements from the F2015 cloud sampling program
Due to the past history of much-published, but faulty, cloud seeding research by the HUJ-CSG, this reviewer would have mandated prior to publication of F2015 and before any cloud seeding experimentation took place, that the HUJ-CSG provide the following critical data online so that the wider community of experts could have evaluated the findings in F2015. These should be provided at this time:
1) A table of flight data with dates and times of flights, linked to synoptic maps and satellite imagery for those flight days, and the ability to access flight videos from this program.
2) A table detailing some of the microstructural measurements, following Hobbs and Rangno (1985), Table 1:
- a) maximum ice particle concentrations found in each sampling zone on each day over widths of of 300 m and 1-km,
- b) cloud top temperatures and heights of sampled clouds
- c)cloud base temperatures and heights of sampled clouds
- d)flight level temperature at which sample was obtained,
- e) height of the sample below cloud top,
- f) widths[9] near cloud top of the clouds that were sampled,
- g) average and maximum liquid water content in each “study” cloud,
- h) sizes of droplets <13 µm diameter and >23 µm diameter within the H-M temperature zone of -2.5° to -8° C clouds,
- i) Large size tail of the FSSP droplet spectrum (“threshold diameter”, after Hobbs and Rangno 1985)
- j) average and maximum droplet concentrations in study clouds,
- k) estimate of stage that the cloud was in when sampled
- l)results of any ground work in the Golan/Mt. Hermon
- m) back trajectories for flight sampling times over the Mediterranean Sea, and over the Golan
The mandated data elements for outside researchers to examine may seem like an undue burden to the HUJ-CSG since some of these require care to obtain. But these requirements have to be put in the perspective of how much the prior erroneous and incomplete reports by the HUJ-CSG cost not only the people of Israel in ineffective cloud seeding but also by neighboring Arab countries that undertook similar ineffective seeding operations, and finally, by the cost of the failed attempted replication of the ersatz Israeli results in Italy (List et al. 1999).
- a) The Israeli 1 experiment as described by F2015 and the counter evidence to that description; “filling in the blanks”
F2015 Abstract: “These clouds were seeded….producing statistically-significant positive effects…”
This partial description of results for the first two experiments in the authors’ abstract should have been removed by the prior reviewers. Right from the start the HUJ-CSG authors began misleading less-informed AR readers, some of whom will likely not go beyond the abstract.
There are MANY reasons why the Israeli 1 rain increase results are suspect, all known by the authors of F2015. They deflected the full story about those reasons to, “positive effects.” We reprise those reasons why no one any longer believes that Israeli 1 nor Israeli 2, have credibility as successes in rain production for AR readers who might have taken the faulty abstract prima facie:
Prior to the appearance of F2015 in AR, INDEPENDENT assessments (this cannot be overstressed) of the statistical results of seeding in Israel found them questionable at best (RH95, Silverman 2001[10], Levin et al 2010, 2011, the latter in reply to Ben-Zvi et al 2011). Those independent assessments are strongly supported by clouds that we now know are unsuitable for seeding due to the copious natural formation of ice at modest supercoolings. Indeed, the Israeli clouds have never been suitable for seeding in spite of the numerous published reports by the HUJ-CSG to the contrary.
Conversely, it was those erroneous ultra “ripe-for-seeding” cloud descriptions by the HUJ-CSG in the 1970s and 1980s that gave the statistical results of the Israeli 1 and 2 experiments credibility; that seeding really had increased rain (e.g. Kerr 1982, Mason 1982, Dennis 1989).
Thus, the F2015 authors cannot reasonably believe that actual rainfall increases occurred in Israeli 1 and 2 although they inform the AR reader of “positive effects” in the abstract. Seeding clouds whose high natural efficiency to form ice is as high as that anywhere in the world, cannot lead to statistically-significant results in a “static-style” cloud seeding experiments, as the Israeli experiments were.
Gagin (1986):
“While it is important to record the effects of seeding on rainfall at the ground, the statistical evaluation of this parameter alone cannot constitute an acceptable result of a successful seeding effect.” Q. E. D. End of story.
Turning our attention specifically to Israeli 1 and why the indications of rain increases are no longer credible:
1) The clouds of Israel have been found largely unsuitable for seeding as the HUJ-CSG themselves finally have discovered and now report in F2015, in agreement with several other studies, initially by R88. If there are no suitable clouds for seeding, then statistical results cannot be due to seeding effects, but rather must be due to “lucky” random draws, or other mischief such as omitting data, post-facto cherry-picking controls, etc.
It is worthwhile to reprise another GN74 statement concerning statistical results without a cloud foundation, a well-known principle within the weather modification community:
“…no statistical evaluation will be of real value unless these results are substantiated by detailed physical considerations.”
It’s the clouds that drive the credibility of the statistical results, not the other way around.
2) Evidence for a Type I statistical error in Israeli 1 was reported by the Chief Meteorologist of that experiment, Mr. Karl Rosner, who pointed out to Wurtele (1971) that the region that exhibited the highest statistical significance on Center seeded days, the “buffer zone” (BZ) between the two targets, could barely have been seeded (“5-10%” of the time). The HUJ seeding unit did not give this “red flag” enough attention; that is, they did not attempt to reconcile the wind analysis by Shimbursky (in GN74) with their own Chief Forecaster Rosner’s evaluation. In contrast to their Chief Meteorologist’s view, they considered the BZ inadvertently seeded (GN74).
Let us also quote Neumann et al. (1967) on the BZ issue:
“An acceptable and unbiased way of omitting most unsuitable days was to restrict the analysis to the 327 rainy days, defined as days with some precipitation in the buffer zone by the Mediterranean, a location where rainfall is unlikely ever to have been affected by seeding in either experimental area.”
3) The BZ seeding issue was examined independently and in more detail by Rangno and Hobbs (1995-hereafter RH95). In RH95 was concluded, based on their wind analysis when rain was falling in Israel (when seeding would have been expected to be taking place) that it would take a very bad pilot to have inadvertently seeded the BZ when instructed not to do so. This conclusion due to the very narrow low-level wind envelope concurrent with rain in Israel.
The Shimbursky wind analysis in GN74, on the other hand, had only a once-a-day IMS rawin launches, which may or may not have been associated with clouds and rain, and thus, could not address the direction of winds solely coincident with rain falling in Israel at the time of the launch as did RH95.
4) Additional evidence for a Type 1 error in Israeli 1 was presented in RH95 due to more rain on seeded days in the immediate coastal zone of Israel over which the seeding aircraft virtually flew, a conclusion that was reached earlier by Neumann et al 1967, also due to logistical considerations. Quoting Neumann et al (1967):
“After some 2 1/2 seasons of operational seeding experience, it was noticed that flying was effectively limited in such a way as to affect only the interior parts of the two areas.”
Gabriel (1967:
It was claimed that the seeding plane generally did not fly outside visual contact with the coastline so that there could have been no seeding effect near the coast; hence a 10 km
wide coastal strip must have been unaffected.
Gabriel and Baras (1970)
The second modification was suggested in 1963 in view of the actual flight patterns of the seeding plane. It seemed that seeding could only effectively reach the interior parts of the two areas and that analysis should therefore be restricted to these sub-areas.
Rosenfeld (1997) in a series of grand speculations concerning Israeli 1, offered an alternative to RH95 and those by the experimenters: he argued that some of the airborne-released AgI dispersed downward from the initial releases in the southwesterly or westerly flow, was eventually into in a thin offshore flowing layer near the ground. That portion of the plume, Rosenfeld conjectured, then went offshore, was ingested by seedable clouds (which we know do not exist; never did) at the right distance upwind for the AgI to rise up into the those offshore clouds, nucleate at appropriate levels (usually above 3.5 km ASL), grow into precipitation-sized particles that fell out just in time on the Israeli coast, thus “explaining” the indications of a bias in storms (more rain on Center seeded days on the Israeli coast).
Whew. Irving Langmuir comes to mind….
On Rosenfeld’s behalf, there is an occasional offshore flowing shallow layer during less vigorous synoptic rain situations, and one largely confined to early morning hours. But, Rosenfeld provided no statistics on how often that shallow offshore flow occurred while seeding was taking place in Israeli 1.
5) Too little seeding (an average of but 4 h per day and only about a kilogram of AgI, Gabriel 1967) was carried out and dispersed in Israeli 1. RH95 demonstrated that the area claimed to have had increased rainfall (under the seeding line, sidewind, downwind, in the target) was not commensurate with the amount of seeding material released in Israeli 1, a conclusdion reinforced by unsuitable-for-seeding clouds (R88, F2015).
6) The line seeding carried out by a single aircraft flying 75 km up and down the Israeli coastline was deemed ineffective by RH95 in having seeded enough clouds to have produced an effect; more rigorously corroborated in later modeling studies by Levin et al. 1997.[1]
- b) The Israeli 2 experiment as described in F2015 and the counter evidence to that description; filling in more blanks
In Israeli 2, the HUJ-CSG, realizing the poor seeding strategy it had used in Israeli 1, added a second aircraft, and 42 ground generators in Israeli 2 (NRC-NAS, Panel on Weather Modification, 1975). In Israeli 1 there had been but a single aircraft, and four ground generators located in the far NE of Israel (GN74).
The authors omit for the AR reader, the fact that the north “positive” effect in Israeli 2 was found to be the product of an astoundingly one-sided random draw[2] for heavy storms throughout Israel (Gabriel and Rosenfeld 1990[3]), and also one that affected Lebanon, and Jordan (RH95). The extraordinary random draw saw the home of HUJ-CSG in the south target experience the most rain of all the stations available to RH95 on north target seeded days!
Ignoring the report of extreme rain in the south target on its control days, those when the north target is being seeded, Rosenfeld and Farbstein (1992) proposed that dust-haze, when combined with AgI, had caused overseeding of clouds in the south target; that is, rain had actually been decreased while the north target, having fewer “dust-haze” days, experienced rain increases due to seeding. This assessment gained wide traction for a time (e.g., Simpson 1990, Presidential Address to the Amer. Meteor. Soc., Young 1993), but like so much HUJ-CSG work, it was unreliable.
Let us quote Gabriel and Rosenfeld (1990) on the rain in the south target:
“Otherwise, one would need to explain why there was so much more rain in the south when the north was being seeded; as of now, no explanation is available, especially as the prevailing wind direction is from the southwest[4].”
Ergo, rain in the south was not “decreased” by seeding, but rather, in no way could seeding overcome the astounding random draw for north seeded days[5]. And, as we expect, the finding of extreme rain in the south target on north seeded days is not mentioned by Rosenfeld and Farbstein. How could they?
The rain throughout Israel on north target seeded days once again points to efficiently precipitating clouds that are doing just fine without seeding with AgI.
Levin et al 2010 examined Israeli 2 in more detail than did RH95. They attributed the apparent seeding-induced extra rainfall in the interior of the north target as due to a bias in strong synoptic systems on north target seeded days, one that created a misperception of seeding (see also, Levin et al 2011, reply to Ben-Zvi et al. 2011).
Ironically, the Levin et al. (2010) findings are strengthened in F2015 when they observed that the intrusion of large aerosols inland from the Mediterranean on windy days in the north increased rain efficiency of inland clouds.
The Israeli 2 experiment had several design options (GN74), the first of which was the “crossover” evaluation, the same evaluation mode as was used in Israeli 1. The true tragedy of Israeli 2, however, was in the omission of numerical results of random seeding in the crossover scheme, and in the south target by the HUJ-CSG after 1974. It was an omission that kept the scientific community in the dark about how the full Israeli 2 had actually turned out.
While it is true, as GN81 pointed out, that the larger area of seeding done in the south in Israeli 2 reduced the correlation with the north, thus making seeding effects harder to detect in Israeli 2 compared with the Center/North crossover comparisons in Israeli 1. Nevertheless, a crossover analysis based on the prior Center target gauges could have been presented with whatever caveats the authors wished to add. The prior Center target gauges were in zones S1 and S3 of Gabriel and Rosenfeld (1990). However, it is clear from the SAR’s of those regions in Gabriel and Rosenfeld (1990) that the crossover result of Israeli 2 was not going to replicate Israeli 1. At this point, if GN81 had done what they should have, they would have displayed that null result, and provided some thoughts on why it had happened.
It took 15 years after Israeli 2 ended, and at that, spurred by a letter writing campaign begun in the winter of 1986 by the Israeli experiments’ own Chief Meteorologist, Mr. Karl Rosner, to “out” both the crossover results (-2%) and the negative SAR (-15 to -20%) for the south target. And this was ONLY after the lead HUJ-CSG experimenter passed in 1987.
We have to assume that without Mr. Rosner’s public call for the exposition of the crossover and south target results, they would still be hidden from view within the HUJ-CSG. Why weren’t authors, Gabriel and Rosenfeld, or others at the HUJ, troubled by this omission over the years after Israeli 2 ended in 1975[6]? (Ans. We don’t know why.) Donald Kennedy does:
“The difficulty is that positive claims are sometimes made against a background of unrevealed negative results.”
Furthermore, the early reports of a “confirmation” of the results of Israeli 1 due to the partial reporting of an Israeli 2 “success,” limited to the north target in a target-control evaluation, spurred the decision by the INWA to begin an “operational seeding” program in 1975 (GN76), one that produced no viable results for more than 30 years when evaluated by independent scientists.[7] And, perhaps, those Israeli 2 partial results also convince the INWA to begin Israeli 3 in the south target of Israeli 2.
Did the INWA know about the south target results of Israeli 2 before they began Israeli 3? We don’t know what inspired Israeli 3. INWA, F2015: please tell us.
Where, too, was the outside cloud seeding community, one that failed to raise post-publication questions about the results of random seeding in the south target of Israeli 2 following GN81? ( I count myself in this oversight…and blame.) Statistician Jerzy Neyman, who closely monitored cloud seeding publications and had a reputation for commenting on them, would surely have caught the Israeli 2 omissions had he not passed in 1980. There is a lot of blame to go around.
Not reporting the south target results of Israeli 2, one that superficially suggested decreases in rain on seeded days also suppressed the inevitable questions that would have arisen: “How could there be a suggestion of decreased rain on seeded days with such ultra “ripe-for-seeding” clouds (with warmer tops than in the north) as had been described by the HUJ-CSG over so many years?
Without doubt, the wheels would have come off the HUJ-CSG’s seeding train with full reporting of Israeli 2 in a timely manner. And the report in Science that there had only been “one success in 35 years” in cloud seeding (Kerr 1982) would never have occurred.
We reprise the speculation of Gabriel and Rosenfeld (1990) near the end of their statistical analyses, one that was to be confirmed 20 years later by Levin et al. in 2010:
“The most plausible explanation (for the statistical results of Israeli 2) is one of random variation, with the north-seeded days being more rainy inland, especially towards the northern and southern edges of the experimental region.”
7 c) The reported, primary effect of seeding in Israeli 2: duration: where it stands today (it’s not credible).
Virtually the entire supposed seeding effect claimed in the Israeli 2 experiment was due to a greater duration of rain, not greater intensity (GN81, Gagin and Gabriel 1987, hereafter, “GG87”). Seeding with AgI, they reported, caused cold-topped (-15°C to -21°C), non-precipitating clouds to precipitate exactly like natural clouds, thus extending the duration of rain on seeded days (north target evaluation only). The increase in that one temperature range was a whopping 46%, all of it due solely to extended duration caused by seeding!
That duration finding no longer makes sense in the face of highly efficiently precipitating Israeli clouds. It never really did upon close, independent inspection.
7 d) The Israeli 3 experiment: its delayed reporting, and its significance
The first interim report about the progress of Israeli 3 randomized experiment from the HUJ-CSG was in 1992 (Rosenfeld and Farbstein), 17 years after it began[8]. Decreases in rain were suggested in that experiment year after year. The final result, reported by Rosenfeld (1998) at conference, was that after 19 winter seasons and nearly 1000 random decisions there was an indication of a decrease in rain of 8% on seeded days (non-statistically significant).
In F2015, the authors, following in the footsteps of GN76, cannot divulge for the AR reader the indication of decreased rain on seeded days in Israeli 3. Instead they cloak that result, as did GN76 for the Israeli 2 south target, with the correct but carefully chosen word, “inconclusive”. “Inconclusive” could refer to increases or decreases in rain that are merely not statistically-significant; reporting indications of decreases, even if not statistically significant, would have raised more interest.
The 8% suggested reduction in rainfall on seeded days after 19 winters and nearly 1000 random decisions were important on two accounts: that 1000 random decisions after 19 winter seasons could lead to a result so far from a null one after so many random draws, assuming there really was no seeding effect as Rosenfeld (1998) asserted. IF Rosenfeld and Farbstein (1992) are right about “dust-haze” combined with AgI, then the HUJ-CSG in the conduct of Israeli 2 and 3, combined, have decreased rain for 25 years in the central and southern parts of Israel.
Israeli 3 also demonstrated that the clouds of Israel are unsuitable for glaciogenic cloud seeding. There is nothing substantially different between the clouds that affect the central and southern regions of Israel from those that affect the north in terms of microstructural behavior except that the clouds in northern Israel are overall generally colder from top to bottom. In both regions they glaciate effectively.
And, who would undertake a randomized seeding experiment for 19 years knowing you might have a natural draw so far from zero that can’t even be overcome by an actual 10% seeding-induced increase in rain[9]? (One wonders about the quality of the random draw again…)
7 e) Operational seeding: the descriptions in F2015 and the counter evidence to those descriptions; filling in still more blanks
F2015: “Subsequently operational seeding in the north of Israel was carried out between 1975 and 2013.”
The above quote by the HUJ-CSG authors’, writing in 2015 in AR, shows that they cannot bring themselves to report that the “operational seeding” program in the north of Israel, as it was originally formulated, was terminated in 2007 (Sharon et al 2008[10]). We quote Sharon et al. 2008 for the AR reader:
“3b. A revision and elaboration of possible future seeding activities
In view of Kessler et al.’s initial finding in Section 2a and the ensuing controversy, a joint forum of the
National Water Authority and other professionals involved, met early in 2007. After 50 years of uninterrupted seeding activities, the forum decided to discontinue the program at the end of that rainy season (April 2007) and instead, consider the initiation of a new updated experiment, Israeli IV.”
Why was the original program terminated by the INWA and its panel[11]?
Answer: The independent panel of experts (Kessler et al 2002, Kessler et al. 2006, distilled by Sharon et al 2008) could find no additional runoff due to seeding into the target, Lake Kinneret (aka, Sea of Galilee) over the 30 plus years of seeding. They also found that the small increases (6%) reported by Nirel and Rosenfeld (1994); Rosenfeld and Nirel (1996) could not be substantiated when more data from later years were used. This null finding for the operational program by Kessler et al. was later corroborated by independent scientists at Tel Aviv University (Levin et al. 2010, 2011, the latter in reply to the comments of Ben-Zvi et al 2011).
At this point, one wonders who the reviewers of an article in the respected journal, AR, were?
How could they let such partial statements and an article absent vital references appear? One must also assume that the reviewers for AR were woefully ignorant of the history of the Israeli experiments to have allowed the F2015 distortions reach the print stage of a major journal. Truthfulness and a full exposition of events is not part of the HUJ-CSG’s understanding of how to compose a manuscript for a scientific journal. Their manuscripts and publications, in essence, need to not just be reviewed, but “policed” for accuracy.
F2015: “Additional statistical analyses showed that the orographic precipitation responded most sensitively to the seeding experiments (Givati and Rosenfeld 2005).”
F2015 claimed in the above publication, that air pollution had decreased precipitation exactly by the amount that seeding was increasing it in the interior of Israel (thus explaining the lack of operational seeding effects reported by the independent panel). The finding by Givati and Rosenfeld (2005)
could not be substantiated independently by either (Alpert et al 2008, Halfon et al 2009a[12], b) nor by Levin et al. 2010. The pollution claim by Givati and Rosenfeld (2005) was found to be ambiguous at best.
It is useful to quote Thom (1957) on how Givati and Rosenfeld came up with their “pollution” findings (as was demonstrated by Alpert et al 2008 and Halfon et al 2009):
“If one takes the liberty of choosing among minimum distance controls, he can often find any result for seeding that suits his purpose, either positive or negative.”
That the results of operational seeding as reported by the HUJ-CSG could not be validated by independentresearchers on four occasions (Kessler et al 2002, Kessler et al. 2006, Halfon et al 2009, and Levin et al. 2010, 2011 (reply to Ben-Zvi et al) is one of the most important aspects of the seeding history in Israel.
For those who know this story, we again see one-sided citing in this discussion; the HUJ-CSG in F2015 cannot bring themselves to cite those publications, damaging those independent workers, themselves, and whether they realize it or not, their own home institutions.
HUJ, are you listening? Isn’t it best if you policed the HUJ-CSG publications instead of someone like me doing it after they’re out in print?
- A critique of the cloud sampling and its effects on the cloud microstructural properties reported: how unbiased are they?
This discussion will make it clear why F2015 must make videos from their research flights publically available; these are crucial to understanding what they did and how they did it.
Median concentrations in “hard”, newly risen turrets over the Mediterranean, as the authors show in Figure 16 from their Mediterranean cloud targets, produces a bias toward low ice particle concentrations and higher liquid water contents compared to values that would be found as those same clouds as they matured minutes later. The authors know this. The authors are to be commended for adding the description of the stage that the Mediterranean clouds were in when they were sampled. This really helps the experienced reader weight those “medians” in the Figure 16.
But did the authors’ sample “hard” but meteorologically inconsequential, slender, “chimney” Cu as well in Figure 16? These are ones we know produce little ice/precip compared to their wider brethren even if they are at the SAME cloud top temperature (e.g., Schemenauer and Isaac 1984, Rangno and Hobbs 1991). Cloud top width, in particular, is an extremely important metric and should be listed in an online supplement by F2015.
Some background on the width issue: the apparent error of penetrating isolated, likely “chimney” Cumulus with “smooth, hard tops” Cumulus clouds instead of the wider complexes that produce appreciable rain in Israel was one that was made in the original cloud reports coming out of the HUJ-CSG in the 1970s and 1980s (e.g., GN74, GN76, Gagin 1975, 1981).
Due to that sampling strategy, it misled those HUJ-CSG scientists on the ice content in their clouds, and ultimately their journal audiences. In contrast to those early cloud samples, GG87 reported that the average duration of a shower in Israel was 23 minutes. With just a 10 ms-1 wind carrying that shower along, that rain would have fallen from a cloud system at least about 13 km long; at least 26 km long if it was carried along in a 20 ms-1 wind!
So, what DID F2015 sample that was relevant to Israeli shower clouds? We don’t know. But its critical that we do know.
Another source of bias toward low ice concentrations can result if the authors, in fact, did sample wider, high ice-producing complexes, but only penetrated the very newest, “hard” turrets in them (typically on the upwind side) in which the explosion of ice had not yet occurred.
Lastly, another critical metric for understanding the quality of the HUJ-CSG authors’ measurements in Fig. 16 is the height of sampling below cloud top. Sampling too close to cloud top, say, tens of meters instead of a few hundred meters, also leads to a low detection of precipitation-sized particles (and also why Re satellite derivations can mislead in newly risen turrets, and in ice-spewing, supercooled water-topped layer clouds common in orographic settings. This again reinforces the need for videos of the F2015 study.
- The HUJ-CSG’s continuing trouble with ice
The HUJ-CSG has carried out several airborne sampling programs with modern droplet and hydrometeor probes over the past 25 years, beginning in the middle 1990s (Rosenfeld and Lensky 1998). Further airborne studies were conducted by Lahav and Rosenfeld (2000), Rosenfeld et al. 2001), and by F2015. Maximum ice particle concentrations and the degree of ice multiplication were not divulged by the HUJ-CSG in any of these publications!
In F2015, we finally have ice particle concentrations! However, what we get are unsatisfactory-for-seeding-potential, “median” concentrations obtained in “hard” turrets for those clouds in the Mediterranean. This prevents us from understanding the “ice life cycle” of Israeli clouds.
Ice particle concentrations, and their origin, has been one of the continuing mysteries of cloud microstructure (e.g., Mossop 1970, 1985); in particular, a primary enigma is how secondary ice forms in clouds with top temperatures warmer than about -15°C, as occurs prolifically in Israel. AR readers are likely aware of the 2017 Amer. Meteor. Soc. Monograph (Field et al.[13]) that focused on the origin of secondary ice and the puzzle it still represents.
Israel is in a region of confluence of various aerosols that affect clouds. Reports of the degree of ice multiplication from Israel would have surely helped fill in some microstructural blanks in our knowledge. What a shame the HUJ-CSG can’t address this question in their cloud sampling programs!
Too, where are the droplet spectra and graupel concentrations in the Hallett and Mossop secondary ice-producing temperature zone of -2.5° to -8°C? Nowhere to be found. More missing pieces to the knowledge required to understand the clouds of Israel. Why does it feel like I am reading a paper written in 1968? The authors could have done better with the “black glove” technique, or a foil sampler (Koenig 1963).
From the reviewer’s experiences in 1986, ice multiplication in the clouds of Israel is rampant. But, remarkably, only L929496, has addressed this issue in Israel been addressed over the past 43 years since Gagin (1975). The study of ice multiplication, a staple of airborne cloud microstructural studies over the past 60 years (e.g., Mossop et al 1972). T he HUJ-CSG seems to have trouble since the early 1980s of honoring this standard.
This discussion above begs the question about why F2015 didn’t target mature and dissipating portions of Mediterranean clouds after high ice particle concentrations had formed? Its inexplicable. The statement by F2015 that mature, heavily precipitating clouds were avoided due to aircraft safety considerations is not credible to us researchers in airborne studies. Heavy icing, graupel, hail are found in the younger turrets, not in the maturing ones where icing is subdued due to the formation of high ice particle concentrations that consume the liquid water.
Neither can the HUJ-CSG’s median ice concentrations be compared to the concentrations of ice in Israeli clouds reported by L929496 who was somehow able to sample the high ice-containing regions of Israeli clouds that F2015 found so dangerous.
Specific examples of HUJ-CSG reporting from airborne work over the years since Gagin 1975:
Rosenfeld and Lensky (1998) flying on shower days in pursuit of a comparison between satellite and aircraft measurements of Re, wrote that they did not carry a 2-DC probe for hydrometeors on their aircraft on the two flights with showers (!).
Lahav and Rosenfeld (2000), in a ten flight sampling program having a 2-DC probe, nevertheless refrained from reporting ice or other hydrometeor concentrations, while titling their paper, “Microphysical Characterizations of the Israeli Clouds from Aircraft and Satellites.” But that’s not what they did, or, at least reported. They only reported partial results. Sound familiar?
Rosenfeld et al. 2001 had a 2-DC on their research aircraft, but once again, refrained from reporting concentrations of hydrometeors in the clouds they sampled. What they did report was that there was a “large number”, or that they were” increasing” or “decreasing.” What’s going on here? How does such reporting like this make it into a prestigious journal like PNAS?
This reviewer’s guess, from his 1986 Israeli field project, is that the HUJ-CSG has found in those several airborne projects mentioned above that they have an “embarrassment of ice particle riches” and wants to keep those concentrations and the degree of ice multiplication away from AR readers and funders who might consider cloud seeding. Ice multiplication in clouds has always been considered an impediment to successful “static” glaciogenic cloud seeding (e.g., GN74, Dennis 1980).
Is there another motive by the HUJ-CSG for keeping maximum concentrations from us? Yes, another critical omission of results by the HUJ-CSG. To repeat:
“The difficulty is that positive claims are sometimes made against a background of unrevealed negative results.”
This is why, again, that independent groups are critical in evaluating seeding potential in Israel!
INWA, are you listening?
Gagin (1975), in support of ripe for cloud seeding clouds, claimed that ice particle concentrations do NOT increase with time. This finding could have been evaluated, too, at many points in the HUJ-CSG airborne studies.
Even more relevant is that those very same ice-filled clouds over the Mediterranean Sea are going to be swept downwind and into the Golan within ~30-40 min during rainy spells, making it doubly important to have reported those maximum concentrations and followed their evolution downstream in route to the Golan.
In sum, yes, you CAN mislead with an aircraft, even one with a full complement of 21st century cloud microstructure instruments via omission and sampling biases.
The points raised in the foregoing section concerning the airborne sampling carried out by F2015 emphasizes all too well why in-flight videos must be made publically available as they are at the University of Washington and also for a number of other projects at NCAR.
To summarize the dark history of the HUJ-CSG: over a period of several decades: it misled their own people and the world repeatedly about their clouds, withheld statistical results for Israeli 2 for 15 years, results that would have raised so many questions, delayed for 17 years the reporting of results from the Israeli 3 randomized experiment that, too, would have raised numerous questions. And under its new leadership, that following the passing of Professor Gagin still can’t seem to publish reliable results about their cloud seeding work, either. Neither can they fully report on their clouds such basic information as the degree of ice multiplication that Israeli clouds exhibit.
Furthermore, and this may the most telling of all, every paper the HUJ-CSG has published and that has been examined by outside, independent investigators, has been found to be unreliable. Will more unreliable HUJ-CSG claims be turned up in their literature? It seems inevitable.
One can predict confidently that in the future the HUJ-CSG will, without major changes to its leadership, and without a more skeptical INWA concerning the claims coming out of that group, “repeat history.”
——–End of “Commentary” on the F2015 Abstract and Introduction—
Following the Abstract and Introduction segments, F2015 improves demonstrably; it is written extremely well in places, representing the best in what we think of as scientific writing. However, there are still a few lapses and reviewer-required “clarifications” that will be addressed as they appear. The type in black is that from the original article.
The objective of this paper is to present the available knowledge on the cloud properties in northern Israel, which supported the decision to commence with the Israel-4 experiment, as briefly described above. Section 2 describes thetypical synoptic conditions during the rainy days and the dynamics of the clouds as they interact with the sea and the topography. Section 3 describes the methodology of the physical experiment, the cloud physics aircraftinstrumentation, flight patterns and methodology of data analysis. The methodology of supporting satellitemicrophysical retrievals is also given in this section. The results of the measurements with respect to aerosols and theway they determine the microstructure at cloud base are given in Section 4.1. The subsequent vertical evolution ofcloud microstructure with height above cloud base and initiation of rain are described in Section 4.2. The mixed-phase processes and availability of super-cooled cloud water are presented in Section 4.3. Finally, a summary ofthe results and a discussion of the suitability of the clouds over the Golan Heights to glaciogenic seeding aregiven in Section 5.
- Synoptic, dynamic and macro-physical considerations
2.1. Meteorological conditions
The synoptic systems that are responsible for more than
90% of the annual precipitation in northern Israel occur with cyclones passing through the north-eastern part of the Mediterranean Sea, these cyclones are referred to as Cyprian Cyclones (Goldreich, 2003). A rain event typicallystarts with the passage of a cold front followed by a thermal low that develops in the cold air-mass behind thefront due to the relatively warm sea and the lee effect of the Turkish mountains to the north. An upper trough withrelatively cold air aloft is associated with the cyclone, which increases the thermal instability and favors thunderstorm formation over the sea. First precipitation over land typically starts with the arrival of the cold front, as the air ahead of it is characterized by dry and often dusty air from the Sahara desert. Fig. 2 shows the synoptic conditions on a typical rainy day in Israel, at the time of the cold front arrival. As the winds veer from southerly towesterly, the low-level air becomes moister and the cloud-base elevation lowers to a typical level of 500-1000 m (allabsolute heights are given above sea level). The thermal instability reaches its maximum in the thermal low afterthe passage of the cold front. The average wind speeds are often greater than 10 m/s and they contribute to theorographic component of the precipitation. When the low-pressure system moves to the east the instability is graduallyreduced. However, due to the long trajectory of the cool low-level air over the warm sea the instability and moisture supply supports continued rainfall for another day or two.
Minor: The IMS refers to periods of rain as “rainy spells.” This is because they often consist of several consecutive days with recurring showers. In Israeli 1, there was a period of 17 consecutive days with rain. The F2015 highlighted sentence might be revised to reflect the occurrence of “rainy spells.”
2.2. Cloud dynamics
Fig. 3 illustrates the cloud and precipitation characteristics on a typical rainy day in the air-mass behind the coldfront. It is a west–east cross-section across northern Israel, and it is based on our observations and impressionsfrom the physical experiment. The schematic figure is intended to illustrate the main features of the cloud and precipitation processes that often take place as the air-mass travels eastwards across the land and over themountains.
Figure 3 and its caption: “…clouds in a typical rain day on northern Israel, as a west-east cross section from the Mediterranean Sea to the Golan Heights. Rain originates in convective clouds over the sea as graupel and hail. The sea spray from the rough sea seeds the clouds hygroscopically. Orographic cloud over the Galilee are often seeded by the remnants of convection. The clouds evaporate into the Jordan Valley and reform over the Golan Heights.”
This figure is over-simplified, perhaps out of necessity due to the many scenarios that would have to be presented to reflect the several stages in Israeli storms as troughs come and go as documented in the comprehensive satelllit studies by Rosenfeld in 1980, 1982, by Gagin 1981, R88, RH95).
F2015 show a higher level stratiform region extending from a line of convection at the Israeli coast in Figure 3. However, it is but one snapshot of an incoming storm, not a semi-permanent pattern as the AR reader might infer. There are many other scenarios that could have been drawn, which could have been as online supplements to fill in the picture of Israeli rainy days more. Figure 3 is really much closer to a depiction of the coastal convergence zone that tends to develop in the later nighttime and morning hours during lesser onshore flow periods (e.g., Neumann 1951, Goldreich 2003).
Satellite imagery reveals that during major events (lines of convection organized by upper level troughs) clusters of Cumulonimbus clouds and stratiform rain areas barge into Israel en masse. While the roots of the of convection might be lessened when they move inland in wintertime, as F2015 note, these mesoscale/synoptic scale systems march across Israel with much of the deep, precipitating cloud system intact. They do not separate completely, as a rule, into an upper layer and lower layer as shown in Figure 3. Too, some of the rain that falls is due to aggregates in quasi-stratiform debris clouds.
The Stratocumulus over the hill regions in Figure 3 might be accurate for that specific moment of an approaching storm. However, drizzle, and mist-like rain (due to collisions with coalescence) often falls from such hill-topping overcast low clouds topping out, as shown in Figure 3, at about 3 km ASL[1]. It should have been pointed out that such low clouds, “auto-precipitate.” They frequently top out at temperatures where seeding them would not be effective (> -5°C, e.g., R88).
In later winter and spring, shallower Stratocumulus clouds tend to lift off the lower hills as temperature rises during the day, and by later afternoon can sprout into small Cumulonimbus clouds (glaciated clouds) under cold trough situations. Also, due to the local strengthening of the onshore flow during the afternoons, incoming convection can weaken and may disappear altogether in the coastal divergence zone responding to that strengthening flow.
The deepest clouds in springtime are frequently over the inland hill regions rather than offshore as evidenced by an increase in lightning frequency inland during the late winter and spring.
Minor: Figure 3 also indicates that the bases of the clouds reforming over the Golan are virtually as low as those on the hills of Galilee. This seems implausible under the loss of precip water and downslope motions in prevailing westerly flow. Bases should be higher over the Golan, and probably closer to the freezing level? Or?
As mentioned in the previous section, the lower troposphere during a typical rainy day is quite moist and unstable due to the relatively warm sea (sea surface temperature never drops below 17 °C) and colder air aloft(typically below + 2 °C at 850 hPa during the rainier days).
The cycle of Mediterranean Sea temperatures from fall to late winter is significant. It starts out at around 22°C and descends gradually to 17° C. Cloud base temperatures, hence, water content in clouds and the propensity to form warm rain and copious ice, also are impacted, likely further reducing seeding opportunities in the warmer fall/early winter period.
This favors the formation of fairly deep convective clouds over the sea. This is also why hailstorms and lighting activity are more probable near the coastline and less common further inland (Altaratz et al., 2003; Goldreich, 2003).
Lightning activity is about equal over the Mediterranean Sea and inland areas in November and March (Altaratz et al. 2003). This equality likely extends into April as well.
When these convective clouds move inland, they become separated from their main sensible heat and moisturesource and weaken quickly.
To repeat, the roots of convection may weaken, but these major complexes usually don’t separate with a clear zone between upper and lower clouds as shown in Figure 3; its just one of many scenarios. F2015 do not support their Figure 3 scenario with frequencies of occurrence during the winter. How does it compare with the frequencies of other storm scenarios?
However, the moist air that is pushed inland by the strong westerly winds is forced upwards by the topographyof the western Galilee, and therefore an orographic component is added to the weakening convective clouds. The annual precipitation amount in the upper Galilee peaks at 1000 mm, as compared to the ~ 600 mm at the coast.
When the air continues eastwards it descends about 800-1000 m to the Jordan (Hula) valley, the clouds, unlessthey are synoptically forced, tend to dissipate and break up. This leaves the valley with an annual precipitation amount of only
~ 500 mm. This is the area where often visual flight rules can apply and below-cloud aerosol measurements can be made safely.
The slopes of the Golan Heights force the air to rise again and to produce new orographic clouds with smallerdroplets.
Check+
The crest of the Golan Heights rises gradually from a height of 400 m in the south to 1200 m in the north. Further north, Mount Hermon rises up to an elevation of 2800 m. The Golan Heights are 45–70 km away (shortest distance) from the coastline and the clouds there are normally less convective than the clouds overthe Galilee and over the sea, because much of the instability is consumed upwind.
“…normally less convective… ” True, except maybe for November and spring when convection over inland regions is apparently more evenly distributed if lightning occurrences are an indicator (Altaratz et al 2003). What are the seeding implications of enhanced convection in the Golan? Do the authors know? Likely less potential if deeper clouds in the Golan glaciate at modest supercoolings.
The terrain over the Golan Heights is also less complex than over the Galilee and therefore the flight throughthe clouds over the Golan Heights is often relatively smooth. The top of the ridge is only about 10-15 km downwindfrom the foothills where the clouds form. This leaves the clouds little time to convert their water into precipitationbefore they start to dissipate and lose their water content back to the atmosphere.
We reprise Figure 1 from F2015: Isn’t the target too small and close from seeding release points for seeding to result in a fallout of precip on it? Where does the water go in the lee of the Golan, to Syria or into Lake Kinneret? (This diagram should have had a kilometer scale.)
GN74 estimated 30 min for precip fallout from line seeding, as do F2015. In the HUJ-CSG publications we find various distances from the aircraft line seeding at which the fallout of seeding-induced precipitation may have occurred, possibly due to variations average wind velocities used . These ranged from 25-35 km downwind (Gagin and Neumann 1976; 35-50 km (Gagin 1981); 25-45 km (Gagin and Neumann 1980) ; “about 40 km” (in GG87) to “25-35 km” in F2015.
So which is it?
And what wind speeds were used in F2015? And why? What climo did you use? The estimate contained in Gagin 1981 (35-50 km) appears to be too great a distance for a precip fallout for this project to be successful except in deep southwest flows.
What are the flight levels of the line seeding aircraft? Why is this information not in F2015? This is critical information since if those seeding lines are too low, the seeding material will not reach the necessary heights for nucleation and precip fallout in time to help runoff. (Perhaps this information is contained in the full proposal?)
How can airborne or ground releases target the region north of the dashed line in Figure 3, including the wettest location, Mt. Hermon, when seeding plumes have to climb to between 700 and 500 mb levels to nucleate effectively and when the primary wind flow is westerly? In winds even a little north of westerly, it does not appear that seeding is going to be viable in the wettest portion of the Golan unless you get help from Lebanon.
And isn’t the downwash into the Hula Valley going to be detrimental to seeding the Golan?
See the wind rose for 850 mb for those times that rain is falling in Israel from RH95. It would appear that many periods of precip in the north part of the Golan, anyway, will not be able to be seeded efficiently.
Lastly, seeding can reduce upslope precipitation by reducing the degree of riming on upslope precipitation. Riming is reduced as new, tiny AgI ice crystals form reduce or deplete the upslope supercooled LWC. The trajectories of ice crystal/snow precipitation are less steep, raised since riming accelerates the downward fall of snow and that will be lessened in seeding. Will it be made up by more ice crystals?
Ground measurements of precipitation should have been incorporated into the proposal to the INWA or mentioned in F2015 in supporting their contentions about seeding potential in the Golan.
In case there are synoptically-forced or mature clouds above, which survived the descent to the Jordan (Hula)valley (Fig. 1), they often precipitate through the orographic clouds and seed them naturally from the top.
What is the frequency of occurrence of this scenario?
The annual precipitation amount over the ridge increases from 600 mm in the south to more than 1200 mm over Mount Hermon to the north, mainly depending on the surface elevation (Goldreich, 2003).
2.3. Aerosol dynamics
The trajectory of the air mass that is associated with the Cyprian Cyclone passes various regions on its approach to Israel. Each of these regions leaves its signature on the aerosol properties. One of the common features of the warm sector of the approaching low-pressure system is the reduced visibility due to increasing loads ofdesert dust in the air. The winds with the southerly component get stronger as the cold-front comes closer, lift the dustparticles from the surrounding deserts and keep them airborne. The low-level convergence raises the dust particleshigher up, so they can travel greater distances. The dust concentrations are normally higher in central and southern Israel than in the northern part. This is due to a number of reasons: 1) Northern Israel is farther away from the main dust sources; 2) The south-westerly flow ahead of the cold front travels some distance over the south-eastern Mediterranean before arriving to northern Israel, and is occasionally associated with pre-frontal rains that can wash out some of the dust particles; and 3) The Israeli deserts in the south, where sand and dust storms are common, can also contribute to the aerosol population in central and southern Israel. After the passage of the cold-front with the arrival of the cool air, the visibility tends to quickly improve.
Dust particles can act as cloud condensation nuclei (CCN) and may also serve as natural ice nuclei (IN). The seeding potential of the clouds is therefore expected to depend on the presence and the concentrations of thedust particles in the boundary layer and in the free troposphere. This was the reason, according to Rosenfeldand Farbstein (1992), to why they found a positive seeding effect both in northern and in central Israel when theystratified the experimental data based on dusty and non-dusty days. Consequentially, one can assume that therelease of silver iodide may have the intended effect of accelerating the precipitation formation only when and where natural IN supplies are limited and ice does not readily form in the super-cooled clouds.
Another common and important aerosol type that is quite abundant when strong westerly winds are prevailing is thesea salt aerosols. The breaking waves and rough seas trap bubbles of air in the sea water. As the bubbles float backand reach the surface of the water, they burst the thin film of the seawater and release small drops into theatmosphere — the sea spray. The largest drops may quickly fall back to the sea, but those that stay airborne just 5
long enough have the chance to remain in the air for a much longer time period as they evaporate and get smaller and more concentrated. The vertical mixing in the boundary layer together with the convergence associated withthe low- pressure system assist in raising these sea salt particles to the cloud base level. These fairly coarse and hygroscopic particles are the first to act as CCN and make the largest droplets in the cloud, which serve as embryosfor subsequent raindrops.
Concerning “sea spray” and large droplet formation in Israeli clouds:
The discussion of sea spray and bubbles strongly resembles that of Woodcock (1953). These researchers stand upon the shoulders of Woodcock but do not cite him. This again points to weak reviewing of the pre-publication manuscript. We quote Woodcock (1953) below:
“It is suggested that bursting air bubbles in “white caps” on the open sea are a major source of the salt nuclei, and that a greater portion of the sea surface may act as a source of these particles during average winds than might be judged from the relatively small area usually covered by white caps”.
We note with interest that Woodcock was likely wrong in his initial 1953 finding (e.g., Woodcock et al. 1971).Woodcock’s finding that large particles are more numerous on “average wind days” rather than days associated with a large number of whitecaps, supports the occurrence of warm rain on more days than just those with numerous whitecaps and stronger winds in Israel.
More work is needed on this finding by F2015, preferably, again, by independent groups.
L929496 should be cited here. In Levin’s studies it was found that large CCN comprised of sulfate-coated desert particles led to large droplets in Israeli clouds starting at cloud base. He did not report on sea surface conditions, however.
————————
However, rather than strong winds and “sea spray”, the occurrence of large droplets in clouds are likely to be modulated by cloud base temperatures and low or moderate droplet concentrations in clouds over Israel and the Mediterranean, with relatively weak cloud base updrafts in which only the largest CCN are activated.
In an R88 case study, clusters of Cumulus congestus clouds moving in from the Mediterranean Sea on a nearly calm day and produced light rain showers with cloud tops only near 0°C. Cloud base temperatures on that day were above the average quoted range of 5° to 9°C, about 11°C.
Cloud base temperatures vary substantially in Israel, not only changing as the air mass trajectory changes, but also due to the warm to cool cycle of the eastern Mediterranean from fall to late winter and spring where the temperature can start at 22°C at the start of the rain season, and ends up at 17°C in mid-late winter.
In RH95, it was noted that cloud base temperatures in Israel varied from 12°C to 5°C. There would be approximately 40% more water available for condensation with the highest cloud base temperatures compared to the coolest ones, given the average cloud base altitude of about 800 m above sea level. We note that the authors are aware of this effect of cloud base temperatures, but they do not present those temperatures.
Herut et al. (2000) analyzed the chemical composition of nearly 600 samples of rain water collected all aroundIsrael during five rainy seasons. They found that the sea-salt fraction of the rainwater composition is influencedmainly by the distance from the Mediterranean Sea, with a decrease from 73% of sea salt fraction in the coastalsamples in the north to 55% in the samples from the Golan Heights. They also reported that the contribution of non-sea-salt precursors to the salinity of the rainwater was much greater in the south due to higher input of continentalcomponents and lower annual precipitation there.
- Methodology of the microphysical measurements
3.1. The research aircraft
A twin-engine turboprop Beechcraft King-Air C90 aircraft was instrumented for the cloud physics measurementsduring the rainy seasons (November through April) between 2009 and 2013. At the start of every season the airplanewas fitted with the aerosol and cloud-microphysics instrumentation as well as the data acquisition and displayinghardware and software. The entire system was tested on the ground periodically while the airplane was standing-byready for suitable weather to arrive.
3.2. Instrumentation
For measuring the concentrations and properties of the aerosols we used a CPC (condensation particle counter), acloud condensation nuclei (CCN) counter and an aerosol spectrometer.
The CPC (TSI model 3781) is a water-based condensation nuclei counter that measures the total concentrationof particles larger than 6 nm in diameter, at a 1-Hz temporal resolution (Hering et al., 2005). The simple design, fast response and continuous measurement help detecting variations in aerosol concentrations that could be related to the atmospheric thermodynamic structure, pollution sources and/ or aerosol nucleation events. It is aninstrument that is fairly easy to handle and maintain and is considered reliable.
The CCN counter that was purchased from Droplet Measurement Technologies (DMT) for the experiment is a continuous-flow streamwise thermal-gradient counter (Lance et al., 2006). It measures the concentrations of theparticles that were activated into small droplets at a set super-saturation, as well as the sizes of the activateddroplets. The CCN counter can measure continuously at a constant super-saturation or alternatively cycle thoughuser-defined super-saturations for measuring the CCN spectra. The downside of changing super- saturations is that ittakes a couple of minutes for the temperatures to stabilize and the actual super-saturation to settle around the required super-saturation. This also happens when the sample temperature or the pressure changes due to changes in flight altitude. We were therefore flying most of the time with a constant super-saturation (typically 0.5%), exceptduring the dedicated time for measuring the CCN spectrum at a constant flight level below the cloud base (typicallytwo-thirds of the way from the surface to the cloud base). The effects of the sample pressure on the actualsuper-saturations as well as the temperature changes within the instrument were accounted for during the data analysis and quality control.
During the rainy season of 2009–2010 we had a DMT manufactured
aerosol spectrometer (PCASP-X2) onboard (Tan et al., 2010). As opposed to the CPC and the CCN counter, it does not expose the aerosols to any super-saturation, but actually does the opposite; it dries the air sample for avoidingaerosol swelling due to absorption of water vapor. The PCASP-X2 measures the diameters and concentrations of aerosolsin the range 100 nm to 10 μm. The instrument was mounted inside the cabin. The air intake was isokinetic only up toaerosols of about 2 μm, thus truncating the sampling of much larger aerosol than 2 μm.
Another DMT instrument on the plane was the Cloud, Aerosol and Precipitation Spectrometer (CAPS)(Baumgardner et al., 2000). It consists of two spectrometers (CAS and CIP) and sensors for measuring thetemperature, relative humidity, static and dynamic pressures as well as a hot-wire for measuring cloud liquid water content (LWC). The CAS (Cloud and Aerosol Spectrometer) measures particles and droplets at the diameter range of 0.5 to 50 μm. The instrument is mounted on a pylon under the wing and measures directly the airstreamfrom the cloud. The measured aerosol spectrum is therefore sensitive to the relative humidity. Accounting for thiseffect is not possible without knowing the chemical composition of the aerosols, so we mainly used this probe as asecond cloud spectrometer for particles larger than 2 μm, as a backup for the main cloud droplet probe (CDP) and forquality control.
The CDP is a DMT-made cloud droplet spectrometer that measures the concentrations and sizes of the cloud droplets in the 2–50 μm diameter range (Lance et al., 2010). This range is divided into 30 bins, which are muchnarrower than the bins of the CAS (in the cloud droplet size range). Both probes size each droplet that crosses theirsampling volume, based on the amount of light that is scattered forward when the laser beam hits the droplet.
The DMT-made Cloud Imaging Probe (CIP) (Baumgardner et al., 2000) provides 2-D images of precipitationparticles based on their shading pattern on a 62-element array of photo- diodes. The CIP that has been used hadpointy tips, to minimize error due to shattering of large particles, and a resolution of 15 μm so the nominal widthof the array corresponds to a length of 930 μm. The CIP allows identifying the different habits of the ice particles aswell as distinguishing them from rain/ drizzle. It is not possible to directly derive the mass of the precipitationparticles when ice is present due to their complex form and sensitivity to their orientation. However, the number concentration of the particles (after software partial removal of splinters from shattered particles) along with particleimages can be useful for identifying different microphysical phases in the clouds.
Details of the methodology used to remove “splinters from shattered particles” by F2015 is mandatory due to the HUJ-CSG’s prior excess removal of “splinters” from in-cloud measurements that apparently misled them about ice formation in their clouds (e.g., Gagin 1975). We also note that F2015 used a 2-DC probe with “pointy-tips” as described by F2015 to minimize artifacts in the first place.
So, to re-iterate something that shouldn’t need to mentioned more than once, “Why can’t F2015 report concentrations of ice particles, beyond the medians Figure 16?”
Other parameters that were being recorded during the flights were the air temperature, the relative humidity andthe navigation data from the GPS system.
3.3. Flight patterns and execution
During the four rainy seasons of the physical experiment, 27 research flights were conducted. Each flight lastedtwo and a half to three hours on average.
How different were the synoptic settings?
A table of dates and times of flights is mandatory as are related synoptic maps (surface and 500 mb maps) preferably those embedded with satellite IR imagery. IMS, aircraft soundings, and, if available, Beirut rawinsonde profiles, should also be made available. Radar imagery should also be posted online for these flights.
These will help corroborate the authors’ findings; to insure that cherry-picking of a few particular synoptic regimes hasn’t been done to “improve” the overall apparent magnitude of seeding potential. (One can observe the lack of trust of the HUJ-CSG on the part of the reviewer here in evaluating seeding potential with the baggage they now carry. Sorry, HUJ.) If they did select only certain flow regimes, because only a few produce targeting possibilities, they should have stated this.
Fig. 4 displays a typical flight track. The black curved line shows the ground path, while the colored line isprojected and colored according to the flight altitude. The numbering relates to the geographical locations that arementioned below.
The take-off was either from Sade-Dov airport in Tel Aviv (denoted as point “1a” in Fig. 4), or from Ben-GurionInternational airport which is ~ 20 km to the southeast (point “1b”). The flight typically started with flying out to theMediterranean Sea at low level in order to assess the roughness of the sea and to safely measure the aerosolsbelow cloud base (point “2” in Fig. 4). This was followed by profiling the deepest clouds in the region from bottom to top,away from local pollution sources over land, while heading north (to point “3”). The profiling was done either at aconstant climbing rate of ~ 500 ft/min in case the cloud layer was continuous or by flying horizontally through cloudsand climbing stepwise 500–1000 ft in the cloud-free air, in the case of well-defined convective clouds. After reaching andsampling the tops of the convective clouds over the sea we were normally able to look eastwards towards the hilly regions of northern Israel, and identify new clouds over the Galilee. We would then fly to these clouds and profilethem from their tops to the lowest safety flight level (6000 ft) in a spiral (point “4”).
We note that the sampling height over the Galilee district is about 3500 feet above the bases of the Mediterranean Sea and coastal clouds.
Sampling “new” clouds might bias ice concentrations to lower values than actually developed a little later. Perhaps the authors don’t mean “new” in the sense of cloud stage?
The next step was to descend to below the cloud bases over
the Jordan valley between the western and eastern mountain ranges (i.e., between the Upper Galilee mountainsand the Golan Heights) in order to measure the aerosols inland.
Heights of cloud bases and temperatures should have been given here; preferably listed in a comprehensive table for all flights and different sampling regions.
This was either done over the Hula Valley (point “5a”) or over the Sea of Galilee (“5b”), depending on the weatherand/or the air traffic control directions. The CCN counter was set at this point to cycle through three super-saturations(normally 0.3, 0.6 and 0.9%) for approximately 15 min, while we were flying in circles at a constant altitude, and tryingto avoid areas with rain. The third cloud profile was done over the Golan Heights, starting with the cloud basesover the eastern edge of the valley and above the slopes (point “6”). Due to the proximity of the Syrian border, therest of the climb over the crest was mostly done either in spiral ascent or in a number of north–south legs, each approximately 5 min long, perpendicular to the westerly wind direction, until reaching the cloud top or the heightwhere the cloud was fully glaciated. At that point we typically started heading back south, unless we had a chance tocomplete another profile or measurement that we were not able to complete earlier. Finally we landed at Herzliyaairport (point “7”).
The maneuvering was reasonable in consideration of the realities of the area. However, as the authors know, sampling on the upslope side of mountains leads to more LWC and less ice than would be found farther downwind. Again, is radar coverage of the sampling area on the fight days available? Did the aircraft have recorded radar imagery? If so, can it be made available for each zone that sampling took place? Are there ground hourly precip reports?
3.4. Data analysis and quality control
The main software onboard the research aircraft for real- time data acquisition was PADS (Particle Analysis and Display System). PADS has been developed and is maintained by DMT. This data was subsequently processed byour own procedures for merging PADS and non-PADS datasets, extending the analysis from the research aircraftmeasurements, as shown in Section 4.2.
Interesting commentary here on what happens to DMT’s PADS processing package. What exactly is meant here, “processed by our own procedures”? What changes, if any, are made from what PADS puts out? Does DMT agree with this revision to your software’s output? These may be harmless, but they should be discussed.
- Results and discussion
4.1. Aerosols and cloud base microstructure
The research aircraft was not equipped with instruments to study the chemical composition of the cloud and rain water. However, we noticed that often on windy days, after flying through a cloud, there were white streaks ofsalt left on the windshield of the aircraft after the evaporation of the cloud water streamers. Fig. 5 shows what theaircraft windshield looked like after passing through a cloud over the Sea of Galilee on 3 Feb 2010, as an example.This is one of the expressions of high salinity of the cloud/rain water in Israel, as had been studied by Herut et al. (2000) and mentioned in Section 2.3.
Nice photo.
Another and more quantitative expression of the abundance of sea spray is achieved by comparing the aerosol size distributions (ASD) that were measured by the PCASP-X2 below cloud bases (Fig. 6).
Each curve shows a 60-second averaged ASD at elevations between 400 and 700 m. The black, blue and greencurves show the ASD measured on 28 Feb 2010, which was a fairly windy day (mean wind of 10.3 m/s at Haifa Port during the flight time). The sea was rough and full with white caps — and hence we would expect an extensivedischarge of sea spray.
We note again that Woodcock et al (1971), in later studies of the chemical composition of rain, did not find the expected association between salt in rain. We would like to see independent confirmation, of course.
It can be seen that these three curves have the greatest concentration of super-micron aerosols — even when the measurement was made approximately 45 km inland (the green curve) over the Hula Valley. These largestaerosols are normally the first to activate into droplets at cloud base at rather low super-saturations, as they act as giantCCN (GCCN).
There were probably more GCCN than what is shown in Fig. 6, but the experimental setup and the inlet of thePCASP-X2 caused the truncation of the ASD at aerosol dry diameters greater than 2 μm, as mentioned in Section 3.2. However, despite the slight undercounting of the super-micron particles, it may still be useful to lookinto the geographical differences in their concentrations.
Fig. 7 presents the statistics of the concentrations of super- micron (diameter N 1 μm) aerosols in the marine boundary layer and at the foothills of the Golan Heights measured during four different flights. The dataset comprises the 60-second averaged PCASP-X2 concentrations measured at a maximum elevation of 1000 m above the ground. In-cloud and noisy measurements were filtered out, so each box in Fig. 7 is based on 5 to 20 one-minute averaged aerosol distributions. The green text above the boxes denotes the mean wind speed and direction that were measured at Haifa Port at the time of the flights.
One can see that the last flight (12 Apr 2010) stands out in the sense that this was the only flight where the super-micron particle numbers at the foothills of the Golan Heights were not considerably smaller than in the marineboundary layer. On the other three flights the large aerosol concentrations over the sea were 2–5 times greaterthan ~ 45 km inland. The smallest difference and the greatest inland concentrations (excluding the last flight) wereon 28 Feb 2010 — the day with the strongest winds. This implies that relatively little time was available for the large particle to settle on their way inland. The greatest difference and lowest inland concentrations was on 26 Feb2010, with the weakest winds out of the three earlier flights.
Levin et al. 2010 attributed their finding of synoptic bias that explained the north target results of Israeli 2 to to stronger synoptic systems with strong winds that drove the precip max farther inland. The authors’ finding seems to support the idea that large, Mediterranean Sea-derived aerosols also played a role in creating an ersatz seeding effect in the interior regions of that experiment.
The wind speed at the shore is not the only factor that determines the absolute concentrations of the super-micron particles and certainly not their rate of removal through cloud and precipitation processes.Furthermore, there could be additional sources of super-micron particles, other than sea spray, such as desert dustand local pollution. The PCAPS-X2 does not distinguish between the different particles, this allows only aqualitative estimation of their relative contribution to the observed values.
The flight notes and pictures from the flight of 12 Apr 2010 indicate hazy conditions over central and northernIsrael, with desert dust being the probable main constituent of the super-micron aerosols. That is also the day withthe weakest winds recorded at the shore and lowest concentrations of large aerosols near the coast, so the seaspray production may be the lowest on that day, compared to the three others. Low sea spray production and highregional dust loading can explain the relatively low concentration of large aerosols over sea, and the small differences between the marine boundary layer and the foothills of Golan Heights, as were observed on that day(Fig. 7).
What were the offshore cloud droplet concentrations for 12 April 2010?
Both desert dust and sea salt have the potential of accelerating the precipitation formation, but through different microphysical processes. The sea salt is an efficient CCN/GCCN, which can produce large cloud droplets and drizzle particles, and hence speed up the warm rain processes. The larger droplets are also more likely tofreeze and accelerate the rate of secondary ice splinter production (Mossop and Hallett, 1974). Desert dust particles,on the other hand, may not be as effective CCN as sea salt, but they tend to be more efficient ice nuclei that mightmake cloud seeding with silver-iodide redundant on dusty days. This may be something to account for in operational cloud seeding.
The sub-micron particles contribute much more to the aerosol total number concentrations than the super-micron particles. A large source of small aerosols is local pollution, especially when the air-mass travels inland over densely- populated areas, such as in central Israel. This is demonstrated by comparing the blue and green curvesin Fig. 6 with the black curve — all from 28 Feb 2010. The first two curves demonstrate the fairly low backgroundaerosol concentrations on that day because the green curve, despite showing an inland distribution, is from the rather sparsely-populated north. The black curve, on the other hand, shows the aerosol size distribution downwindfrom the heavily-populated Tel Aviv area where the concentrations of both sub- and super-micron particles increase. But it is the sub-micron population that dominates the number concentrations, thus being responsible fordoubling of the PCASP-X2 concentrations from ~ 350 cm− 3 over the sea to~700 cm−3 about 10 km downwind ofTel Aviv.
The remaining three curves in Fig. 6 show the aerosol size distributions on relatively calm days; one with hazyskies — due to dust that was transported from SW (12 Apr 2010) with mean winds of 7 m/s at Haifa Port; and one with no haze (26
Mar 2010) and mean winds of only 4 m/s. The ASD of 26 Mar
2010 (in purple) shows the least super-micron particles despite being sampled only 5
km inland. With weak winds and calm seas the production of sea spray was very limited, but local air pollutionprobably caused the high concentrations of the sub-micron particles. The red ASD in Fig. 6, which was measureddownwind from the heavily industrial area near Haifa, had the highest total aerosol concentration of all other ASDs. There were about 1000 cm−3 particles in the 0.1 to 2 μm size range. These particles make the largest partof the CCN population.
Fig. 8 presents a comparison of two CCN spectra from another flight. The blue curve shows the CCN concentrations at three different super-saturations (nominal 0.3, 0.6 and 0.9%), as measured over the sea on 2 Jan 2012 at ~ 600 m.
What were cloud base heights, if any? What time of day was this measurement made? Onshore or offshore flow? The Bet Dagan sounding nearest the time of the flight should be presented so we know this case is not a fair weather day with the aerosols clamped down by stable layers. Also, over what distances were these data collected?
The CCN concentration at 1% super-saturation is estimated at 360 cm− 3, while the total aerosol concentrationmeasured by the CPC was 700–1000 cm-3. The red curve, on the other hand, shows the higher CCNconcentrations ~ 45 km inland. The low-level winds on that day had a clear southerly component, which could have brought the pollution from the industrial area near Haifa to the Hula Valley. The CPC concentrations below theclouds were 3000–3500 cm-3 while the CCN concentrations at 1% super-saturation were close to 2000 cm-3. The actual cloud base super-saturation was probably lower, as the highest cloud droplet concentrations in that area barely exceeded 1000 cm-3 on that day.
The cloud drop concentration and size distribution at cloud base are determined primarily by the properties of theaerosol population (concentrations, sizes and chemical composition) as well as the cloud base updraft. GreaterCCN concentrations and stronger updrafts lead to nucleation of more and smaller cloud droplets at the cloud base.
Fig. 9 shows a comparison between the shapes of the cloud droplet size distributions (DSD) slightly above the cloud base for a windy, a hazy and a calm day — all over the sea. All DSDs have a mode near 10 μm, a totaldroplet concentration of ~ 120 cm-3 and a liquid water content of ~ 0.04 g/m3. However, the difference that standsout between the DSDs is the “tail” of the largest droplets. While on the calm day of 26 Mar 2010, the DSD is quite symmetric around the mode, it becomes more and more skewed with increasing concentrations of super-micron aerosol concentrations (see matching colors in Fig. 6). On the windy day of 28 Feb
2010, the concentration of the ~ 20 μm cloud droplets is about an order of magnitude greater than on the calm day,with the concentrations of the hazy day in between.
Would like to see more November – December data, that period when the Mediterranean Sea temperatures are warmer; cloud bases, too!
A comparison of near cloud-base DSDs of more than 20 clouds sampled during 12 different flights over theMediterranean Sea and the Golan Heights, is presented in Fig. 10.
There is no separation between windy, hazy or calm days because the emphasis here is on the geographicaldifferences. Because the cloud droplet initially grow (in diameter) rather quickly, only clouds within a hundredmeters from the cloud base were considered — as long as the mode of the volume-weighted distribution wasbelow 10 μm and the mean LWC was between 0.01 and 0.1 g m− 3. These filters were applied in order to avoid including DSDs from clouds whose bases could not be documented due to safety and air traffic controlrestrictions, as well as in order to exclude highly diluted clouds. In addition, the cloud base altitudes had to be within 300 m in both locations on the same day. This is to prevent large variations in cloud base temperatures that determine the amount of condensable water vapor near the cloud base.
Superlative considerations, but where are the ACTUAL cloud base temperatures? Nowhere to be found! The reader will want to know what they were to compare with “historical” reports of cloud base temperatures. Also, without care, low LWC’s and small droplets can be found in clouds with bases that are evaporating upward providing a false indication of where an original base was. Here’s where flight videos would be helpful to outside researchers evaluating these claims.
The integrated LWC of the mean cloud base DSD over the sea and over the Golan Heights, as indicated inFig. 10, is comparable (0.052 vs. 0.045 g m-3, respectively). This facilitates the comparison of the shapes of the observed distributions because it suggests that the differences in the distance of the compared samples from the actual cloud base and/or different exposures to entrained cloud-free air, are probably not the main contributors to the non-overlapping DSDs in Fig. 10. This leaves the different mean aerosol properties and cloud base updrafts as the probable causes for the different DSDs. However, the greater instability over the sea isexpected to produce stronger updrafts that would result in a larger number of CCN to activate there — assuming acommon CCN spectra. This would shift the blue DSD in Fig. 10 to the left, i.e. to smaller sizes. But the mode of theblue DSD is actually ~ 4 μm larger than the red DSD (9.0 vs. 4.8 μm). So apparently the different mean aerosolproperties and their resulting CCN spectra, as the example in Fig. 8 shows, are the main factors in shaping the mean near cloud base DSD.
The droplet number concentrations that corresponds to the DSDs in Fig. 10 are 225 and 480 cm-3 over the sea andthe Golan Heights, respectively.
These are very credible concentrations from the author’s experience in Israel, except on some haze and smoke, afternoon “fair weather” Cu days (Cu mediocris, even Cu congestus) in the Golan (where the reviewer was briefly in ‘86), droplet concentrations would likely be higher than 480 cm-3.
The larger number of activated droplets over the western slopes of the Golan Heights results in the smallerdroplet sizes near the cloud bases there, compared to over the sea.
Furthermore, the proximity of the Mediterranean clouds to the source of the sea spray tends to result in a tail oflarger droplets, as the comparison of the mean near cloud base DSDs in Fig. 10 shows. This is due to the activation ofthe giant CCN there (which are much fewer than the rest of the CCN). The 90th percentile DSDs in Fig. 10 (filled circles above the curves) indicate that the cloud base DSD over the Golan Heights can also have a considerabletail of large droplet. This is probably caused by activated sea spray, which has been transported inland withstrong winds, because the dust particles, as discussed above, are less efficient as CCN.
Here is another finding about large aerosol particles that supports the Levin et al 2010 reanalysis of Israeli 2 and the finding that strong synoptic situations led to the misperception of a seeding effect in the interior of the north target.
The largest cloud drops at the tail of the DSD have greater fall speeds than the smaller cloud droplets, and therefore they can collide with and collect the small droplets and grow further. Those droplets also have higher probability of freezing in sub-freezing temperatures and hence help producing precipitation-sized particles moreeffectively. The clouds over the Golan Heights, however, most often have a smaller tail and hence convert theircloud water into precipitation-sized particles by warm processes less efficiently.
4.2. Vertical evolution of cloud microstructure
The convection that occurs from synoptically or topographically-induced updrafts raise the cloud droplets that nucleate at cloud base to higher elevations and colder temperatures.
This is such a common descriptor combination it’s hardly worth pointing out, but a temperature cannot be warm or cold. Peter Hobbs: “A cup of coffee can be warm or cold, but not a temperature.” A temperature refers to an object that is warm or cold. It itself, a number, cannot be warm or cold, it tells one aspect of the physical state of an object.
The droplet condensational growth is determined by the number of activated CCN and the height above cloud base(Freud et al., 2011). The rate of droplet coalescence is determined mainly by droplet size and is related to the 5th power of cloud drop effective radius (re) (Freud and Rosenfeld, 2012). This rate depends also on cloud dropletspectrum width and concentrations. When re exceeds 14 μm rain tends to initiate. This process takes normally a fewtens of minutes and requires that the typical convective cloud in Israel would exceed a vertical extent of 2 to 3 km(Freud and Rosenfeld, 2012).
This process normally takes “tens of minutes”? It’s not is clear what the authors are referring to. Is “tens” of minutes from the first visible evidence of a cloud?
If not, F2015 need to walk along the beaches of Israel when the skies are boiling with Cumulus to Cumulonimbus transitions as I did. RH95 show incontrovertible evidence of the rapid glaciation of Israeli clouds, within a few minutes.
But let us assume a Cumulus cloud forms (becomes visible) at 800 m above the Med. It contains a 5 m sˉ¹ updraft. From an 800 m it would reach the freezing (typically about 2500 m above sea level on rainy days), in 340 s, and the 700 mb level (3000 m) in 440 s, where the temperature is typically about -5°C. To reach 4000 m ASL, about 600 mb, would take 640 s since the cloud first appeared above the Med Sea. The temperatures are now typically-10°C or lower on Israel rain days at 600 mb (4000 m).
The 700 to 600 mb (4 km ASL) temperatures are typically in the zone where ice is initiated in Israeli clouds (-5°C to -10°C). At still lower cloud top temperatures, the ice concentrations would increase (in non-chimney clouds).
Ice would be appearing rapidly in such a cloud in just over ten minutes from its initial appearance as a visible cloud, and certainly, if it reached the -12°C to -15°C, would contain hundreds per liter of ice particles from its first appearance, and in just a few minutes after surpassing the freezing level. Go to your radars and look at the time to first echo.
But why do we have to go through this simple example?
Please allow me to take your research plane up next winter (with a 2-DC probe that works). How about if I bring DMT’s Darryl Baumgardner or Duncan Axisa along to insure accurate 2-DC concentrations from the DMT CAPS probe? I bet that in the first two hours of flight I can find the highest concentration of ice particles that has ever been REPORTED by the HUJ-CSG in 40 years. I may not find the highest that they have measured; only the highest that they have REPORTED. (They seem not to want their funders, nor the rest of the science community, to know just how high ice particle concentrations can be in Israeli clouds. Is there another reason why they don’t report them in airborne study after airborne study?)
The authors, or at least one of them, is well aware of this fast-glaciating behavior of Israeli clouds and has been for at least 30 years (e.g., Rosenfeld 1997; Rangno and Hobbs, 1997.)
Perhaps the phrase, “tens of minutes” was a careless entry in the original ms?
Fig. 11 shows the evolution of the DSD with increasing height in convective clouds over the Mediterranean Sea on 12Jan 2012. The mean DSD of every cloud pass is given as a single curve in the plot. The clouds were repeatedlypenetrated close to their tops as they grew, until small precipitation particles (diameter ~100 μm) were detected bythe CIP at the altitude of 3000 m, on that day.
How close to cloud top? Too close to cloud top misses the formation of precip because they lag the smaller droplets at the tippy-top.
These cloud-top “precipitation embryos” become much larger (N 1 mm) as they fall through the cloud and collect othercloud droplets and precipitation particles. On other days, precipitation embryos were detected in the growingconvective clouds at other altitudes depending on the specific conditions (Freud and Rosenfeld, 2012). However,most of the time that happened when the volume-weighted mode of the DSD exceeded ~ 20 μm.
For comparing the vertical evolution of the DSD for clouds growing in different aerosol environments, it is easier to represent the entire DSD with a single number, such as the cloud drop effective radius. This was derived from the binned
“EQUATION”
The values of re, the mode of the volume-weighted DSD and the droplet mean volume radius (rv) are linearlycorrelated as most DSDs have a generally similar shape (Freud et al., 2008). Freud and Rosenfeld (2012) showed that these relations are independent of geographical location. They also showed both theoretically and empiricallythat the mode of the DSD and rv have values that indicate the initiation of rain. This is why vertical profiles ofre, derived from satellite retrievals (Rosenfeld and Lensky, 1998) can be used in real time to estimate the droplet sizes at cloud top, as well as their potential for forming precipitation even before it is detectable by the precipitation radars. This concept is already in use in the operational cloud seeding program in Israel. An example of the retrieval of the cloud microstructure for 10 Dec 2012, at 10:56 GMT (12:56 LT), in the form of re vs. cloud top temperature, is presented in Fig. 12.
This retrieval is based on NPP/VIIRS high-resolution data, which allows effective analysis of differences in the microstructure of clouds developing in rather small user-selective areas (Rosenfeld et al., 2014).
What is the depth of cloud from which these retrievals were derived? One meter? 10 m? 100 m? 1-km? This should be stated here for the AR reader. Ice will certainly fall out of super cooled liquid-topped layers in the Golan; Re will mislead in those instances. Another reason for ground obs in the Golan.
There are three T–re profiles for different regions in this figure; the Mediterranean Sea (area 3), the Galilee (2) and the Golan Heights (1). The median re (the bright-green curve in each sub-plot) in areas 3 and 2 reached 15 μm at a temperature of about -5 °C. In addition, the T–re profiles in these two areas indicate that cloud glaciation has occasionally occurred at temperatures as warm as -10 °C.
Can F2015 supply numbers to quantify the “occasionally” statement? Also, isn’t this old news, about 30 years old, about clouds glaciating/raining when their tops are >-10°C? (See R88; not cited here, as one would expect by the HUJ-CSG). Also, from the IMS, 1986: “We get good rains from clouds with tops at -10°C.” This quote demonstrates how the every day weather forecasters within the IMS could have prevented the early cloud misinformation published by the HUJ-CSG, that clouds had to be much colder–topped before they rained.
Glaciation is indicated by spikes of high re and by a red tone of the cloudy pixels.
In contrast, the median re of the clouds over the Golan Heights (area 1) did not reach the precipitation thresholdof 14 μm (Rosenfeld and Gutman, 1994) and did not show any indication of glaciation. The cloud tops thereappear to contain mostly super-cooled drops despite developing above the -10 °C isotherm.
To emphasize, in more stratiform clouds, the top of ice-producing clouds is often supercooled droplet clouds, as reported on several occasions (e.g., Cunningham 1957, RH85, Rauber and Tokay 1991). The Re reported here is likely to be misleading. Ground confirmation is required for assertions of “non-precipitating clouds” as indicated by an Re value.
Perhaps, since F2015 do not discuss it, they are not aware of the problem in using Re when precipitating clouds have liquid tops from which ice emanates? Can they supply hourly precipitation data, radar imagery or weather reports for these times in the Golan?
While there may be, indeed, supercooled LWC at cloud top, it is from that liquid top that ice crystals are spawned, grow, and breakup increasing ice particle concentrations below top (Hobbs and Rangno 1985). In turn these consume water vapor via deposition/riming in ice supersaturated conditions. Is F2015 sure they want to disrupt this system by seeding a liquid topped ice-producing layer?
While Fig. 12 presents a snapshot of a single case, as an example of how the different re profiles look in cloudsdeveloping in different areas, it is useful to use a statistical approach and examine additional cases. Fig. 13 showshow the cloud droplet effective radius varies with the cloud top temperature. It is based on all high-resolution satelliteretrievals from the rainy season of 2012–2013 that were suitable for obtaining the T–re profiles for clouds over theMediterranean Sea and over the Golan Heights. In total, seven retrievals from days with seeding potential, according to the criteria of Israel-4, contained clouds with varying tops in both areas. The cloudy pixels were grouped according to their 11.8 μm brightness temperature to clusters with the same temperature ± 1 °C, and then differentpercentiles of re were calculated for each group. Fig. 13 displays the first and third quartiles for each cluster and area as dashed lines, and the median re in each area as a solid line. Only clusters containing more than 100 data points are displayed for more robust statistics.
All the curves in Fig. 13 show an increasing re with colder cloud tops, but the change tends to be more substantialover the sea. The median re over the sea (blue solid curve) crosses the precipitation threshold of 15 μm alreadyat − 3 °C, even before the silver iodide can have any effect, compared to − 12 °C over the Golan Heights (redsolid curve).
I applaud the authors for this information, highlighted above. It gives one hope that we may not travel down the same path that the HUJ-CSG has traveled so many times before. We rephrase the authors’ somewhat obtuse description more simply for the reader:
The clouds moving into Israel from the Mediterranean Sea are unsuitable for seeding with silver iodide.
This is a new finding for the HUJ-CSG, and it should have been given more attention in F2015. R88 should have been cited here, who concluded virtually the same thing 27 years before F2015 were able to discover it.
By not citing those who went before, it makes F2015 look like the work of small minds, not that of disinterested scientists only interested in truth. Omitting relevant work is devious, harms conscientious workers, and degrades the HUJ.
Is this really how F2015 want to represent their home institutions? It would seem so.
This means that on average, the clouds over the Golan Heights have to acquire a greater vertical extent than theclouds over Sea to start precipitating. The probable cause for that is the greater aerosol and CCN concentration(e.g. Fig. 8) and less sea salt particles further inland (Fig. 7). But the different characteristic dynamics andthermodynamics of the clouds may contribute to the differences as well.
As in Fig. 12, Fig. 13 also shows indications of early glaciation over the sea at rather warm temperatures ofaround − 10 °C, where the 75th percentile of re is close to the saturation value of 40 μm. Furthermore, thecurves indicate that the clouds over the sea tend to have a greater vertical extent and reach colder temperatures.
The temperature bugaboo strikes again.
This is probably caused by the stronger convection over the sea that encourages the formation of deep clouds, while the clouds over the Golan Heights normally have a more orographic nature and a layered structure, accordingto our subjective observations.
In November, and in later winter and spring, thunderstorms are as common at inland hill regions as over the Mediterranean (e.g., Altaratz et al. 2003), so the idea of perpetual stratiform clouds over the Golan as suggested by F2015 is flawed and needs to be revised to draw this out. Too, clouds may not be ripe for seeding in these deeper convective situations that occur in November and later in the spring. Further independent airborne work is needed.
This is also supported by the differences in the patterns of rain durations and intensities between the coastal and hilly stations in Israel (Goldreich, 2003), where rainfall at the coastal plain is much more intense and has a shorterduration.
It is important to keep in mind that the colored curves in the subplots of Fig. 12 can be considered as verticalprofiles in the convective clouds because the cloud base temperature do not tend to vary much within the sameconfined area. re also shows little variance in a given area and altitude (Freud et al., 2008) and the cloud top re at agiven temperature does not vary much during the lifetime of a convective cloud (Lensky and Rosenfeld, 2006). Fig.13, however, is based on seven different profiles, not necessarily with the same cloud base temperature and probably with varying aerosol properties and atmospheric thermodynamics. This is why the curves in Fig. 13 cannot really bereferred to as vertical profiles that represent the development of individual deep convective clouds. They should be treated as a general statistical view of the T–re relations in the indicated areas.
These are excellent qualifiers, as scientific writing should contain when necessary.
The large number of flight hours and the penetration of clouds at various heights and in differentgeographical areas facilitate a similar statistical analysis to what is presented in Fig. 13 for satellite data, with thein-situ data.
The flight hours are really not so large at <81.
What is far more important, to repeat, is the synoptic setting in which the flights actually took place. As a reviewer, I would have mandated a supplemental appendix with synoptic maps and satellite imagery for each flight be supplied by the authors prior to publication.
I am sorry to say that the HUJ-CSG long ago forfeited the right to make general statements without comprehensive backup material that independent researchers can investigate for reliability. Furthermore, and I repeat for emphasis, videos of flights should be made available on request or made
available online. Most of us “senior researchers” who know well the trail of the prior reports from the HUJ-CSG, understand why more evidence is required from them in their cloud seeding reports than might be the case for another institution. “Fool me once, shame on you; fool me twice, shame on me.”
The 1 Hz measurements inside the clouds represent a spatial averaging along a ~ 100 m long path. Thesemeasurements from 15 research flights that were conducted during the physical experiment were groupedaccording to the measured temperature at the flight elevation. The percentiles of the CDP-derived re were calculated for each group of measurements and no other filtering or normalization was applied except thegeographical separation between the clouds over the Mediterranean Sea and the Golan Heights. Fig. 14 shows acomparison between the re values of the clouds sampled over these areas. Here too the apparent trend ofincreasing re with colder temperatures is more pronounced over the sea than over the Golan Heights, as in Fig.13.
The two profiles appear to separate around the temperature of − 5 °C, where the marine cloud seems to maintain its convective profile, i.e. increasing re with colder temperatures. Over the Golan Heights, however, the effects ofelevated cloud layers with embedded convection and/or secondary droplet nucleation, may explain the offset ofthe peak between re and LWC (see Fig. 17). This is supported by the statistics of the droplet numberconcentrations around those peaks (not shown here). The differential likelihood of freezing of larger cloud droplets,elevated cloud layers, cloud-top entrainment and precipitation, may all contribute to maintaining a low median re attemperatures below − 10 °C.
References supporting the freezing of larger drops could have included, for example, Vali 1971, Pitter and Pruppacer (1973), among many others. FYI: HR85 used the large size end tail of the cloud droplet spectrum (the so-called, “threshold diameter”) as measured by a FSSP-100, in newly risen, low ice containing Cumulus turrets as a predictor of later maximum ice particle concentrations. It worked pretty well except in short-lived narrow “chimney Cu”.
The percentile-profiles of the satellite-derived re of the convective clouds over the sea exhibit greatervariance than those of the orographic clouds over the Golan Heights (Figs. 12 and 13). This is partly caused by theso-called 3D effects — the variable illumination of the cloud tops by the sun due to their inhomogeneous physicalstructure (Marshak et al., 2006). The cloud top re of cloud surfaces that incline away from the satellite, i.e. ina direction that increases the sun–cloud–satellite angle, would be overestimated (even more in shaded cloud surfaces). The cloud surfaces that incline towards the satellite would have their re underestimated due to theopposite effect, resulting in a falsely wide re distribution for clouds with a non- horizontal cloud top surface. This, ofcourse, does not apply for in-situ derivation of re, as in Fig. 14.
Outstanding distinterested writing by the authors describing issues, both above and below! Here the paper has the feel of real science! I’m excited.
Furthermore, the absolute re values that were calculated from the CDP measurements, are typically smaller inFig. 14 than the satellite-derived re shown in Fig. 13. Possible sources for this apparent discrepancy include
1) Our focus was on documenting the evolution of the cloud DSD as it grew and on measuring the formation ofprecipitation embryos and the initiation of effective precipitation.
What is “effective precipitation”?
In addition, we tried to avoid flying higher than ~ 5 km or in heavy precipitation from mature clouds due to flight safety and performance reasons.
F2015 stated that they had targeted growing, “hard-topped” Cumulus, filled with supercooled liquid water that would cause heavy icing on their twin-engine, turboprop Beechcraft King Air C-90 aircraft.
Icing is one of the great dangers of sampling Cumulus congestus clouds at below freezing temperatures. When Cumulus congestus transition to those modest Cumulonimbus clouds of the Mediterranean loaded with ice crystals, the supercooled liquid water disappears and they are virtually harmless to aircraft as an icing threat.
F2015 seem to be indicating that they are unaware of the reduction of icing hazard when this transition to the modest Cumulonimbus clouds, the vast majority are not strong enought to produce lightning. We’re not sure what hazard they could possibly be thinking about.
High ice particle regions of clouds have, as a rule, little icing in them and less turbulence, and MANY in Israel in those low theta-e air masses will be found with tops less than 5 km ASL. In this airborne researcher’s experience in similar clouds in the Washington State coastal waters, such clouds have never posed a hazard to our aircraft except via icing because of sampling too many new turrets too quickly. (Icing buildups can be removed by descending to lower, warmer levels.)
The highlighted sentence is incomprehensible as a reason not to have sampled the maturing and dissipating portions Cumulonimbus clouds in the eastern Med.
This is why our sampling strategy did not cover the area uniformly but instead favored clouds in their early growingstages — unlike the satellite retrieval. The aging of the deep convective clouds allows more time for the collision and coalescence process to produce large droplets and increases the chances for ice formation.Therefore the underrepresentation of the mature clouds in the in-situ measurements and in Fig. 14 reducesthe re values.
Qualifying one’s measurements doesn’t get any better than this! Thank you, authors! Just for the record, this reviewer believes that GN74—written in 1972) represented one of the best examples of objective writing within the often murky domain of weather modification/cloud seeding, where “confirmation bias”, monetary considerations so abound that they deflect true science into something else.
But, this outstanding description begs the question, “How were L929496 able to sample mature, full of ice Israeli clouds, and F2015 were not?” Isn’t the HUJ-CSG more experienced in airborne research? To the cynical, it could look like an excuse not to sample high ice concentrations in even modest Cumulonimbus clouds. Authors: please explain why L929496 was, and you weren’t able to do this.
2) The CDP measures only droplets with a diameter smaller than 50 μm. If larger drops or even small iceparticles are present at the cloud top or slightly below it (or even as a thin cloud layer above it) then thesatellite-derived re might be overestimated Point (1) above also helps explaining why the blue profile in Fig. 13 is deeper than the red profile, but in Fig. 14 it is shallower. We basically stopped climbing when cloud waterwas mostly converted to precipitation or glaciated. This happened on average at a slightly warmer temperature over the sea, and hence the shallower profile in Fig. 14. The clouds over the sea often reached much higher altitudesthan over the Golan Heights (e.g. Fig. 12) due to the more unstable conditions.
To repeat, the situation highlighted is often reversed early winter, and certainly during the spring in major troughs when thunderstorms are as common inland as over the Sea. This needs to be revised to reflect this reality.
The satellite retrievals reflect this, but the in-situ measurements do not because of the sampling strategy
4.3. Formation of hydrometeors
Supercooled cloud water tends to be quite abundant in northern Israeli rain clouds.
F2015 do not provide specific data on this “tends to be abundant” claim anywhere in this paper, nor do they seem to realize that supercooled water is often short-lived in Israeli clouds due to the rapidity of ice formation.
Most of the rain that falls in northern Israel during the winter initiates as mixed phase hydrometeors in clouds withtops that are well above the 0 °C level.
Omit, “well”; “above the 0°C level” is sufficient for the “initiation” of precip. Furthermore, in low stratiform clouds that are thickening upward as an upper trough approaches, drizzle and mist-like rain from warm rain processes are initiated (as was observed on several occasions during the reviewer’s 1986 experiences in Jerusalem). One suspects drizzle will also occur in hill locations in the far north of Israel as well. It seems strange to tell people who live in Jerusalem about this!
This again speaks to the critical importance of having independent ground obs at Mt. Hermon; maybe Har Kana’an, as well.
This has been documented with the help of the CIP that provided 2D images of the hydrometeors in its sampledvolume of cloud/ air. Although the CIP does not allow distinguishing between spherical super-cooled liquid dropsand slightly irregular frozen drops at diameters smaller than ~ 100 μm — due to its 15 μm resolution, riming offrozen drops and graupel particles can be easily identified. These particles provide clear indication of ongoingmixed-phase processes in the clouds. Quantifying the ice content in the cloud with a 2D imaging probe is highly uncertain, however we were still able to see and document the increasing concentrations and sizes of the iceparticles as the clouds matured and the water content decreased.
Here’s what a Droplet Measurement Technologies rep has to say about the “highly uncertain” claim in F2015 concerning its CAPS probe:
“I agree with you that the authors could have reported the ice particle concentrations from the CIP if they wanted to. I see CIP images in Fig 15 (of F2015), so the authors should be able to get particle concentrations. The CIP does report particle concentrations and processing software is capable of producing high quality particle concentrations.”
Doesn’t this make the “highly uncertain” claim in F2015 a falsehood? Its does to this reviewer. But where were the other reviewers, if any, of this article???
The American Meteorological Society (AMS) has recently issued a Monograph (Field et al 2017) focused on secondary ice particles and the efforts to explain them, authored by our leading scientists. Most of the observations discussed in that Monograph are due to measurements with a 2-DC probe!
A possible cynical translation of the HUJ-CSJ “highly uncertain” claim about ice content: “We measured really high ice particle concentrations similar to those of L929496 but we, F2015, wish not to reveal in an article about cloud seeding potential having such high concentrations of ice as we found. We therefore have invoked the excuse that the “mature” clouds of Israel were too dangerous for our aircraft to sample where all that ice was. Its amazing to us that Zev Levin was able to do it!”
2-D artifact reduction: Since the 1970s, there have been ways in software of reducing 2-DC artifacts caused by, say, shattering on probe tips. Indeed, in F2015 they inform us that they used 2-DC probes with “pointy tips” to reduce shattering artifacts. But then they reverse course, and tell us they can’t report what they found with that probe. This is sad, because it appears to be another omission of important data by the HUJ-CSG.
Maybe we shouldn’t be surprised at such an omission, except that it appears in a peer-reviewed journal. What ARreviewers, ad nauseum, allowed an omission of such critical data in an evaluation of cloud seeding potential?
If this type of “editing” of findings in F2015 was what convinced the INWA to proceed with rudimentary operational seeding or “Israeli-4”, then the HUJ-CSG has misled them once again. It is likely, in such an experiment with an unbiased draw, that no statistically-significant results from seeding will accrue (providing the evaluation is conducted by independent non-HUJ statisticians).
Fig. 15 shows some 2D images of the hydrometeors that were observed at different altitudes over the sea on 12 Jan 2012, as an example.
The images are quite nice; shows what we can do today.
However, a series of single strips of hydrometeors chosen by F2015 in Figure 15, does not suffice to prove much. They have omitted (sound familiar?) those images and concentrations of sheaths and needles, those crystal habits that form at temperatures > -10°C which would document the prolific operation of a secondary or other ice particle production mechanism that operates in the clouds of Israel. The aerosol environment of Israel, with its large CCN and often high concentrations of smaller droplets due to pollution in the Hallett-Mossop riming/splintering zone creates the “perfect storm” for ice multiplication in their clouds, as F2015 should know when they cite Mossop (1978).
Figure 15 is not acceptable to this reviewer without extensive 2-D imagery with “best possible” concentrations available online.
The CIP particle size distributions for the same cloud/area were shown in Fig. 11. According to the combinedCDP/CIP particle size distributions, the mode of the cloud DSD reached ~ 20 μm at an elevation of slightly below3000 m. This is also where the CIP water content of ~ 100 μm particles became more significant. Fig. 15 showsthat these precipitation embryos are spherical, i.e. probably still in the liquid phase, although the temperature isclose to − 8 °C. The LWC at that elevation reached 1.6 g m-3 and there was no indication for ice. Higher up inthe cloud the particles became even larger and started having a more irregular shape. The irregular particles seenat temperatures warmer than − 5 °C are not likely to have frozen at the observed elevation, but rather have fallen from above while riming smaller particles. This leads to another small mode in the far right of the CIP size distribution (Fig. 11) rather than a more continuous decline in LWC with increasing particle diameter in the CIP range.
Documenting a similar process of cloud droplet growth, the formation of precipitation embryos and theirfreezing over the Golan Heights was much more challenging due to a number of reasons. It was difficult to follow the same cloud element through
its lifetime due to the more orographic nature and layered structure of the clouds.
The authors recover from the omissions discussed previously and write an outstanding couple of qualifying sentences, the type that normally accompany a great science piece! I’m excited again!
And even if distinct convective cloud tops were identified, they often quickly drifted eastwards into Syria, where itwas not possible flying to. The impression was that often the clouds there would consist only of supercooled waterwith no precipitation, unless having embedded convection or ice particles falling from above.
The above is good, and the use of the word, “impression” makes it even better. Thank you authors!
Fig. 16 presents the profile of the concentrations of hydrometeors with diameter greater than 100 μm in clouds over the Sea and the Golan Heights — as measured by the CIP. It is based on the same 15 flights used forthe analysis in Fig. 14 and both figures have some common features. As with the cloud droplet effective radius,the concentrations of the large hydrometeors increase with decreasing temperatures in the developing convectiveclouds over the sea. This is because as the cloud grows and its top becomes colder, the cloud droplets and the hydrometeors that do not fall become larger, and also because the freezing of the largest droplets, which may push them over the 100 μm cutoff size used in Fig. 16, is more likely.
The statistics of the hydrometeor concentration over the Golan Heights, on the other hand, shows a maximumconcentration between − 5 and − 10 °C, with median concentrations close to 10 L-1. The inclusion of cloud layers with colder bases, smaller droplets and less LWC might explain the decreasing hydrometeor concentrations atcolder temperatures over the Golan Heights. This might not, however, explain the finding that the CIP concentrations inthe − 5 to − 10 °C temperature band are considerably higher over the Golan Heights than over the sea.
This doesn’t make sense. The reality would be just the opposite if they had been more adventurous with their aircraft sampling in the Med. The reason for the lower concentrations in the -5° to -10°C temperature range over the Mediterranean where ice multiplication is rampant, compared to those concentrations found in the Golan, is the sampling by F2015 of young, newly risen, “hard” turrets before the ice explosion occurs over the Med.
It is worth noting that the temperature of maximum hydrometeor concentration over the Golan Heights coincideswith the activation temperature of the silver-iodide which was released upwind during most of the sampling.
WHY would one sample, at great operating cost, clouds when seeding was underway upwind??? Isn’t that a waste of precious INWA resources? Was this unintentional? Are there no data from your flights that were gathered in the Golan without seeding taking place? Did you measure ice nucleus concentrations, ones that could have alerted you to this problem? This, unfortunately, raises the issue of incompetence unless there were mitigating circumstances.
It is also close to the temperature of maximum Hallet–Mossop ice multiplication rates, which may be suppressed instrong convection (over the sea) due to relatively short residence time of the graupel in the optimal temperature band for ice splinter production (Hallett and Mossop 1974).
Suppressed H-M process? This is non-sense. Gimmee your plane! These authors need to go outside and watch there incoming Cumulus congestus clouds as they convert to ice (and small Cumulonimbus clouds) within minutes after reaching very much above the -5°C level. With proper aircraft sampling, the authors would have found a ton of H-M generated (and/or that by other processes) ice crystals (needles and sheaths) in the temperature zone (-3° to -10°C) where H-M-produced ice can reside (as at Mt. Hermon on many occasions).
One wonders why the analysis goes so badly here? Who was directing the aircraft? Who wrote this segment?
But this process may be enhanced by the embedded convection that often occurs over the Golan Heights. Thisis because the mixing of the convective cloud element with the stratiform cloud with a colder base, can result in abroad, or even bi-modal, droplet size distribution, which is favorable for ice splintering (Mossop, 1978). It is notpossible, however, to quantify the relative contribution of each factor to the observed hydrometeor concentrationswithout a very detailed case by case analysis, because the variation from cloud to cloud, and even within a cloud is rather high.
Send me the videos from these flights, your ice and droplet concentrations and spectra, and I promise to help you understand what you did! Better yet, give me your research aircraft for the month of January and we will find some ice, and some new findings commensurate with those of L929496.
4.4. Availability of supercooled cloud water
The supercooled liquid water content of the clouds over the Mediterranean Sea and over the Golan Heights, atdifferent temperatures, is presented in Fig. 17. The water content was integrated over the binned CDP data and, ifnecessary, slightly adjusted to match the measured content of the Hot-wire probes. Fig. 17 is based on the samedataset as Figs. 14 and 16. Note that the abscissa in Fig. 17 is in the log-space due to the large possible variationin LWC. At the initial stages, as the clouds develop, their tops get cooler and the LWC values increase bothover the Mediterranean Sea and over the Golan Heights. At − 4 °C, 25% of the measurements that were taken over the Golan Heights had a LWC greater than 0.4 g m− 3, while over the Mediterranean Sea that number, at thesame temperature, was slightly smaller.
As the authors noted previously, they don’t know what happened to the LWC in the clouds at the upwind side of the Golan because it went over toward Syria. That should be re-iterated here, lest the AR reader be misled by the F2015 claim that this is unambiguously potential water for seeding purposes. That potential remains to be seen without more comprehensive measurements, such as ground measurements of ice crystal concentrations, habits, riming characteristics at the top of Mt. Hermon, which is often in the H-M temperature zone during precip events in Israel.
Mt. Hermon crystal data would make a stupendous paper of itself. But could we trust the HUJ-CSG, with so much seeding baggage, to do it objectively? I really don’t think so. What a shame that a “senior” researcher, who is extremely familiar the output of the HUJ-CSG over several decades, feels this way.
Further up the LWC values over the Golan Heights started decreasing, while the LWC over the sea continued toincrease as the cloud tops developed further.
As mentioned in Sections 3.3 and 4.2, the sampling strategy over the Mediterranean Sea and over the Golan Heights was often different because of the different typical cloud structure/ dynamics as well as flight safetyrestrictions. While over the sea “hard” tops of deep convective clouds were more abundant and favored, over theGolan Heights the maneuvering was more restricted and the sampling covered the area more homogeneously.
Here and below, the authors divulge critical pieces of information about sampling that represents the highest form of objective, scientific writing for their readers!
Preferential sampling of developing cloud tops with relatively little history of mixing over sea, versus measuring mostly orographic layer clouds over the Golan Heights, can explain the greater LWC values over the sea and the positive trend all the way up. More than half of the samples over the sea at a temperature around − 16 °C had a LWC greater than 1 g m− 3.
The quote above about 1 gm m-3 at -16°C concerns liquid water that would be very short-lived, indeed, as I believe the authors know, or should know. Would it last at that level even five minutes in a Langrangian sense? Give me your research plane and we will see!
The likely explanation for the LWC “bump” only over the Golan Heights is the sampling of cloud layers withbases at colder lower temperatures and hence reduced LWC. As Fig. 3 illustrates, the clouds over the Golan Heights tend to have a structure of layers (on the days that we chose to sample on) and a more homogeneouscoverage of the area would include sampling of those layer clouds. This explanation is supported by Fig. 14, asnew high cloud layers that are separated from the clouds below, are expected not only to have low values of LWC,but also small re (Fig. 14). The LWC in those elevated cloud layers would increase little with height due to the coldlow temperatures, but re might increase rapidly due to the low concentration of CCN and hence also cloud droplets, even in the undiluted parts of the clouds.
This doesn’t make any sense to this reader; “re might increase rapidly..” Where?
Another possible contributor to the changing trend of LWC over the Golan Heights at temperatures below − 8 °C is the conversion of liquid cloud water into ice (which is not measured by the CDP or by the Hot-wires). Theconcentrations of the hydrometeors (Fig. 16) are at maximum at that temperature and that might not be justcoincidence — as discussed in Section 4.3. In order to determine the causes and the effects of the observedrelations, as well as the contributions of the seeding operations versus the natural processes, other methods arerequired.
Again, why spend so much on research targeting natural clouds when seeding is going on? Its crazy.
So, within the scope of this study, it is practically impossible to quantify the relative impacts of the explanationsabove to the observed different trend of LWC versus the temperature over the sea and over the Golan Heights without analyzing a larger dataset and a more dedicated planning and filtering.
Yes! Thank you, authors, for this candid assessment. I would love to take part in those additional studies! “Call me!” Furthermore, having a senior researcher as a kind of “Resident Skeptic” would improve the credibility of future HUJ-CSG publications.
However, despite the reduction in LWC with altitude, and regardless of its true explanation, there are still non-negligible amounts of super-cooled LWC over the Golan Heights.
The end result of the supercooled water they observed at the upwind side of the Golan is not known. Caution is advised in what to make of this statement.
As far as cloud seeding is concerned, the relevant question is the precipitation efficiency of the orographiclayer clouds. Obviously, this type of cloud is inexistent over sea.
Fig. 18 provides the probability distribution and the cumulative distribution function of the supercooled water content over the (upwind side of the) Golan Heights at temperatures colder lower than − 8 °C.
You can’t emphasize the sampling bias contained in Figure 18 enough; otherwise it will likely mislead the INWA or other organizations into funding cloud seeding with no real return, as we saw the HUJ-CSG caused the INWA to do in the past at great expense to the people of Israel.
While some of the water might have been converted to ice due to the seeding operations, the remaining liquid water might mark the potential of additional precipitation enhancement. It shows that 55% of the measurements in theclouds had less than 0.2 g m-3 of super-cooled water, but it means that 45% had more. 20% of the data had morethan 0.5 and ~ 4% even more than 1.0 g m-3 of liquid water with a potential to freeze with silver-iodide.
This sentence is lacking the very nice qualifiers you incorporated in this piece at other points. Were these questionable portions written by only one of the authors? One wonders. But, unless the writing is partitioned in a footnote, all of the writers are responsible for a paper’s content.
Since the flight pattern over the Golan Heights was more or less fixed, this represents the true areal fractional coverage of these clouds during the flights there. Therefore, this represents significant amount of super-cooled cloud water and indicates that ice nuclei may still be a limiting factor in the conversion of LWC into ice and further toprecipitation. So there might be room for extending the seeding efforts that target the clouds over the Golan Heights torealize more of their seeding potential.
- Summary and conclusions
A key factor that determines the seeding potential of the clouds is the quantity of super-cooled water in the clouds, the time that the water droplets remain in the super-cooled region and the temperatures at which supercooled waterpersists.
Add this sentence after, “persists”: “We were unable to do all the necessary maneuvers to establish these parameters.” ( It doesn’t mean you failed….)
More super-cooled water, longer time and colder lower temperatures, all lead to greater seeding potential as there is a possibility to convert more of the super-cooled water into ice and precipitation.
After analyzing 27 research flights during four rainy seasons (2009–2013) we see that although the naturalprocesses of converting cloud water into precipitation is often quite efficient,
Yep.
there are still occasions with good potential for precipitation augmentation by glaciogenic cloud seeding.
Remains to be seen. “Good” potential was not demonstrated in this paper. There were too many unanswered questions. This sentence appears to have been written for funders, not for those of us senior researchers who know the paper trail of the HUJ-CSG literature well. One wonders how F2015, who wrote so eloquently about the drawbacks of this study, and the questions that remain, could have written this sentence? Here the questioning and objectivity have disappeared.
One natural seeding process is the hygroscopic seeding by the abundance of sea salt aerosols in the boundarylayer close to the coast due to the strong winds and rough seas. Another natural seeding process is called the“seeder–feeder” mechanism, where hydrometeors from more mature and higher clouds fall through the clouds atlower levels and collect or rime their water content.
In this scenario, there well might be an underlying, shallow orographic Stratocumulus layer that is present before the rainy/icy complex of Cbs arrive. If precipitation is falling over mesoscale regions, downdrafts can be present that weaken of dissipate the lower Stratocu layer as the complex barges into the hill regions and the Golan. This is a reviewer speculation; I just don’t think we have enough information to know what exactly happens, how much supercooled water there is when weakening Cb clusters/lines organized by upper troughs arrive in the northern mountains. Observations at Mt. Hermon, to repeat, are critical in answering this question.
The results of this study have been already applied for the design of the Israel-4 cloud seeding experiment.
I find this statement sad, because this study/proposal was not reviewed properly, and those who assembled it have so much cloud seeding baggage, as is demonstrated in this review. I feel sorry, too, for the Israeli people who paid millions based on prior faulty interpretations of cloud seeding results and seeding potential based on fictitious cloud descriptions. The HUJ-CSG for too long has prospered on the backs of the Israeli people with their biased, self-serving presentations of clouds and seeding potential.
Finally, why wasn’t I sent this manuscript in the first place? One of the authors, DR, knows I am “above ground”, and I do not oppose seeding in proper circumstances. I do know Israeli clouds pretty well….
This was done by an addition of an eastern seeding line for targeting the clouds developing over the Golan Heights and by positioning the ground generators accordingly. The main objective of the Israeli rain enhancementprogram is to increase the amount of water that reaches the Sea of Galilee, therefore adding an eastern seedingline contributes to fulfilling this objective in four ways: 1) The Golan Heights contribute most of the water to the Sea of Galilee; 2) The clouds over the Golan Heights typically undergo less natural seeding by mature cloudsand sea spray;
There is quite a bit of conjecture in item 2. This study didn’t quantify how much “less natural seeding by mature clouds” happens in the Golan. Such a study would take several winters in this reviewer’s opinion, of combined satellite andsurface observations, and many more flights than in this study. To repeat, such a study shouldn’t be done by the HUJ-CSG for the highest credibility. They had their chances over so many years to get it right, and couldn’t do it.
Cloud tops are colder in extreme northern Israel and offshore region compared with those areas to the south (GN74; RH95) as noted. Decreased cloud top temperatures lead to more ice and deeper clouds. Presumably more Cbs, organized by troughs and by the Cypress low, would move onshore and into the Golan in most rainy day situations. Whether the underlying orographic forcing would supply enough water for seeding purposes in the context of these mesoscale systems remains unknown.
3) The clouds over the Golan Heights occasionally have relatively high concentrations of supercooled water attemperatures in which silver iodide can serve as efficient ice nuclei;
Add this qualifying sentence: “Due to flight limitations, it is not known whether this liquid water persists long enough to be a viable seeding target.”
4) There is a greater seeding potential for the less convective clouds (King and Ryan, 1997), such as thoseclouds over the Golan Heights.
Who knows? Don’t count on it, Israel. Be cautious.
A further indication of citation sloppiness, and a poor manuscript review of this article; “King and Ryan” should be Ryan and King (1997).
This whole article has degraded AR in my opinion.
The Israel-4 randomized seeding experiment started in November 2013. The expected duration of theexperiment is about 6 winters, during which the randomized seeding will be done in the same consistent way, and further accompanied by the cloud physics measurements by aircraft and satellites.
Acknowledgements
This study was funded by the Israeli water authority for supporting the rain enhancement project.
Very sad to read that this article, or some other version of it in a proposal, led to INWA to seed operationally or otherwise. Doesn’t the INWA have any cloud expertise within it, or consultants to rely on? It doesn’t seem like it.
Nevertheless, the INWA is to be admired and congratulated for having the wisdom to do a randomized experiment even if deemed premature, rather than just initiate another operational seeding project, while asserting to its public, with little evidence, that rain is being increased. It doesn’t happen in the US!
REFERENCES
Alpert, P., Halfon, N., and Levin, Z.. 2008: Does air pollution really suppress precipitation in Israel? J. Appl. Meteor. and Climate, 47, 933-943
Altaratz, O., Levin, Z., Yair, Y., Ziv, B., 2003. Lightning Activity over Land and Sea on the Eastern Coast of theMediterranean. Mon. Weather Rev. 131, 2060–2070
American Meteorological Society, 1984: Statement on planned and inadvertent weather modification. Bull. Amer. Meteor. Soc., 65, 1322.
Baumgardner, D., Jonssonc, H., Dawsona, W., O’Connor, D., Newtona, R., 2000.
The cloud, aerosol and precipitation spectrometer: a new instrument for cloud investigations. Atmos. Res., 59,251–264.
Brier, G. W., and I. Enger, 1952: An analysis of the results of the 1951 cloud seeding operations in central Arizona. Bull. Amer. Meteor. Soc., 23, 208-210.
Ben-Zvi, A., Rosenfeld, D., Givati, A., 2011 Comment on “Reassessment of rain experiments and operations in Israel including synoptic considerations” by Zev Levin, Noam Halfon and Pinhas Alpert [Atmos. Res. 97 (2010)513–525]. Atmos. Res. 99, 590–592.
Blyth, A., and Latham, J., 1998: Comments on cumulus glaciation papers of P. V. Hobbs and A. L. Rangno. Quart. J. Roy. Meteorol. Soc., 124, 1007-1008.
Cunningham, R. M., 1957: A discussion of generating cell observations with respect to the existence of freezing or sublimation nuclei. In Artificial Stimulation of Rain, H. Weickmann, Ed. Pergamon Press, NY., 267-270.
Dennis, A. S., 1980: Weather Modification by Cloud Seeding. Academic Press, NY, 145.
Dennis, A. S., 1989: Editorial to the A. Gagin Memorial Issue of the J. Appl. Meteor., 28, 1013.
Druyan, L. M., and Sant, Y., 1978: Objective 12 h forecasts using a single rawinsonde. Bull. Amer. Meteor. Soc., 59, 1438-1441.
Field, P., Lawson, P., Brown, R. A., Lloyd, G., Westbrook, C., ,e D. Moiseev, D., Miltenberger, A., A. Nenes, A., Blyth, A., Choularton, T., Connolly. P., Buehl, J., Crosier, J., Cui, Z., Dearden, C., DeMott, P., Flossmann, A., Heymsfield, A., Huang, Y., Kalesse, H., KANJI, Z. A., Korolev, A., Kirschgaessner, A., Lasher-Trapp, S., T. Leisner, T., McFarquhar, G., , Phillips, V., , J. Stith, J., Sullivan, S., 2017: Secondary Ice Production: Current State of the Science and Recommendations for the Future. Amer. Meteorol. Soc., Monograph, 58, 7.01 – 7.20. DOI: 10.1175/AMSMONOGRAPHS-D-16-0014.1
Freud, E., Rosenfeld, D., 2012. Linear relation between convective cloud drop number concentration and depth forrain initiation. J. Geophys. Res. 117, D02207. http://dx.doi.org/10.1029/2011JD016457.
Freud, E., Rosenfeld, D., Andreae, M.O., Costa, A.A., Artaxo, P., 2008. Robust relations between CCN and the vertical evolution of cloud drop size distribution in deep convective clouds. Atmos. Chem. Phys. 8, 1661–1675.
Freud, E., Rosenfeld, D., Kulkarni, J.R., 2011. Resolving both entrainment-mixing and number of activated CCN in deep convective clouds. Atmos. Chem. Phys. 11, 12887–12900. http://dx.doi.org/10.5194/acp-11-12887-2011.
Freud, E., Koussevitsky, H., Goren, T., and Rosenfeld, D., 2015: Cloud microphysical background for the Israeli-4 cloud seeding experiment, Atmos. Res., 158-159, 122-138. doi.org/10.1016/j.atmosres.2015.02.007
Gabriel, K. R., 1967: The Israeli artificial rainfall stimulation experiment: statistical evaluation for the period, 1961–1965. Proceedings, Fifth Berkeley Symposium on Mathematical Statistics and Probability, Vol. 5, L. M. LeCam and J. Neyman, eds., University of California Press, 91–113
Gabriel, K.R., Rosenfeld, D., 1990. The second Israeli rainfall stimulation experiment: Analysis of precipitation onboth targets. J. Appl. Meteorol. 29, 1055–1067.
Gagin, A., 1975: The ice phase in winter continental cumulus clouds. J. Atmos. Sci., 32, 1604–1614.
Gagin, A, 1980: The relationship between the depth of cumuliform clouds and their raindrop characteristics. J. Res. Atmos., 14, 409-422.
Gagin, A, 1981: The Israeli rainfall enhancement experiments. A physical overview. J. Wea. Modif., 13, 108-120.
Gagin, A, 1986: Evaluation of “static” and “dynamic” seeding concepts through analyses of Israeli II and FACE-2 experiments. In Precipitation Enhancement–A Scientific Challenge, Meteor. Monog., 21, No. 43, Amer. Meteor. Soc., 63-70.
Gagin, A., Neumann, J., 1974. Rain stimulation and cloud physics in Israel. In: Hess, W.N. (Ed.), Weather andClimate Modification. John Wiley and Sons, pp. 454–494
Gagin, A., and J. Neumann, 1976: The second Israeli cloud seeding experiment–the effect of seeding on varying cloud populations. Proc. II WMO Sci. Conf. Weather Modification, Boulder, WMO Geneva, 195-204.
Gagin, A., Neumann, J., 1981. The second Israeli randomized cloud seeding experiment: Evaluation of the results.J. Appl. Meteorol. 20, 1301–1311.
Givati, A., Rosenfeld, D., 2005. Separation between cloud-seeding and air- pollution effects. J. Appl. Meteorol. 44,1298–1314.
Givati, A., Rosenfeld, D., 2009. Comments on “Does air pollution really suppress
precipitation in Israel?”. J. Appl. Meteorol. Climatol. 48, 1733–1750.
Givati, A., Steinberg, D., Binyamini, Y., Glick, N., Rosenfeld, D., Shamir, U., Ziv, B.,
- 2013. The Precipitation Enhancement Project: Israel-4 Experiment (טקיורפ רטמה תרבגה: לארשי יוסינ 4). The WaterAuthority, State of Israel, 55.
Goldreich, Y., 2003. The climate of Israel, observations, research and applications. Kluwer Academic/Plenum Publ, New York, NY, p. 298.
Halfon, N., Z. Levin, P. Alpert, 2009: Temporal rainfall fluctuations in Israel and their possible link to urban and air pollution effects. Environ, Res. Lett., 4, 12pp. doi:10.1088/1748-9326/4/2/025001
Hallett, J., and Mossop, S.C., 1974. Production of secondary ice particles during the riming process. Nature 249, 26–28.
Hering, S.V., Stolzenburg, M.R., Quant, F.R., Oberreit, D.R., Keady, P.B., 2005. A laminar-flow, water-basedcondensation particle counter (WCPC). Aerosol Sci. Technol. 39, 659–672.
Herut, B., Starinsky, A., Katz, A., Rosenfeld, D., 2000. Relationship between the conditions along a transition zonebetween large deserts and Mediterranean climate, Israel. Atmos. Environ. 34, 1281–1292.
Hobbs, P. V., and Rangno, A. L., 1978: A reanalysis of the Skagit cloud seeding project. J. Appl. Meteor., 17, 1661–1666.
Hobbs, P. V., and Rangno, A. L., 1985: Ice particle concentrations in clouds. J. Atmos. Sci., 36, 2523-2549.
Hobbs, P. V., and Rangno, A. L., 1998: ‘Reply to “Comments by Alan M. Blyth and John Latham on ‘Cumulus glaciation papers by P. V. Hobbs and A. L. Rangno. Quart. J. Roy. Meteorol. Soc., 124, 1009-1011.
Hobbs, P. V., Lyons, J. H., Locatelli, J. D., Biswas, K. R., Radke, L. F., Weiss, R. W., Sr., and Rangno, A. L., 1981: Radar detection of cloud-seeding effects. Science, 213, 1250-1252.
Kennedy, D., 2003: Research fraud and public policy. Science, 300, 393.
Kennedy, D., 2004: The old file drawer problem. Science, 305, 451.
Kerr, R. A., 1982: Cloud seeding: one success in 35 years. Science, 217, 519–522.
Kessler, A., A. Cohen, D. Sharon, 2002: Interim analysis of the cloud seeding in Northern Israel. A report submitted to the Israel Hydrology Institute and the Israel Water Management of the Ministry of Infrastructure, In Hebrew.
Kessler, A., Cohen, A., Sharon, D., 2006: Analysis of the cloud seeding in Northern Israel. A report submitted to the Israel Hydrology Institute and the Israel Water Management of the Ministry of Infrastructure, In Hebrew. 117pp.
Lahav, R., Rosenfeld, D., 2000. Microphysics characterization of the Israeli clouds from aircraft and satellites.Proceedings of the 13th International Conference on Clouds and Precipitation, pp. 732–735.
Lance, S., Nenes, A., Medina, J., Smith, J.N., 2006. Mapping the operation of the DMT continuous flow CCN counter. Aerosol Sci. Technol. 40, 242–254.
Lance, S., Brock, C.A., Rogers, D., Gordon, J.A., 2010. Water droplet calibration of the Cloud Droplet Probe (CDP) and in-flight performance in liquid, ice and mixed-phase clouds during ARCPAC. Atmos. Meas. Tech. 3, 1683–1706.
Lensky, I.M., Rosenfeld, D., 2006. The time-space exchangeability of satellite retrieved relations between cloud toptemperature and particle effective radius. Atmos. Chem. Phys. 6, 2887–2894.
Levi, Y., Rosenfeld, D., 1996. Ice nuclei, raiINWAter chemical composition, and static cloud seeding effects in Israel.J. Appl. Meteorol. 35, 1494–1501.
Levin, Z., 1992: The role of large aerosols in the precipitation of the eastern Mediterranean. Paper presented at the Workshop on Cloud Microphysics and Applications to Global Change, Toronto. (Available from Dept. Atmos. Sci., University of Tel Aviv).
Levin, Z., 1994: The effects of aerosol composition on the development of rain in the eastern Mediterranean. WMO Workshop on Cloud Microstructure and Applications to Global Change, Toronto, Ontario, Canada. World Meteor. Org., 115-120.
Levin, Z., Ganor, E., Gladstein, V., 1996. The effects of desert particles coated with sulfate on rain formation in theeastern Mediterranean. J. Appl. Meteorol. 35, 1511–1523.
Levin, Z., Kirchak, S. O., and Reisen, T., 1997: Numerical simulation of dispersal of inert seeding material in Israel using a three-dimensional mesoscale model. J. Appl. Meteor., 36, 474-484.
Levin, Z., Halfon, N., Alpert, P., 2010. Reassessment of rain enhancement experiments and operations in Israelincluding synoptic considerations. Atmos. Res. 97, 513–525.
Levin, Z., N. Halfon, and P. Alpert, 2011: Reply to comments by Ben-Zvi, A., D. Rosenfeld and A. Givati on the paper: Levin, Z., N. Halfon and P. Alpert, “Reassessment of rain experiments and operations in Israel including synoptic considerations.” . Atmos. Res., 98, 593-596.
List, R., Gabriel, K. R., Silverman, B. A., Levin, Z., Karacostas, T., 1999: The Rain Enhancement Experiment in Puglia, Italy: Statistical Evaluation. J. Appl. Meteorol., 38, 281-289.
Marshak, A., Platnick, S., Várnai, T., Wen, G., Cahalan, R.F., 2006. Impact of three‐
dimensional radiative effects on satellite retrievals of cloud droplet sizes. J. Geophys. Res. 111, 1984–2012.
Mason, B. J., 1980: A review of three long-term cloud-seeding experiments. Meteor. Mag., 109, 335-344.
Mason, B. J.,, 1982: Personal Reflections on 35 Years of Cloud Seeding. Contemp. Phys., 23, 311-327.
Mielke, P. W., Jr., 1979: Comment on field experimentation in weather modification. J. Amer. Statist. Assoc., 74, 87-88.
Mossop, S. C., 1970: Concentrations of ice crystals in clouds. Bull. Amer. Meteor. Soc., 51, 474-479.
Mossop, S.C., 1978. The influence of drop size distribution on the production of secondary ice particles during graupelgrowth. Q. J. R. Meteorol. Soc. 104, 323–330.
Mossop, S. C., 1985: The origin and concentration of ice crystals in clouds. Bull. Amer. Meteor. Soc., 66, 264-273.
Mossop, S.C., Hallett, J., Hallet, J., and Mossop, S. C., 1974. Ice crystal concentration in cumulus clouds: Influence ofthe drop spectrum. Science 186, 632–634.
National Research Council-National Academy of Sciences, 1973: Weather Modification: Progress and Problems. T. F. Malone, ed., 258 pp. (Available from the National Research Council, Washington, D. C.)
Nirel, R.,, and D. Rosenfeld, 1994: The third Israeli rain enhancement experiment-An intermediate analysis. Proc. Sixth WMO Scientific Conf. on Weather Modification, Paestum, Italy, World Meteor. Org., 569-572.
Neumann, J., 1951: Land breezes and nocturnal thunderstorms. J. Meteor., 8, 60-67.
Neumann, J., Gabriel, K. R., and Gagin, A., 1967: Cloud seeding and cloud physics in Israel: results and problems. Proc. Intern. Conf. on Water for Peace. Water for Peace, Vol. 2, 375-388.
Pitter, R. L., and H. R. Pruppacher,1973: A wind tunnel investigation of freezing of small water drops falling at terminal velocity in air. Quart. J. Roy. Met. Soc., 99, 540-550.
Rangno, A. L., 1979. A reanalysis of the Wolf Creek Pass cloud seeding experiment. J. Appl. Meteor., 18, 579–605.
Rangno, A. L., 1988: Rain from clouds with tops warmer than -10 C in Israel. Quart J. Roy. Meteorol. Soc., 114, 495-513.
Rangno, A. L., and Hobbs, P.V.,. 1991: Ice particle concentrations and precipitation development in small polar maritime cumuliform clouds. Quart. J. Roy. Met. Soc., 117, 207-241.
Rangno, A. L., and Hobbs, P.V., 1993: Further analyses of the Climax cloud-seeding experiments. J. Appl. Meteor., 32, 1837-1847.
Rangno, A.L., Robbs Hobbs, P.V., 1995. A new look at the Israeli cloud seeding experiments. J. Appl. Meteorol. 34,1169–1193.
Rangno, A. L., and Hobbs, P. V., 1997: Comprehensive Reply to Rosenfeld, Cloud and Aerosol Research Group, Department of Atmospheric Sciences, University of Washington, 25pp. (Available at http://carg.atmos.washington.edu/)
Rauber, R. M., and Tokay, A., 1991: An explanation of supercooled water at the top of cold clouds. J. Atmos. Sci., 48, 1005-1023.
Rosenfeld, D., 1980: Characteristics of Rain Cloud Systems in Israel Derived from Radar and Satellite Images. M. S. Thesis, The Hebrew University of Jerusalem, 129pp. (Available from the Department of Meteorology, Hebrew University of Jerusalem, Jerusalem, Israel) in Hebrew, no translation yet.
Rosenfeld, D., 1997: Comment on “A new look at the Israeli Cloud Seeding Experiments”, J. Appl. Meteor., 36, 260-271.
Rosenfeld, D., 1998. The third Israeli randomized cloud seeding experiment in the south: evaluation of the results and review of all three experiments. Preprints, 14th Conf. on Planned and Inadvertent Wea. Modif., Everett, Amer. Meteor. Soc. 565-568.
Rosenfeld, D., Farbstein, H., 1992. Possible influence of desert dust on seedability of clouds in Israel. J. Appl. Meteorol. 31, 722–731.
Rosenfeld, D., Givati, A., 2005. Evidence of orographic precipitation suppression by air pollution induced aerosols in the western U.S. J. Appl. Meteorol. Climatol. 45, 893–911.
Rosenfeld, D., Gutman, G., 1994. Retrieving microphysical properties near the tops of potential rain clouds by multispectral analysis of AVHRR data. Atmos. Res. 34, 259–283.
Rosenfeld, D., Lensky, I.M., 1998. Satellite-based insights into precipitation formation processes in continental andmaritime convective clouds. Bull. Am. Meteorol. Soc. 79, 2457–2476.
Rosenfeld, D., Nirel, R., 1996. Seeding effectiveness — the interaction of desert
dust and the southern margins of rain cloud systems in Israel. J. Appl. Meteorol. 35, 1502–1510.
Rosenfeld, D., Rudich, Y. and Lahav, R., 2001: Desert dust suppressing precipitation: a possible desertification feedback loop. PNAS, 98, 5975-5980. doi/ 10.1073/ pnas.101122798
Rosenfeld, D., Liu, G., Yu, X., Zhu, Y., Dai, J., Xu, X., Yue, Z., 2014. High resolution (375 m) cloud microstructure asseen from the NPP/VIIRS Satellite imager. Atmos. Chem. Phys. 14, 2479–2496. http://dx.doi.org/10.5194/acp-14-2479-2014.
Ryan, B.F, King, W.D., 1997. A Critical Review of the Australian Experience in
Cloud Seeding. Bull. Am. Meteorol. Soc. 78, 239–254.
Schaefer, V. A., 1946: The production of ice crystals in a cloud of supercooled water droplets. Science, 104, 457-459.
Schemenauer, R. S., and Isaac, G. A., 1984: The importance of cloud top lifetime in the description of natural cloud characteristics. J. Climate Appl. Meteor., 23, 267-279.
Schultz, D., 2015. Eloquent Science. American Meteorol. Soc., 412pp.
Sharon, D., A. Kessler, A. Cohen, and E. Doveh, 2008: The history and recent revision of Israel’s cloud seeding program. Isr. J. Earth Sci., 57, 65-69.
Silverman, B. A., 2001. A critical assessment of glaciogenic seeding of convective clouds for rainfall enhancement. Bull. Am. Meteor. Soc., 82, 903-924.
Tan, W., Yin, Y., Chen, K., Chen, J., 2010. An experimental study of aerosol particles using PCASP-X2 andWPS™. Geoscience and Remote Sensing (IITA-GRS), 2010 Second IITA International Conference on vol. 1. IEEE, pp. 586–589.
Thom, H. C. S., 1957: An evaluation of a series of orographic cloud seeding operations. Final Report of the Advisory Committee on Weather Control, Vol. II, Government Printing Office, 25-49.
Tukey, . Brillinger, D. R., and Jones, L. V., 1978b: Report of the Statistical Task Force to the Weather Modification Advisory Board, Vol. II. U. S. Government Printing Office, pE-3.
Vali, G., 1971: Quantitative evaluation of experimental results on the heterogeneous freezing nucleation of supercooled liquids. J. Atmos. Sci., 28, 402-409.
Woodcock, A. H., 1953: Salt nuclei in marine air as a function of altitude and wind force. J. Meteor., 10, 362-371.
Woodcock, A. H., Duce, R. A., and Moyers, J. L., 1971. Salt and raindrops in Hawaii. J. Atmos. Sci., 28. 1252-1257.
Woodley, W. L., and D. Rosenfeld, 2002: Comments on “A critical assessment of glaciogenic seeding of convective clouds for rainfall enhancement.” Bull. Amer.Meteor. Soc., 83, 739–740.
World Meteorological Society, 1992: Statement on the Status of Weather Modification.
Wurtele, Z. S., 1971: Analysis of the Israeli cloud seeding experiment by means of concomitant meteorological variables. J. Appl. Meteor., 10, 1185-1192.
Young, K., 1993: Microphysical Processes in Clouds. Oxford University Press, pp427.
Reviewer “baggage” module: bio, a priori convictions, and a little about the reviewer’s 1986 11-week cloud investigation in Israel
Background: Chased storms, cloud photographer.
I have worked on both sides of the seeding fence, having participated in operational seeding projects in South Dakota twice, India, Washington State, and in the Sierras of California. I was a forecaster for the Colorado River Basin Pilot Project (CRBPP), a large, multi-million dollar advanced randomized cloud seeding experiment in Colorado from 1970-1975. Beginning in 1976, I worked in airborne studies of clouds and the origin of ice in clouds in the University of Washington’s Cloud and Aerosol Research Group for the 28 years. I was a “flight scientist” for NCAR during the 2006-07 winter during their Saudi Arabia cloud seeding potential study.
A priori convictions concerning cloud seeding:
Cloud seeding works in limited situations, principally via the seeding of non-precipitating, supercooled clouds (e.g. Hobbs et al 1981, an experiment suggested by the reviewer; “wonderful experimentation”). Whether there is economically viable return from such seeding, I don’t know. I begin every talk I give with, “Cloud seeding works!”, and show a couple of examples of effects of seeding (those resembling Schaefer’s dry ice seeding experiments in 1947)
Motivation for this review:
The review of F2015 was motivated by the absence of post-publication comments on F2015 over the past three years. And it comes from the emotional reaction after I read it recently for the first time: “Someone has to do something about this!”, the very same feeling I had before I went to Israel in 1986 as a skeptic of ripe-for-seeding cloud claims emanating from the HUJ-CSG. (That same emotional reaction first happened during the CRBPP which led to a “career” of own-time scrutiny of suspect cloud seeding publications (e.g., Rangno 1979).
The 1986 Israel cloud investigation
At the end of 1985 I resigned my job with the Cloud and Aerosol Research Group over issues of credit, and went to Israel in early January 1986 to investigate their clouds[1]. I was skeptical that those many descriptions of them in the peer-reviewed literature and in conference presentations were correct. I did not go to Israel without “baggage,” but had done a considerable amount of “homework.”
A note-sized paper asserting that the Israeli clouds were not as they were being described in journal articles and elsewhere, had been rejected in 1983 (B. Silverman, Ed., J. Appl. Meteor., personal communication).
That rejection was instrumental in my 1986 trip.
The several reviewers’ negative takes on my 1983 “Comment”, including that of the leader of the HUJ-CSG at that time who lectured me in person at the 1984 Park City weather mod conference about how wrong I was about his clouds, had no effect whatsoever about what I thought about them. He had also been a reviewer of that “Comment.”
To repeat, I had done my homework, plotted numerous soundings when rain was falling at launch time or within the hour at Beirut and Bet Dagan, and had scrutinized all of the HUJ-CSG cloud reports in great detail. Even the daily rainfall in the Israel Meteorological Service (IMS) monthly weather reports indicated something was terribly wrong with clouds that were being described as highly inefficient rain producers.
While in Israel in 1986, that same leader of the HUJ-CSG prevented this writer from visiting the HUJ-CSG-controlled radars to evaluate cloud top heights during rain spells. I wanted to see what top heights were, and indirectly via IMS rawinsonde soundings, obtain top temperatures. (The HUJ-CSG leader, “AG,” did allow a brief “show and tell” visit to his Ben Gurion AP radar in February as a storm approached[2] as part of our third and last meeting in February 1986.)
To disallow a bona fide worker in the field of cloud microstructure and weather modification access to data/measurements to test claims about the Israeli clouds was demonstrable scientific misconduct IMO[3]. The clouds of Israel can only be studied in Israel, and as scientists we must be open to cross-checking of our results; having our findings tested. It’s what we do in science (e.g., see Blyth and Latham’s 1998 criticisms of the glaciation papers of Hobbs and Rangno and our Reply (Hobbs and Rangno 1998) as a great example of open criticism).
But this was not what the leader of the Israeli experiments understood about science. If he was deluded about his clouds, or was correct about them, I would have been welcomed, I thought. If he had “contrary knowledge”, I would be blocked. Q. E. D.
My findings (R88), in lieu of radar data, were based on Israel Meteorological Service’s (IMS) four-times-a-day rawinsondes, and were published in 1988. They strongly suggested that there was a serious problem with the HUJ-CSG’s ultra “ripe-for-seeding” cloud descriptions. Rosenfeld and Farbstein (1992) within the HUJ-CSG, belatedly discovered that “dust-haze” when present, apparently produced efficiently raining clouds in Israel, findings that supported R88. Dust-haze has been around for quite awhile in Israel.
Later independent aircraft reports by Tel Aviv University (Levin 1992, 1994, Levin et al. 1996, hereafter L929496) also supported R88 and further exposed the faults in the HUJ-CSG cloud descriptions.
Today, and at last in F2015, the HUJ-CSG finally acknowledges, implicitly, why the leader of the Israeli experiments refused this visitor access to radars in 1986: the high precipitating efficiency of Israeli clouds was going to be obvious in radar cloud top imagery.[4] F2015 offers additional confirmation of those long ago findings in R88. Lahav and Rosenfeld (2000), and Rosenfeld et al. 2001 had also found unsuitable clouds for seeding, but did not state that as explicitly as did F2015, or only alluded to “some clouds.”
Too, the high precipitation efficiency of Israeli clouds, too, is not limited to “dust-haze”; it never was. The belief that the Rosenfeld and Farbstein (1992) attribution of “divergent seeding effects” to dust-haze was unreliable was the “acorn” of conviction that led to the “oak” of RH95.[5]
Rather than “dust-haze, that high efficiency is due relatively low droplet concentrations in Mediterranean clouds moving into Israel. Larger droplets in clouds accelerate the formation of precipitation via several processes.
End of “baggage” module.
[1] Done on “own time, own dime”; not on grant monies. I went to Israel in 1986 after I became convinced that the cloud reports by the HUJ-CSG were in substantial error and that the people of Israel were likely paying for the seeding of unsuitable clouds: “Someone has to do something about this!” It was a “do-gooder” thought, and felt I COULD do something about it due to my background in airborne studies in the Cloud and Aerosol Research Group at the U of Washington, as a weather forecaster, as a storm chaser, and as a cloud photographer. I spent 11 weeks in Israel watching the clouds and storms and working within the IMS. I lived off my savings ($$$$) the rest of 1986 after I left Israel while preparing the manuscript that became R88. It was submitted to the QJ in January 1987. “Quasi-altruistic”? Yep. I wanted to also demonstrate that I was the BEST at “outing” bogus cloud seeding work that none of my gullible peers suspected, to be completely candid. Yes, it was a little megalomaniacal…
[2]Marked by a mid-level overcast of Altostratus and some lower Altocumulus with dust.
[3] After being asked to leave the offices of the HUJ-CSJ and not come back at the end of my 2nd meeting with AG in Janaury, I wrote to several scientists around the world about that event. Those I wrote to were: P. V. Hobbs and Lawrence F. Radke, University of Washington; Gabor Vali, University of Wyoming; Roscoe Braham, Jr., North Carolina State University; and S. C. Mossop, CSIRO, Australia.
[4] Those within the HUJ-SU had about ten years of viewing and recording storms on their Enterprise 5-cm radar by the time of my 1986 visit. Was no one “minding the store”?
[5] Also done on “own time, own dime”; not on grant monies. Crackpot alert?
[1] As experienced in this writer’s 11-week stay in 1986, events in which embedded, much taller clouds sprang forth as the upper trough approached.
[1]Not cited by the HUJ-CSU in this paper. We expect studies that offer counter views to F2015 findings not to be cited by them at this point. Perhaps they are taught that at the HUJ? HUJ, are you listening?
[2] The reviewer believes that it is critical that the INWA or other organization certify that the list of random decisions provided prior to each season for Israeli 2 by statistician Ehud Shimbursky are, in fact, the ones that were used in Israeli 2. This reviewer is doubtful, to add yet another layer of darkness to this analysis. It’s just too tempting for those in the cloud seeding realm to say that, “Yes, we seeded that heavy rainstorm.”
[3]The authors omit the indication of the remarkable biased random draw of Israeli 2 experiment in which the rain in the south target was “statistically significant” in terms of standard error from average amounts on rain days (Gabriel and Rosenfeld 1990).
[4] Also from Gabriel and Rosenfeld (1990): “The easiest explanation is to ascribe everything to chance, and accept H00 (the null hypothesis) . But the majority of the analyses run counter to this simplistic summary. Most of the evidence favors a positive effect of seeding in the north, and there is more evidence for a negative effect in the south than for a zero effect.” This interpretation no longer holds water.
[5] The random draw for Israeli 2 was much different than for Israeli 1. In Israeli 1 (1961-1965 daily randomization period), there were few consecutive draws of the same sign (13%) of the total of draws (Gabriel 1967, Table II). In Israeli 2, consecutive draws of the SAME sign predominated (58%). The list of random days for Israeli 2 was provided to Peter Hobbs in 1983 by A. Gagin. Further investigation will likely find that this is the root cause of the lopsided draw in Israeli 2.
[6] From the Weather Modification Association’s Code of Ethics: “Falsification: changing or not reporting appropriate data or results (i.e. the purposeful omission of conflicting data or information with the intent to falsify results; deceptive selective reporting). Isn’t that the purpose of “one-sided” citing as well? Of note: The American Meteorological Society does not have a Code of Ethics, but rather “suggestions” or “guidelines” for professional conduct.
[7] See the discussion of operational seeding below for details.
[8] Sound familiar? We repeat the WMA Code point for your consideration: falsification: changing or not reporting appropriate data or results(i.e. the purposeful omission of conflicting data or information with the intent to falsify results; deceptive selective reporting).
[9] We can only imagine how these results would have been spun around if this had been a suggestion of an 8% increase in rain. How many statistical tests would be tried? Would the authors really just say, “inconclusive”?
[10] Sharon et al (2008), and the reports that it was distilled from (Kessler et al. 2002, 2006), are nowhere to be seen in the HUJ-SU authors’ paper. Should we be surprised at this point? I don’t think so. This is not science as we know it. HUJ, are you listening?
[11] While the original INWA program was terminated, some additional experimental-operational seeding did carry on, beginning with the 2007-08 rain season; it was terminated again in 2013 (according to F2015). The reviewer does not yet know the details to the “supplemental” seeding following the termination in 2007.
[12] Alpert et al 2008 and Halfon et al 2009, and the exchange between Givati and Rosenfeld, also go uncited, strengthening a pattern of deception by the HUJ-SU; such actions by the authors that can no longer be attributed to oversights, but are meant to keep the ARreaders in the dark about the quality of the HUJ-CSG research.
[13] “Cast of thousands!” (except me..)
[1] Retiree, Cloud and Aerosol Research Group, Atmos. Sci. Dept., University of Washington, Seattle, 1976-2006.
[2] I dedicate this review to Jerzy Neyman, whom I greatly admired for his careful and voluminous criticisms of papers in the cloud seeding arena; to K. Ruben Gabriel, who was able to “stay above the fray” as a careful and objective statistician for the Israeli experiments, and lastly to Karl Rosner, Mekoroth’s Chief Meteorologist for Israeli 1 and 2, for his ability to remain objective within the “halls of seeding.”
[3] The great Nobel Laureate, Irving Langmuir, comes to mind, who once bitten by AgI, believed that any rainfall event could be explained by cloud seeding had there been any, no matter how large or far away from the release the event was.
[4] The above provocative conclusion comes from someone who has followed the HUJ-CSG reports over the past 35 years or so; is it me or them?
[5] The reviewer is not and has never been a faculty member at a university and therefore can raise such an issue with impunity unlike those with faculty status due to the “live and let live” de facto rules of the “faculty club.”
[6] This was the last mention of a numerical result of seeding in the south target of Israeli 2.
[7] The several IMS forecasters I spoke with when I worked within the Israel Meteorological Service (IMS) in 1986 were well aware of the “efficiency” that Israeli clouds exhibited. One stated, “We get good rains out of clouds with tops at -10°C.”
[8] It had to be done by an outsider.
[9] Width (and implicitly, cloud top lifetime) has a direct bearing on the production of precipitation (e.g., Schemenaur and Isaac 1984; Rangno and Hobbs 1991.
[10]Whom also goes uncited (strangely) since one of the authors of F2015 (DR) commented on his BAMS cloud seeding review. Small-mindedness here as well? Or is it the desire by the authors to hide alternative views from their funders and journal readers?
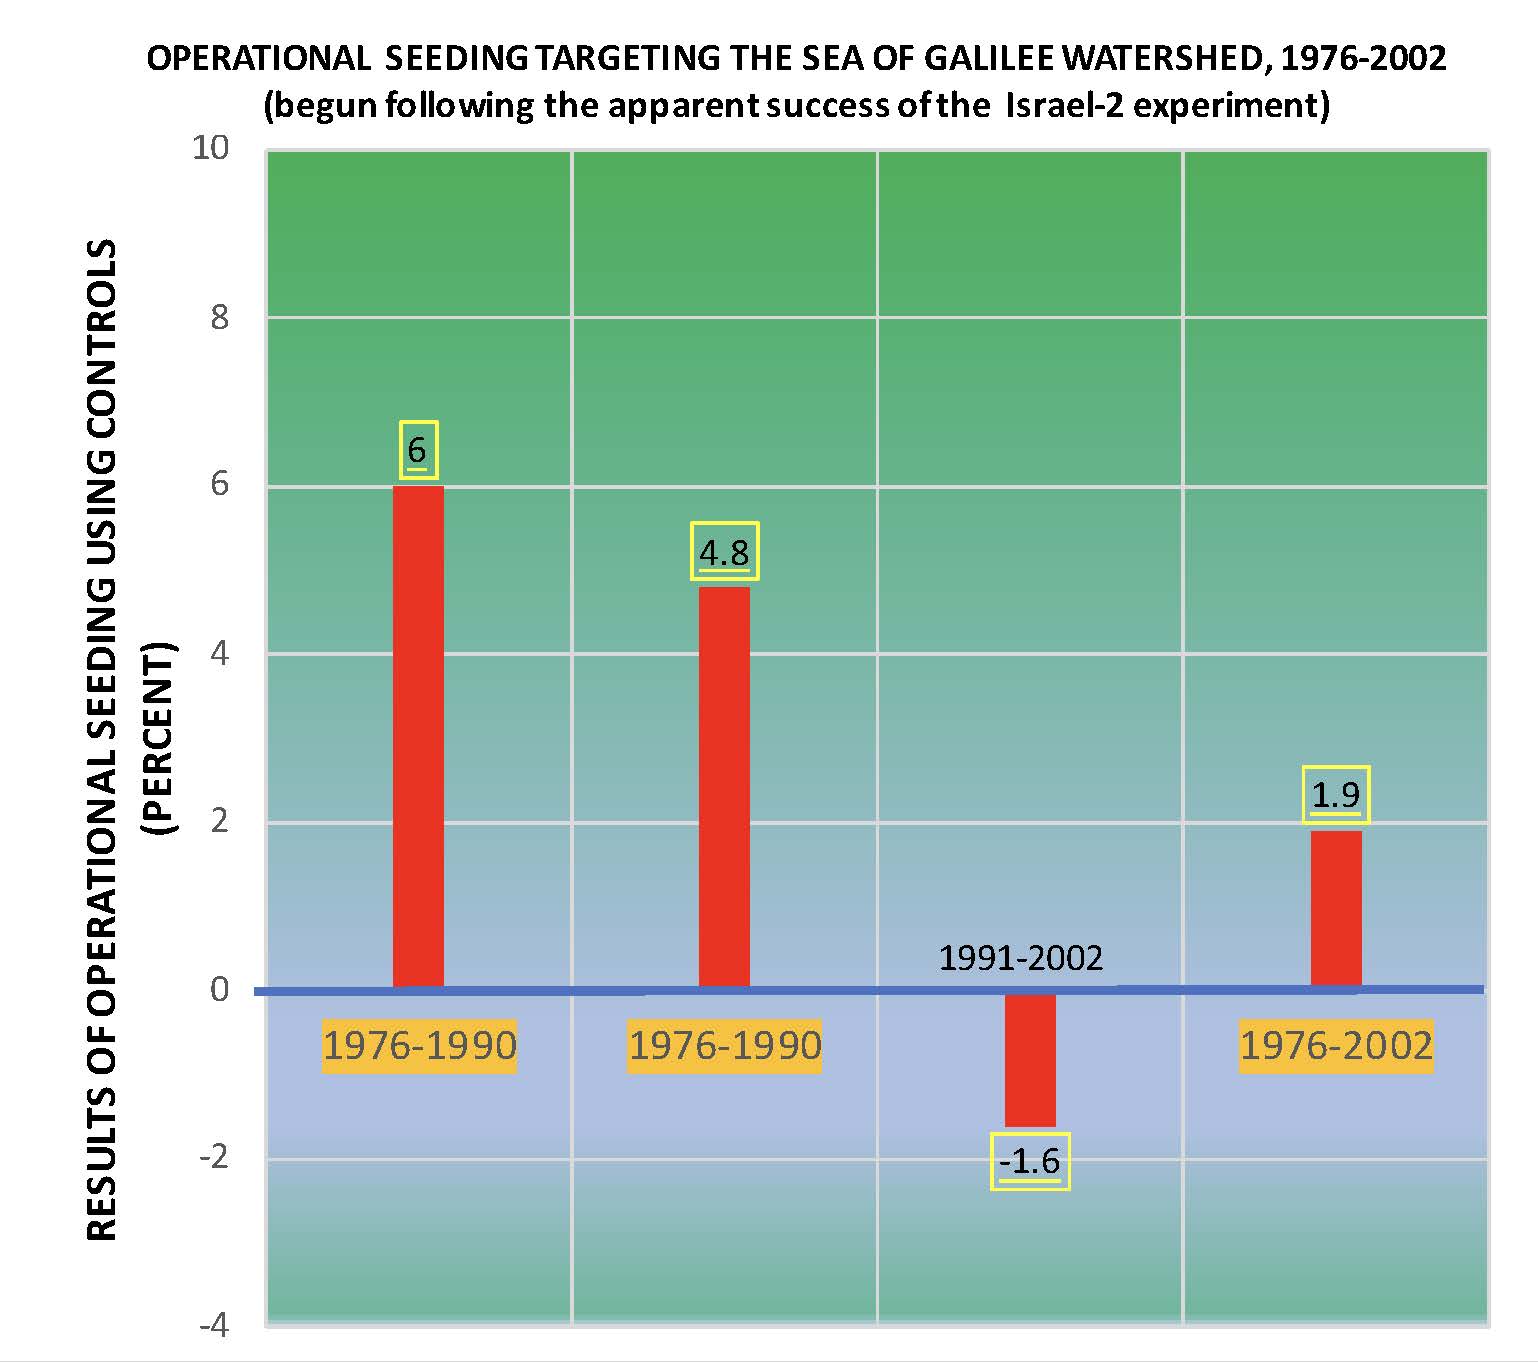
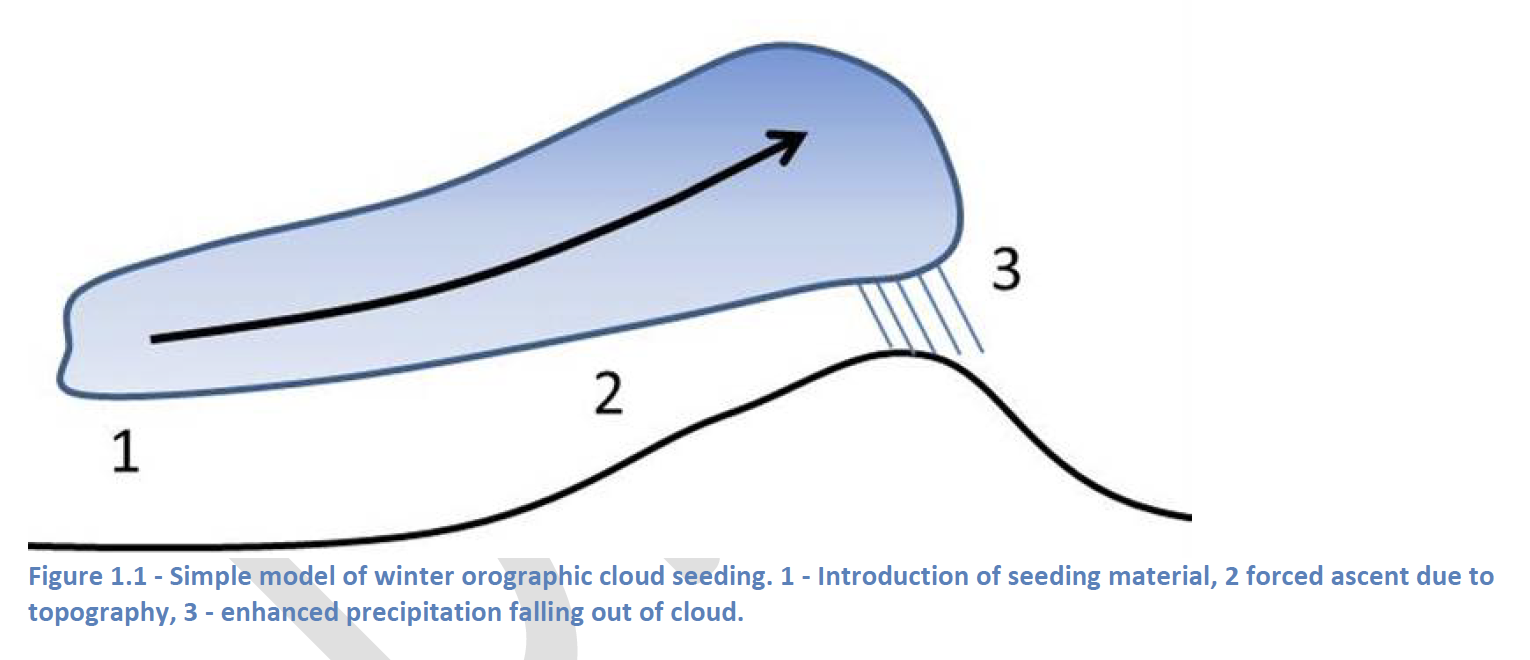
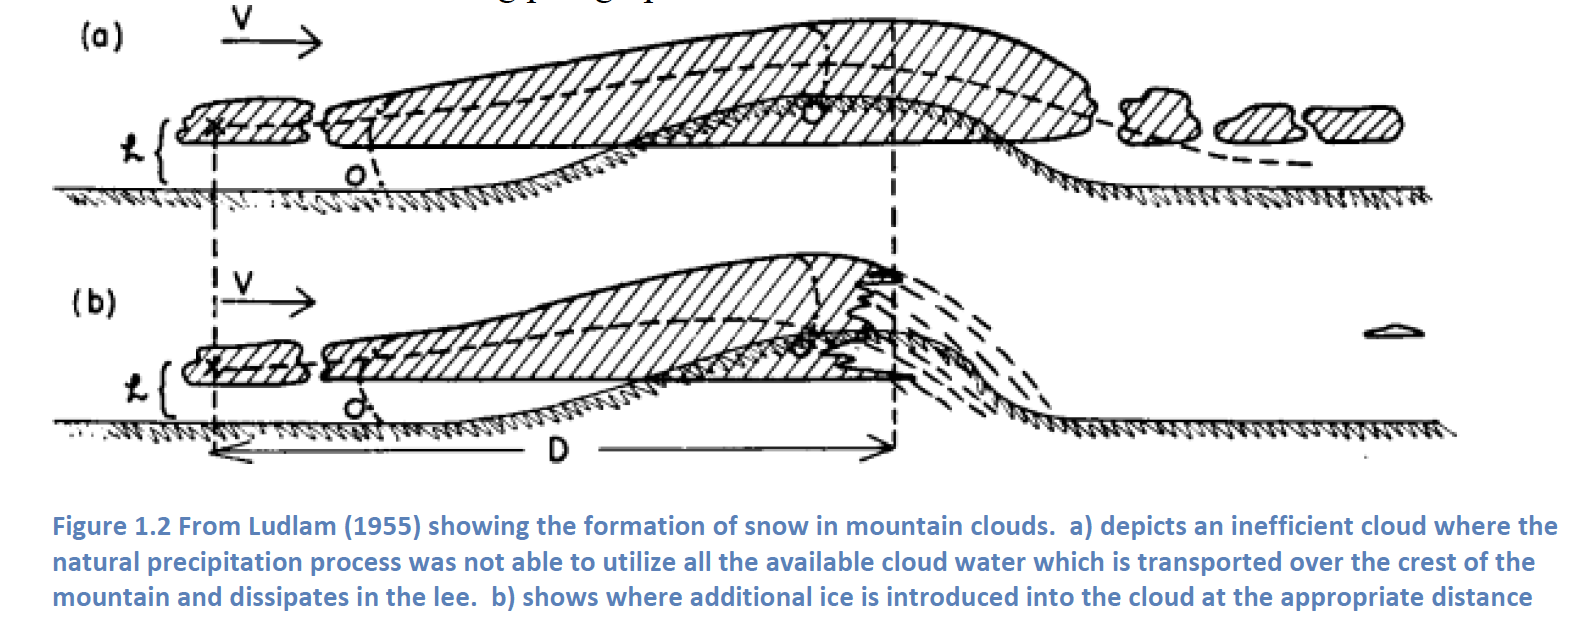
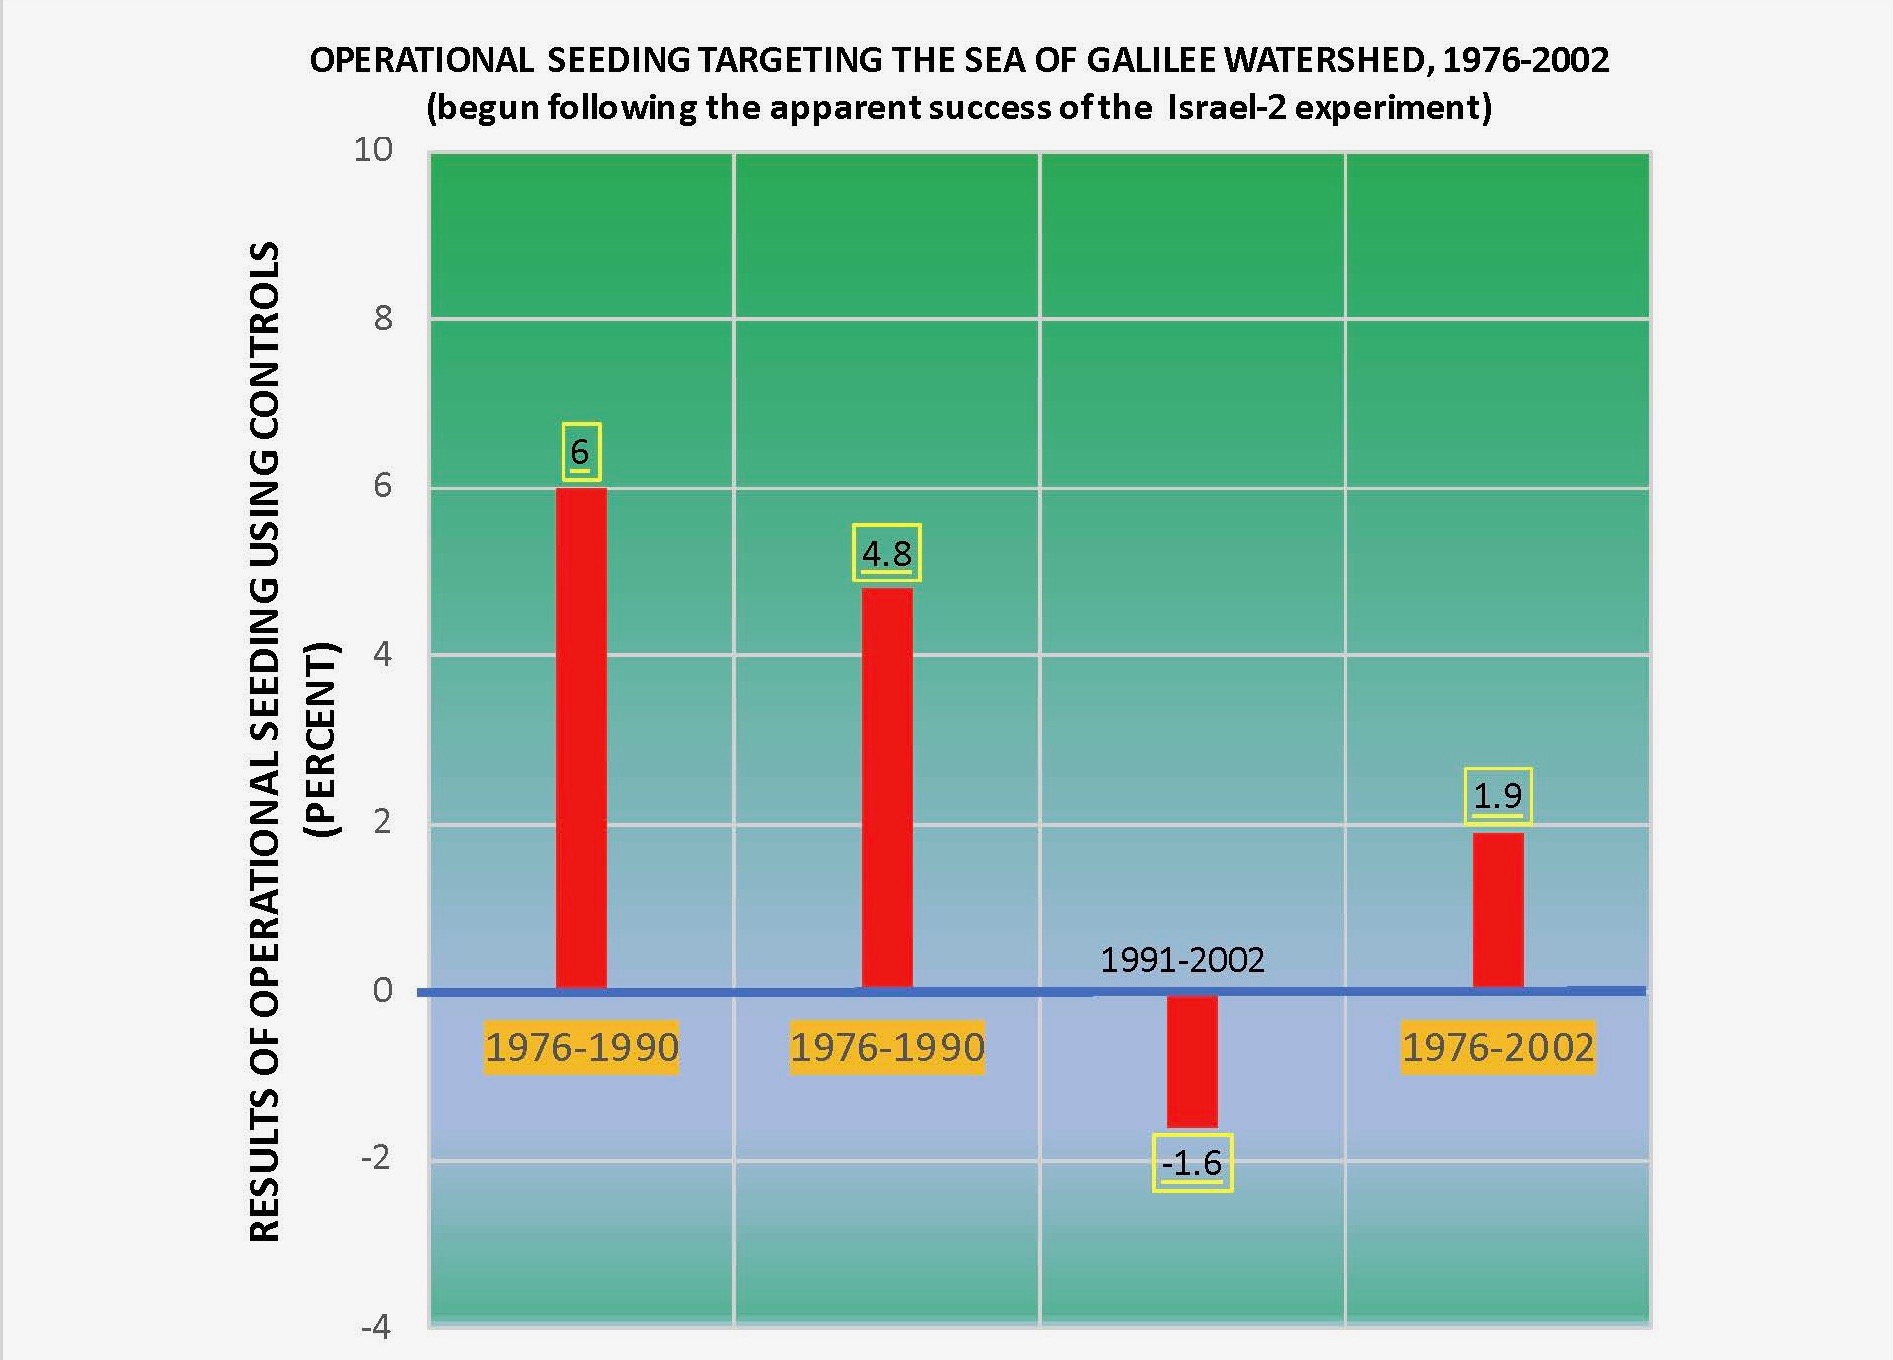


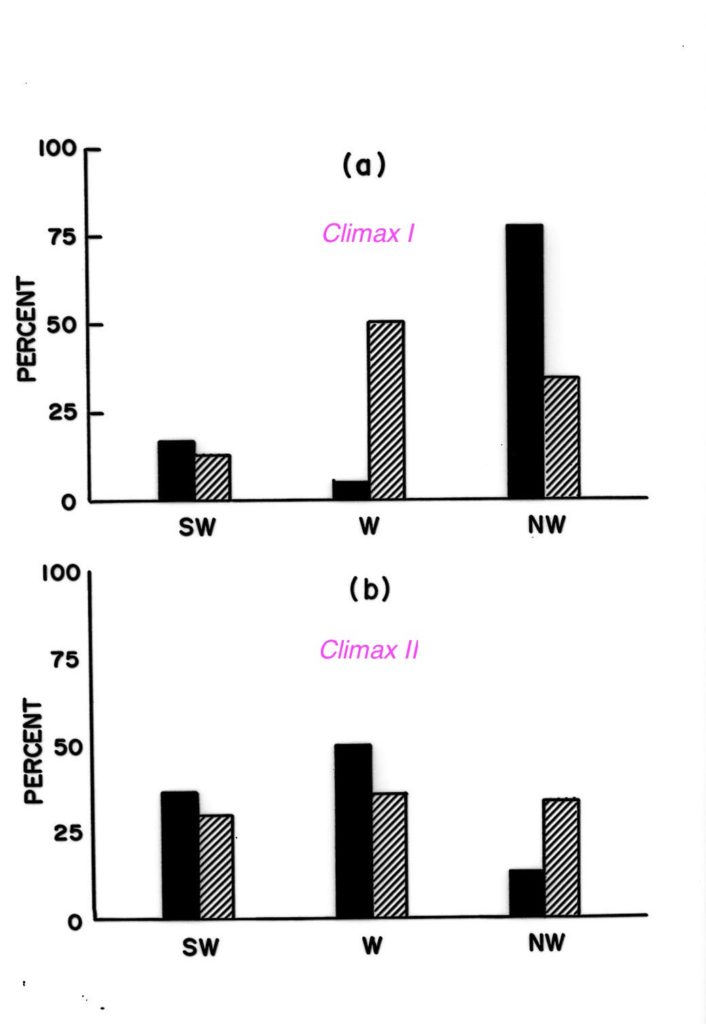

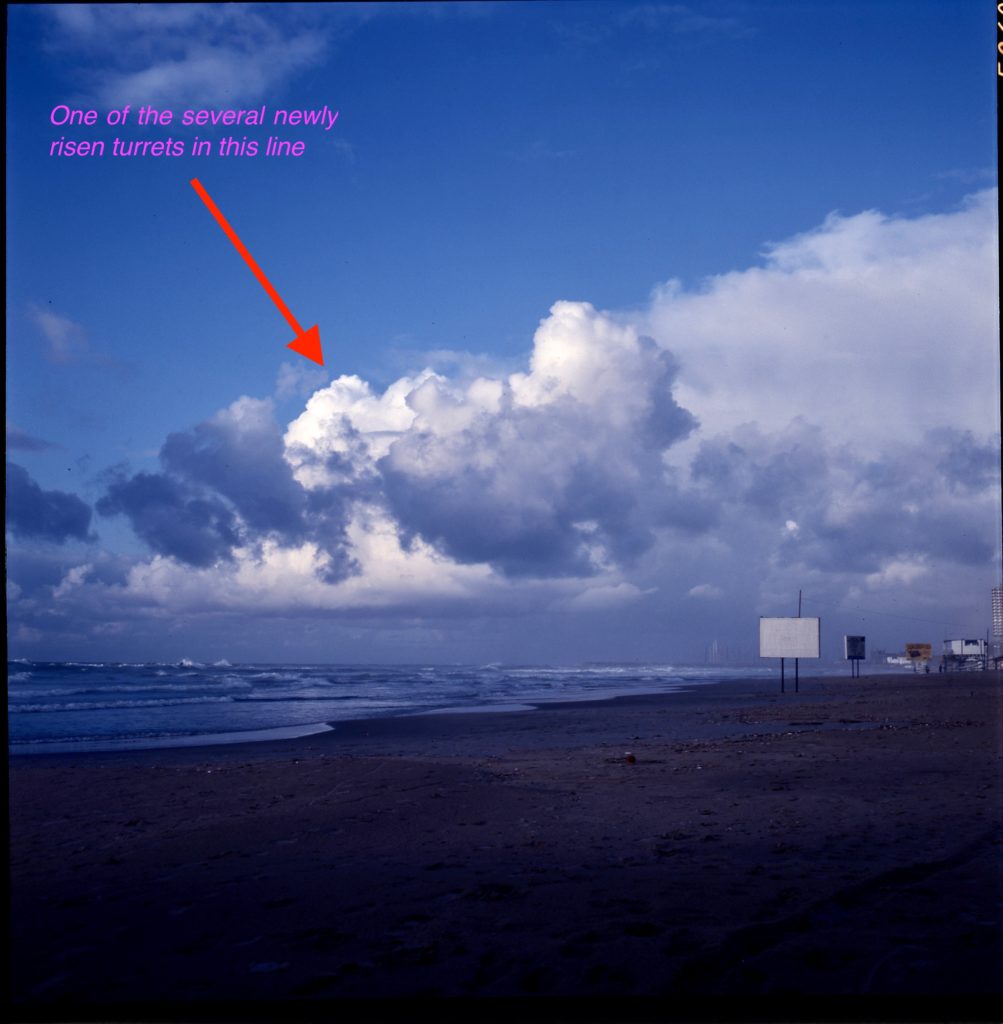

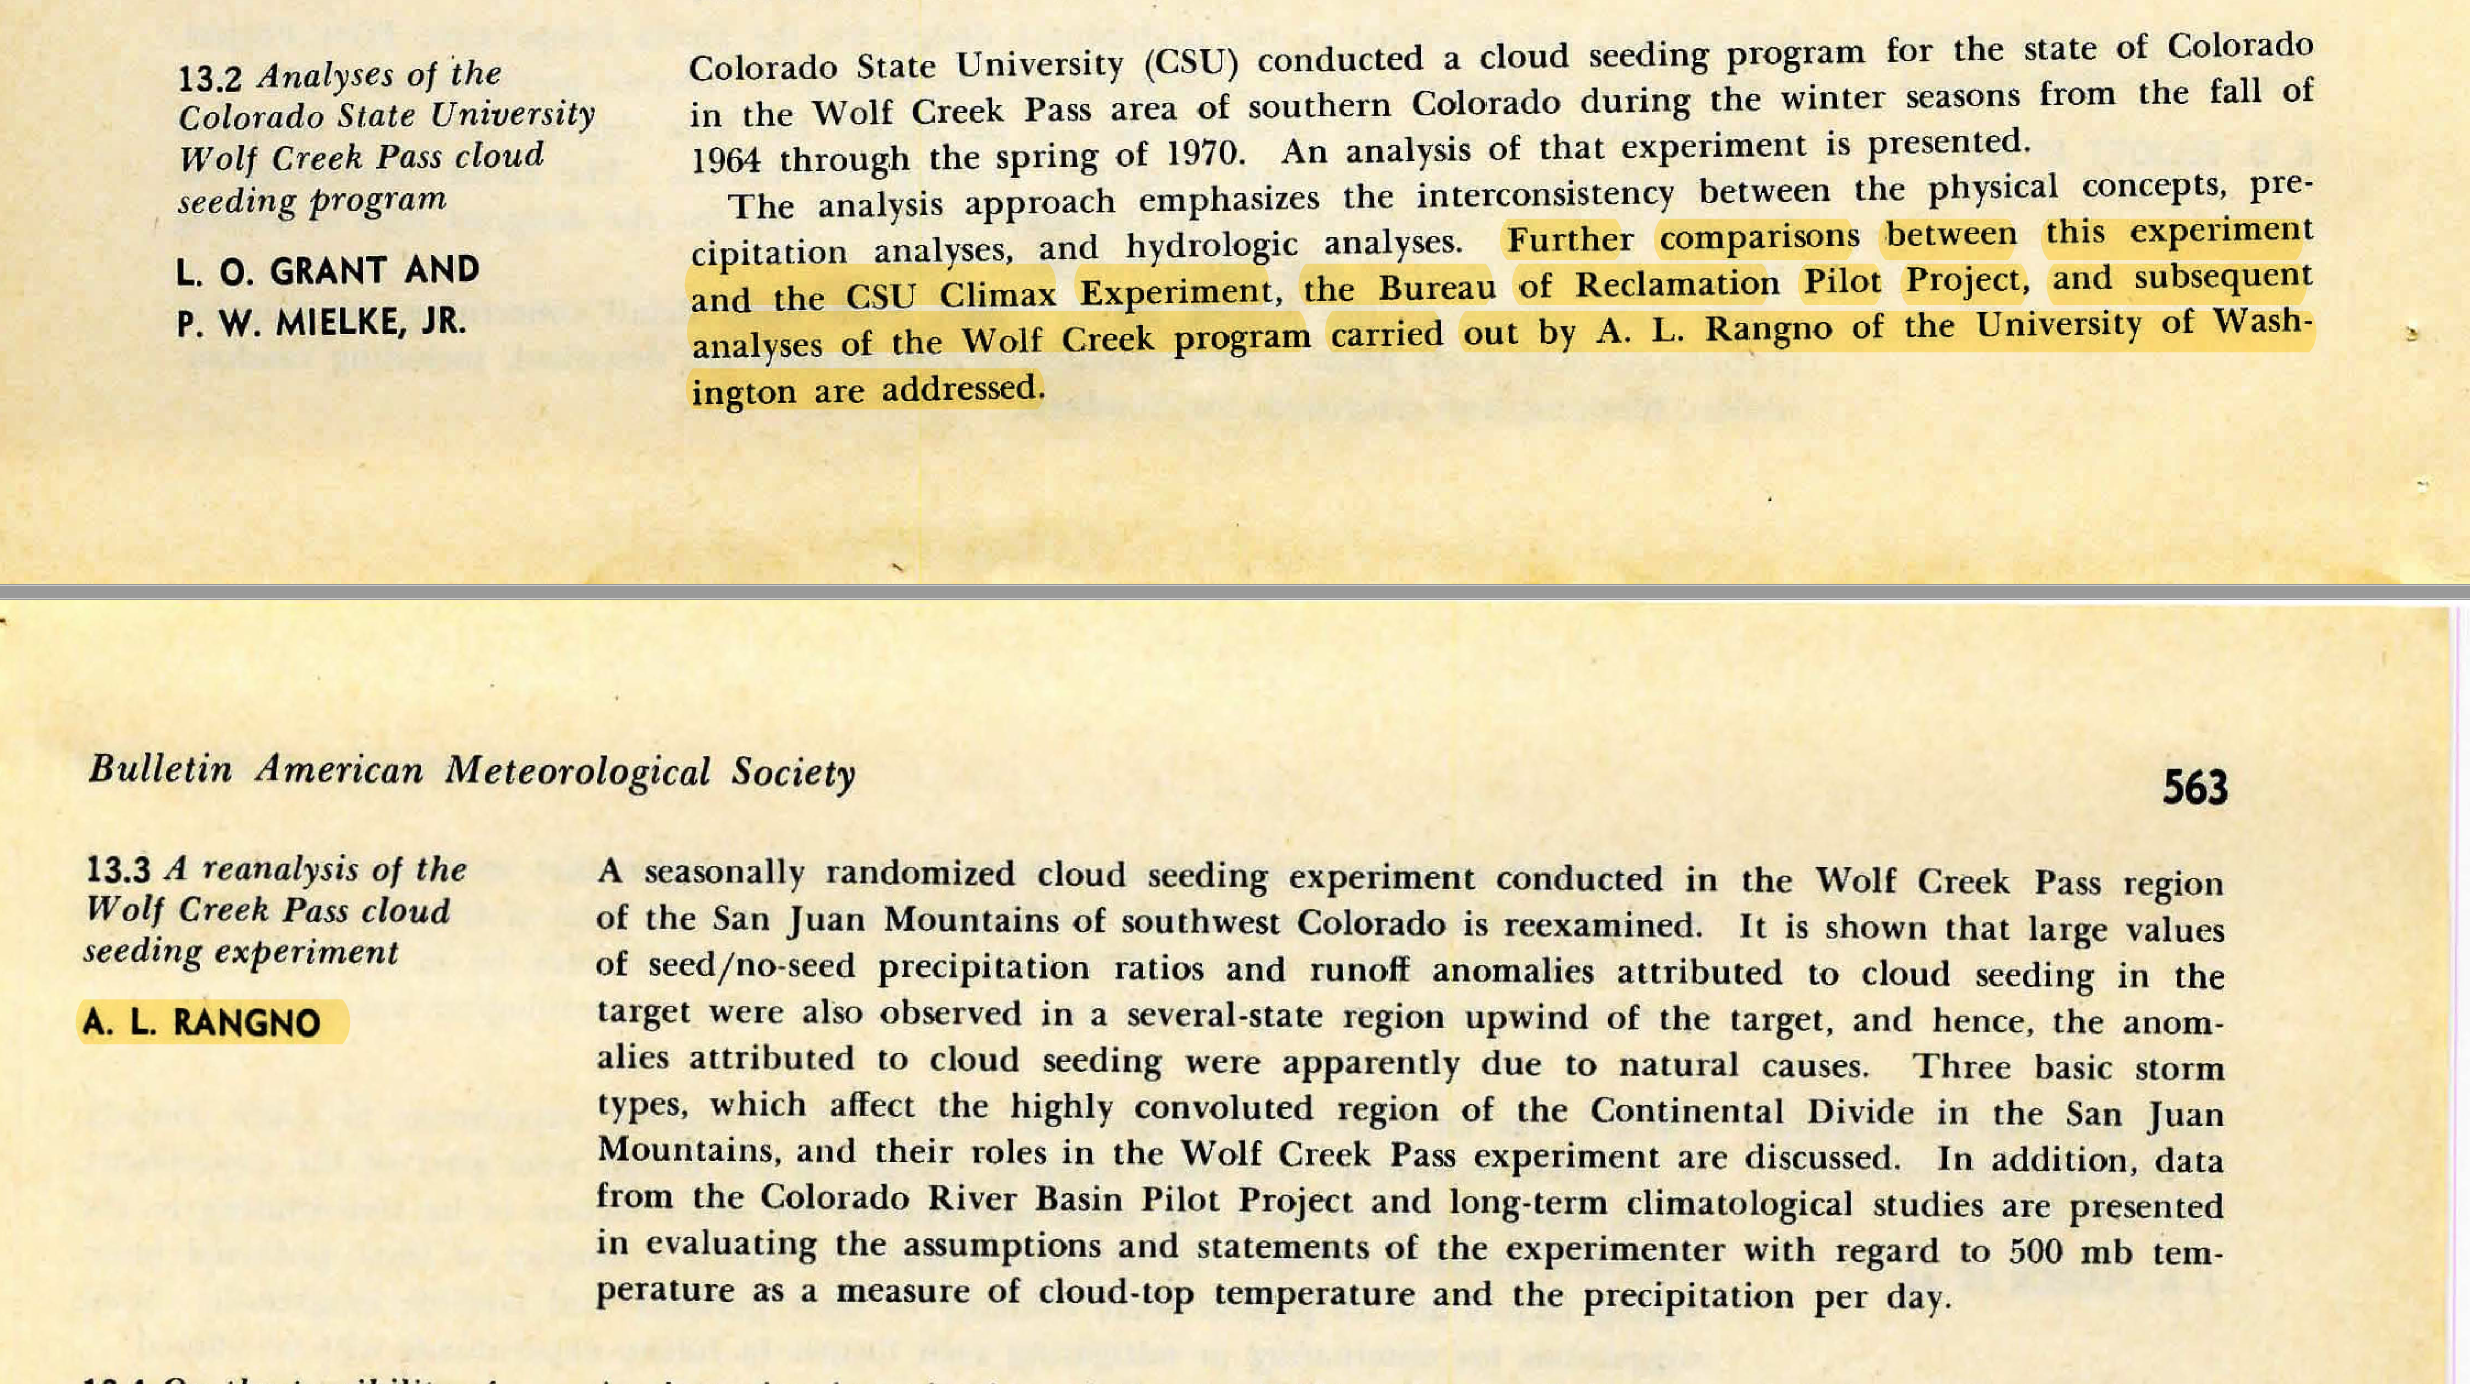

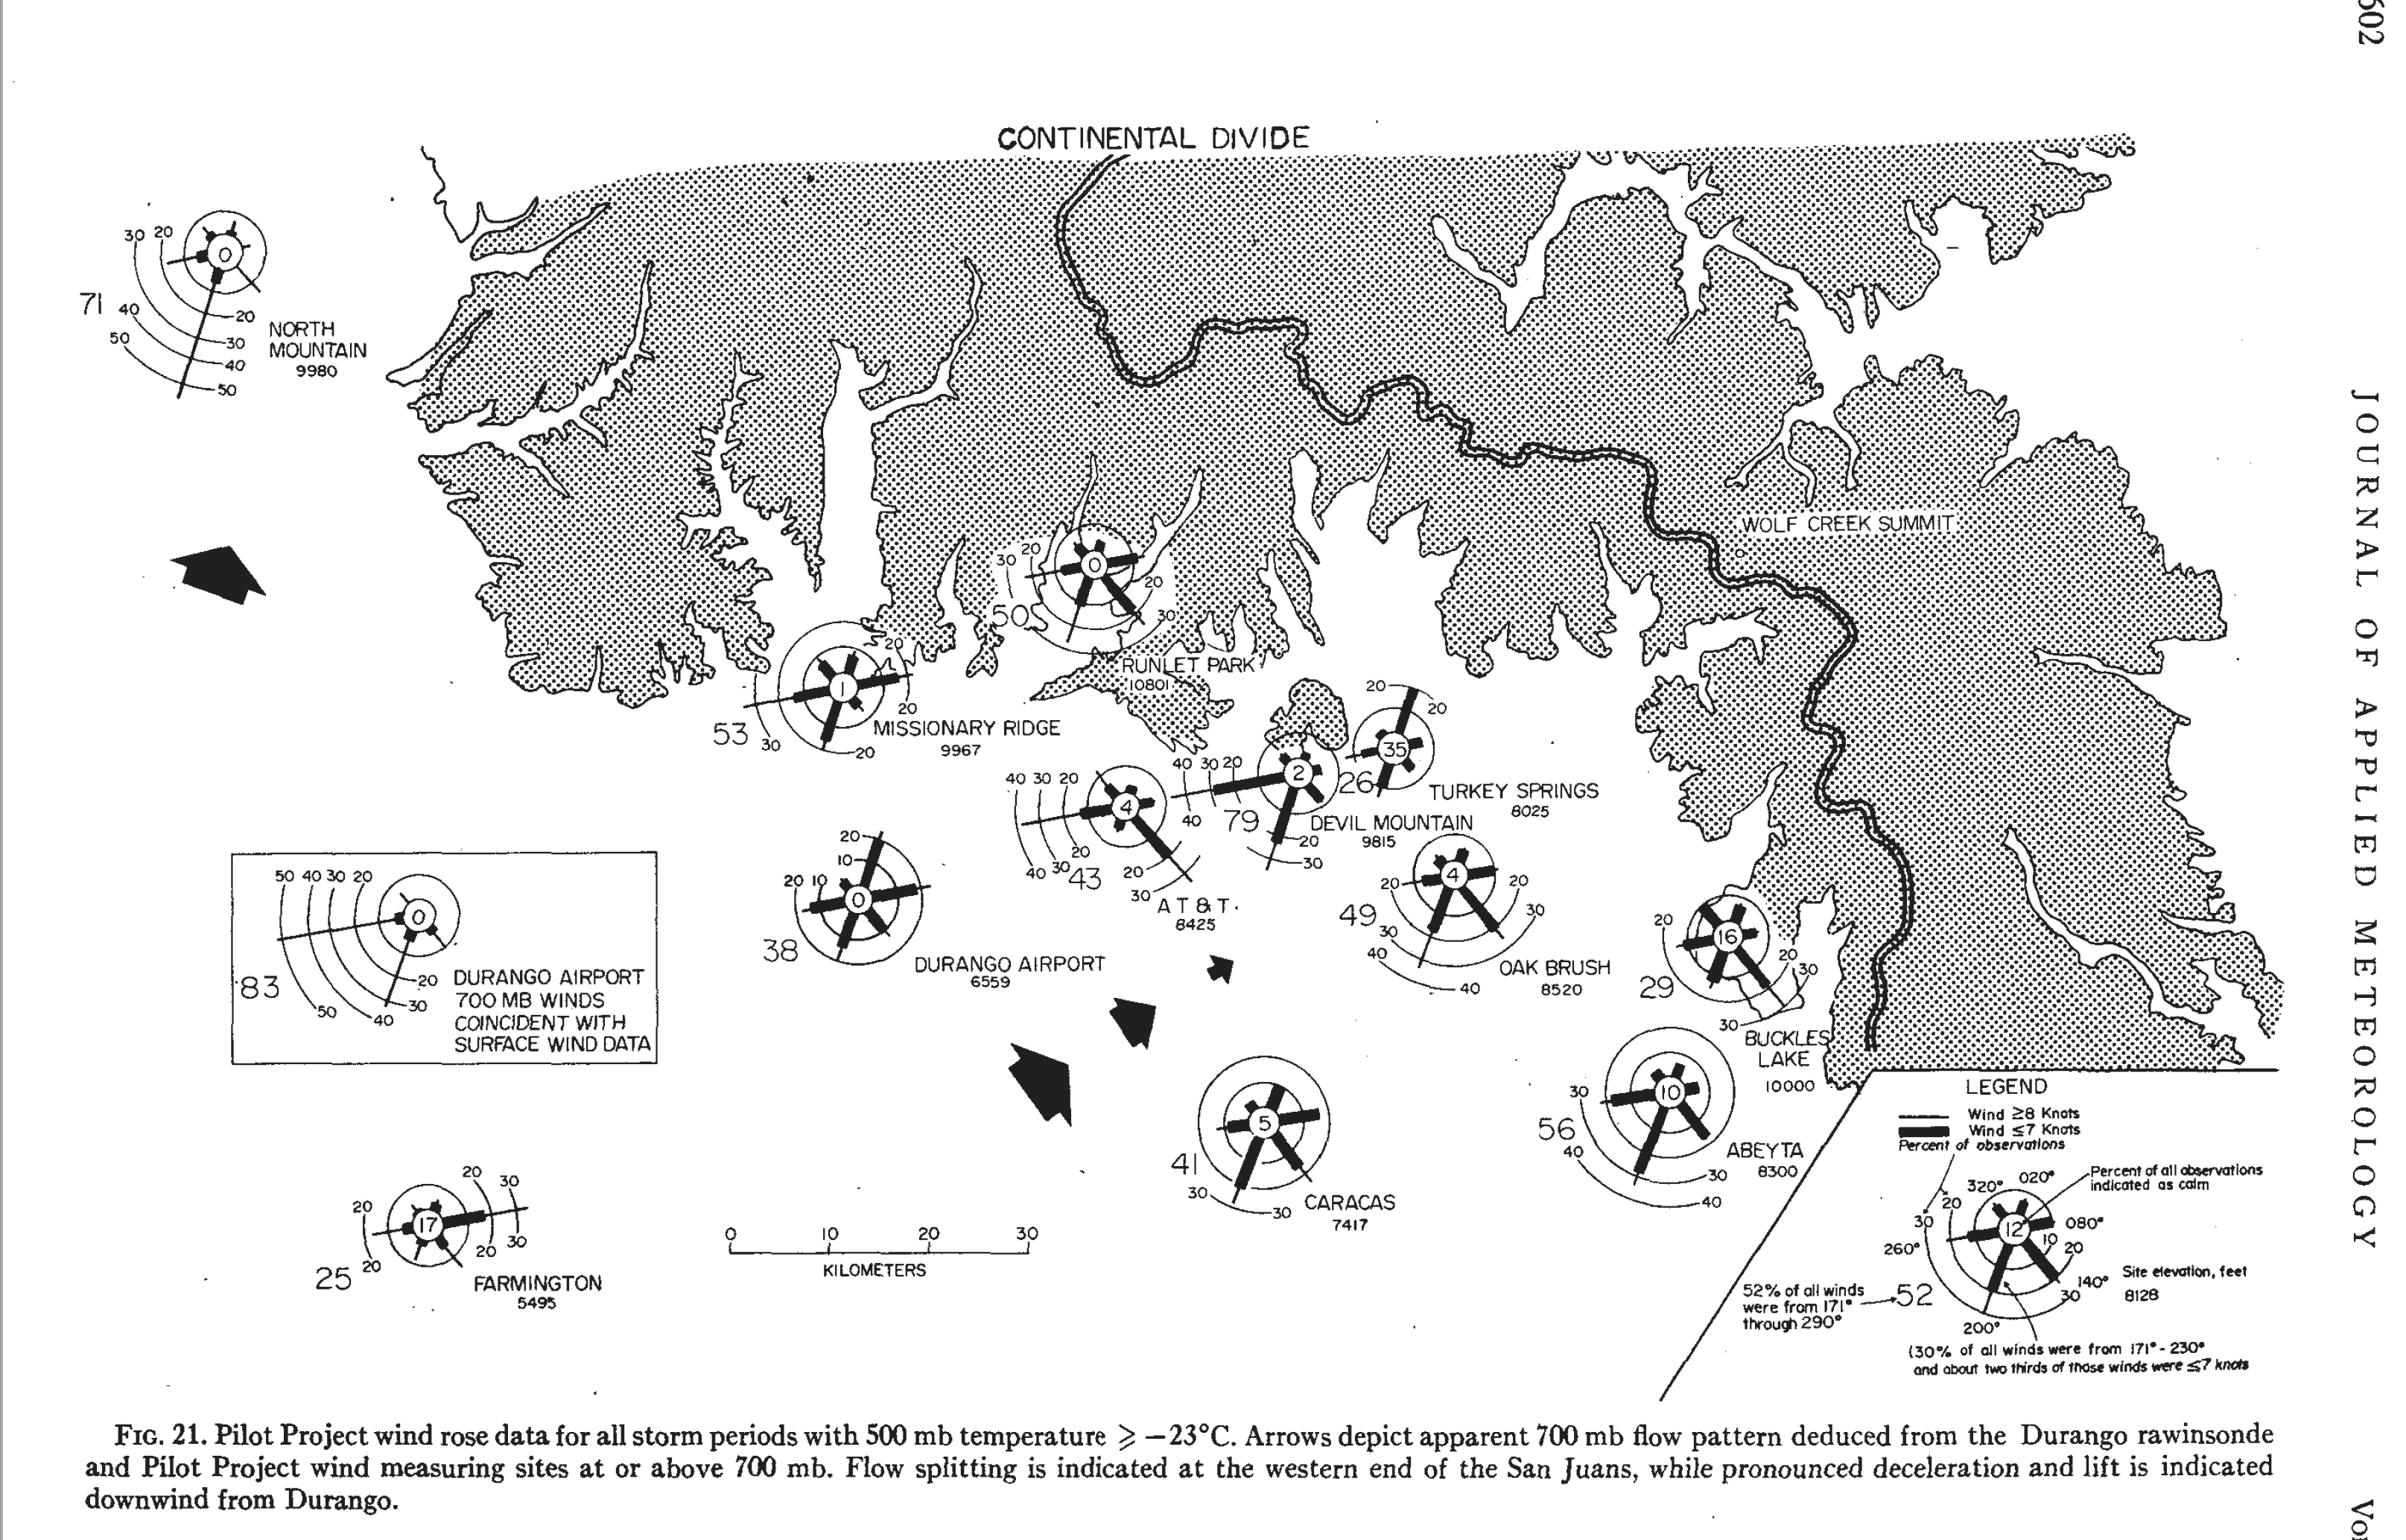
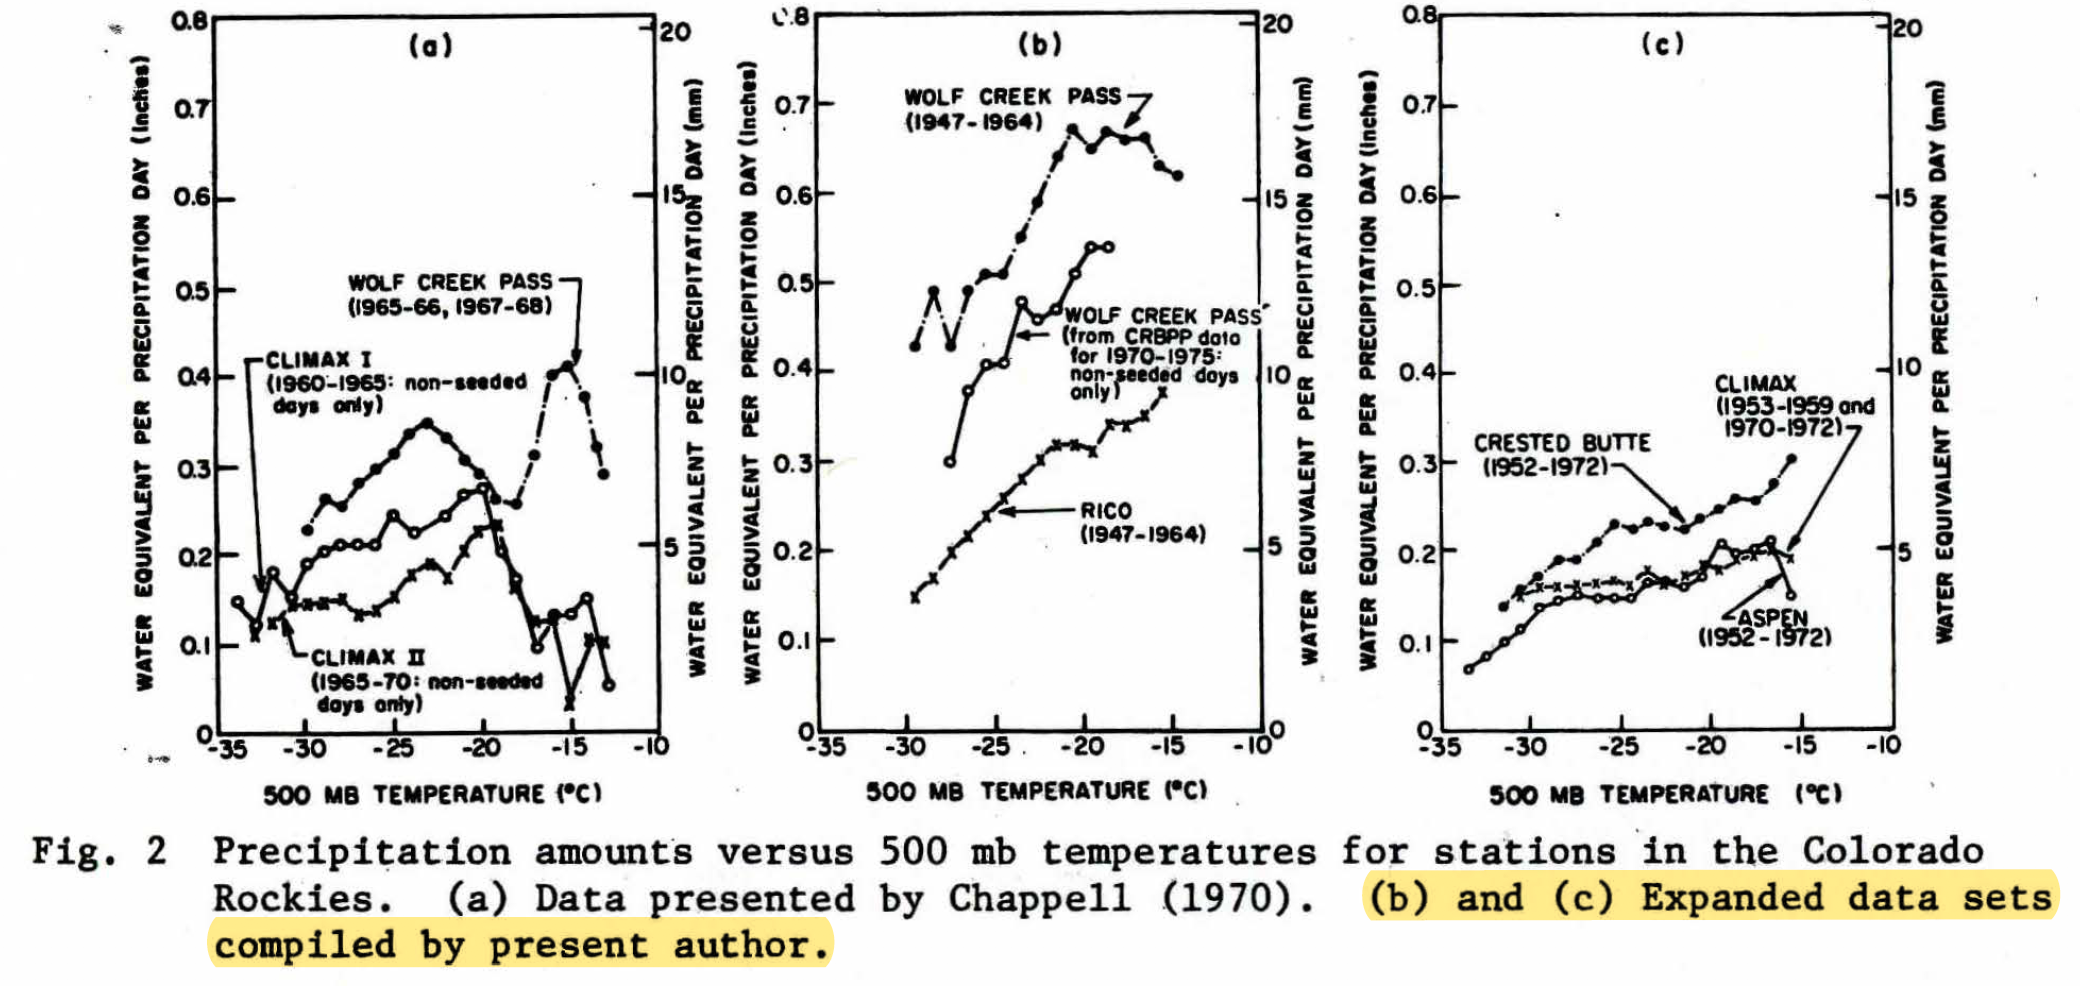

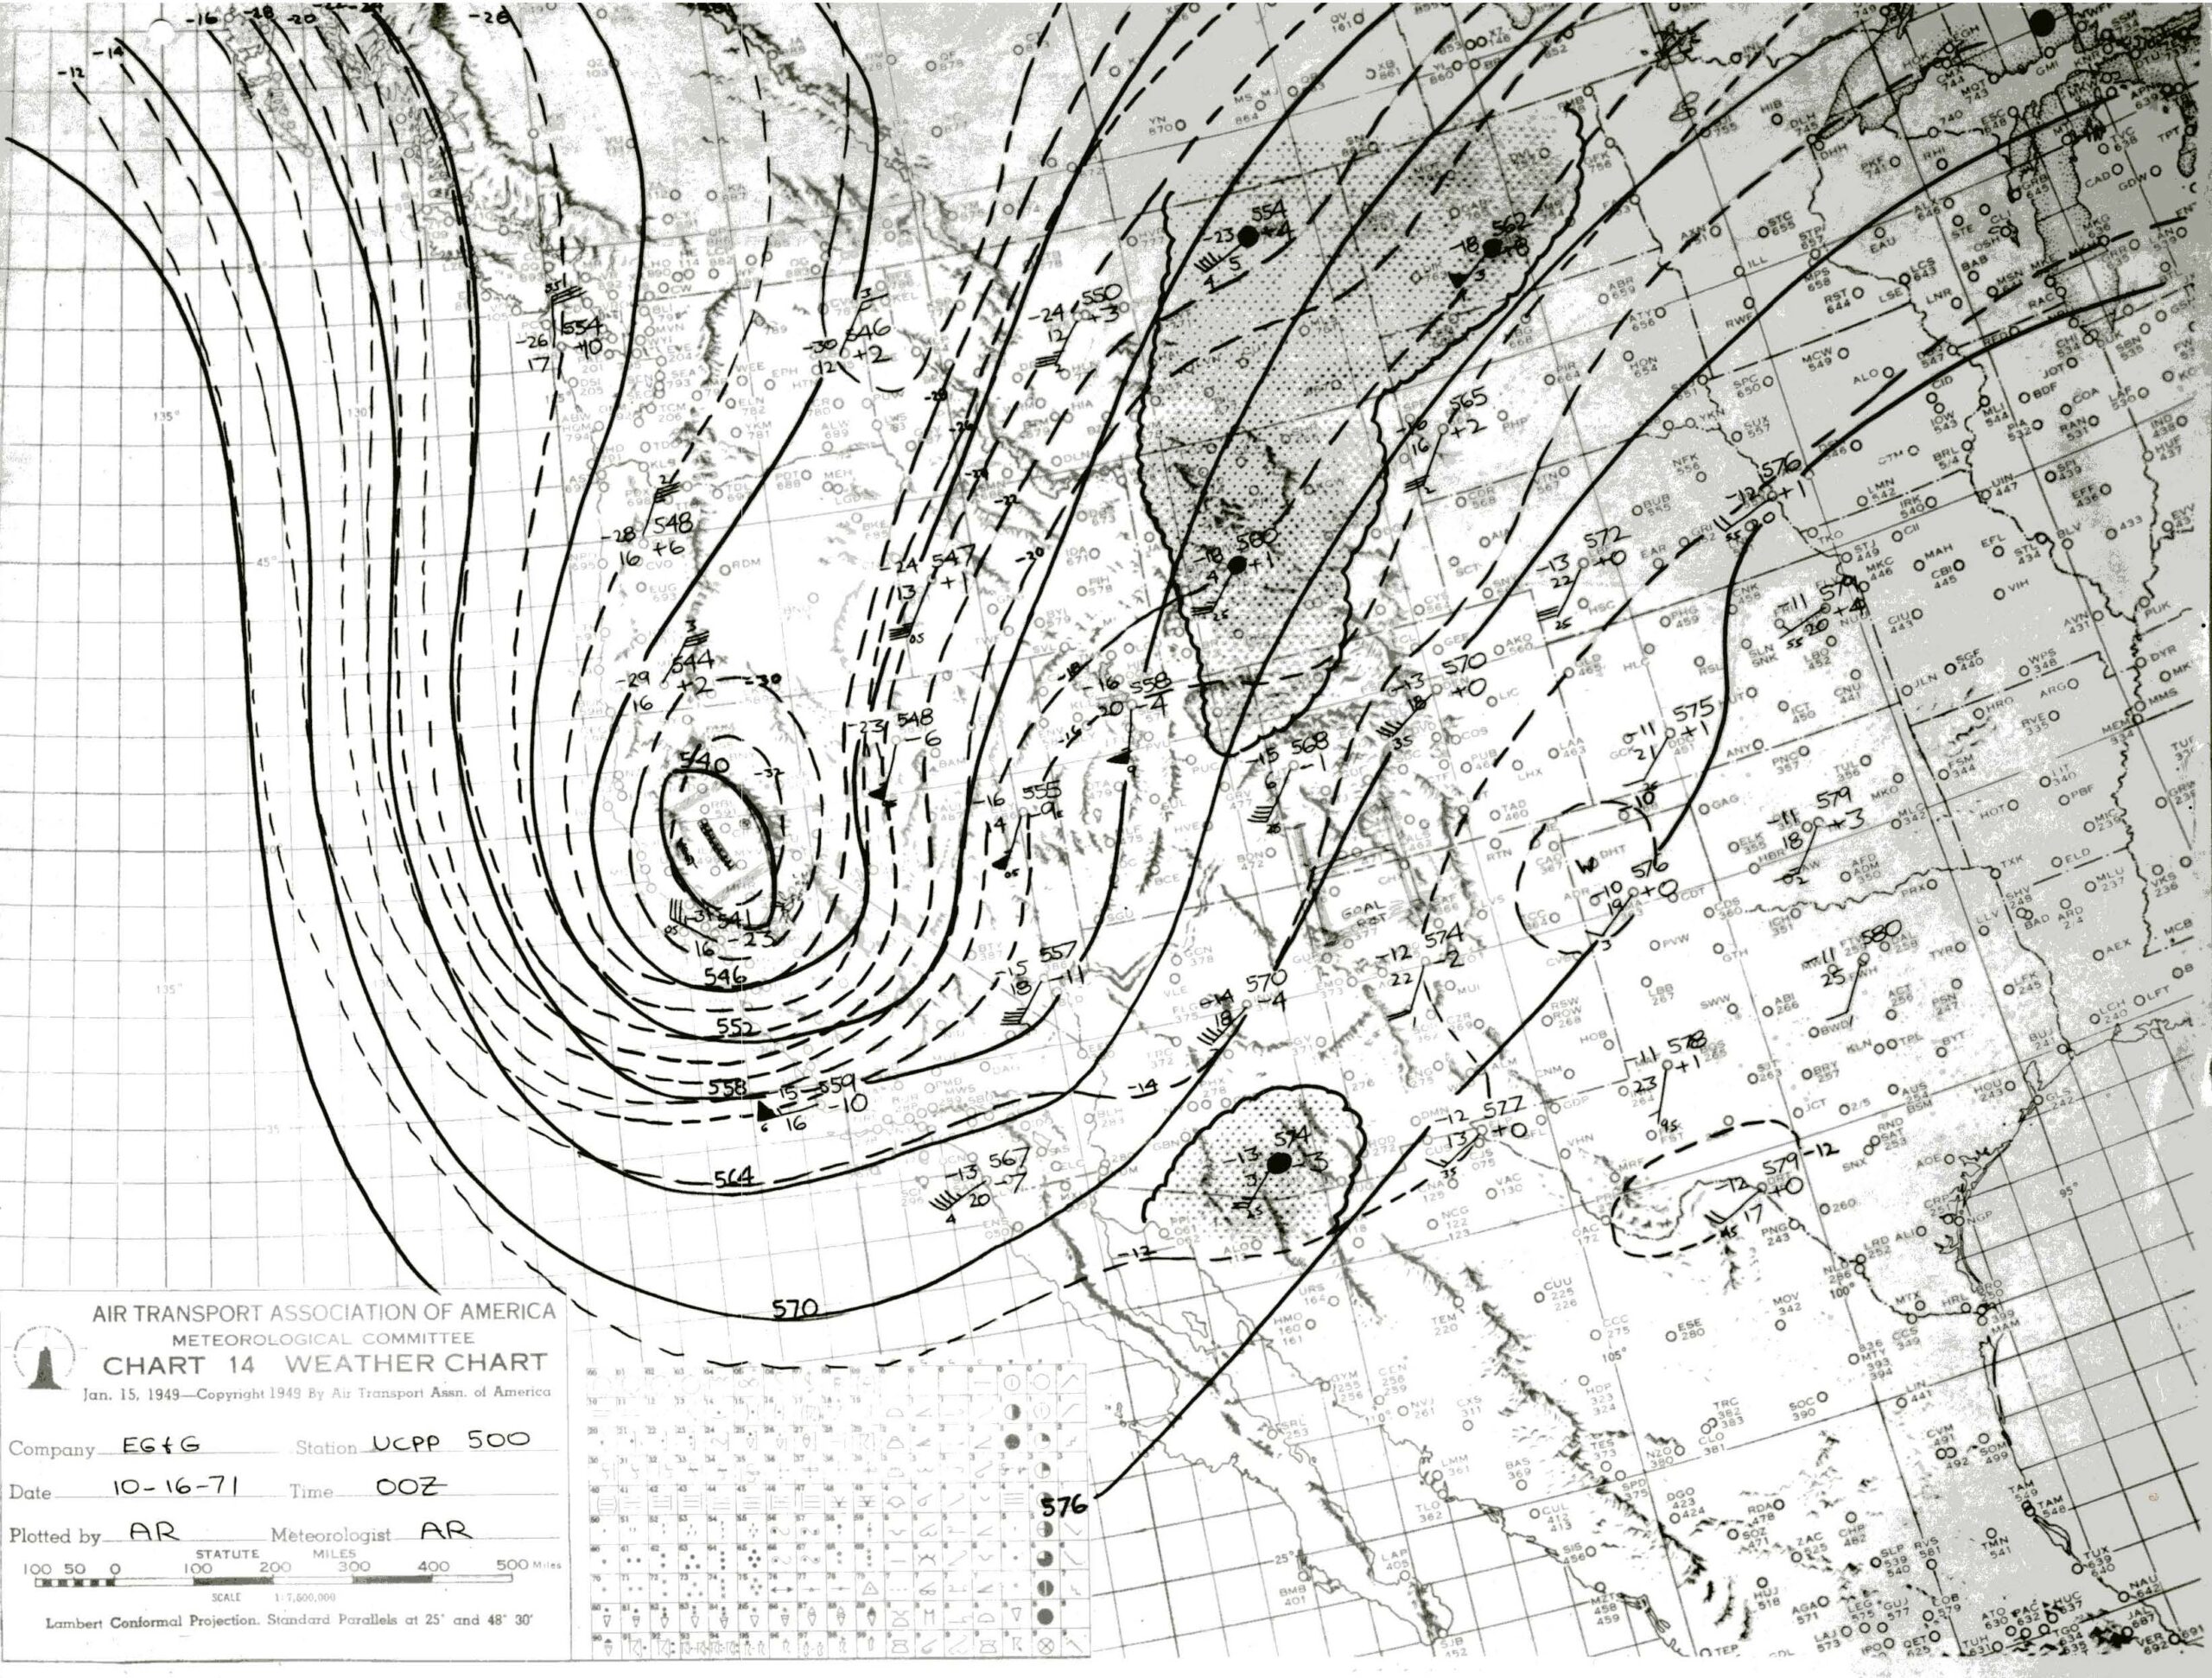
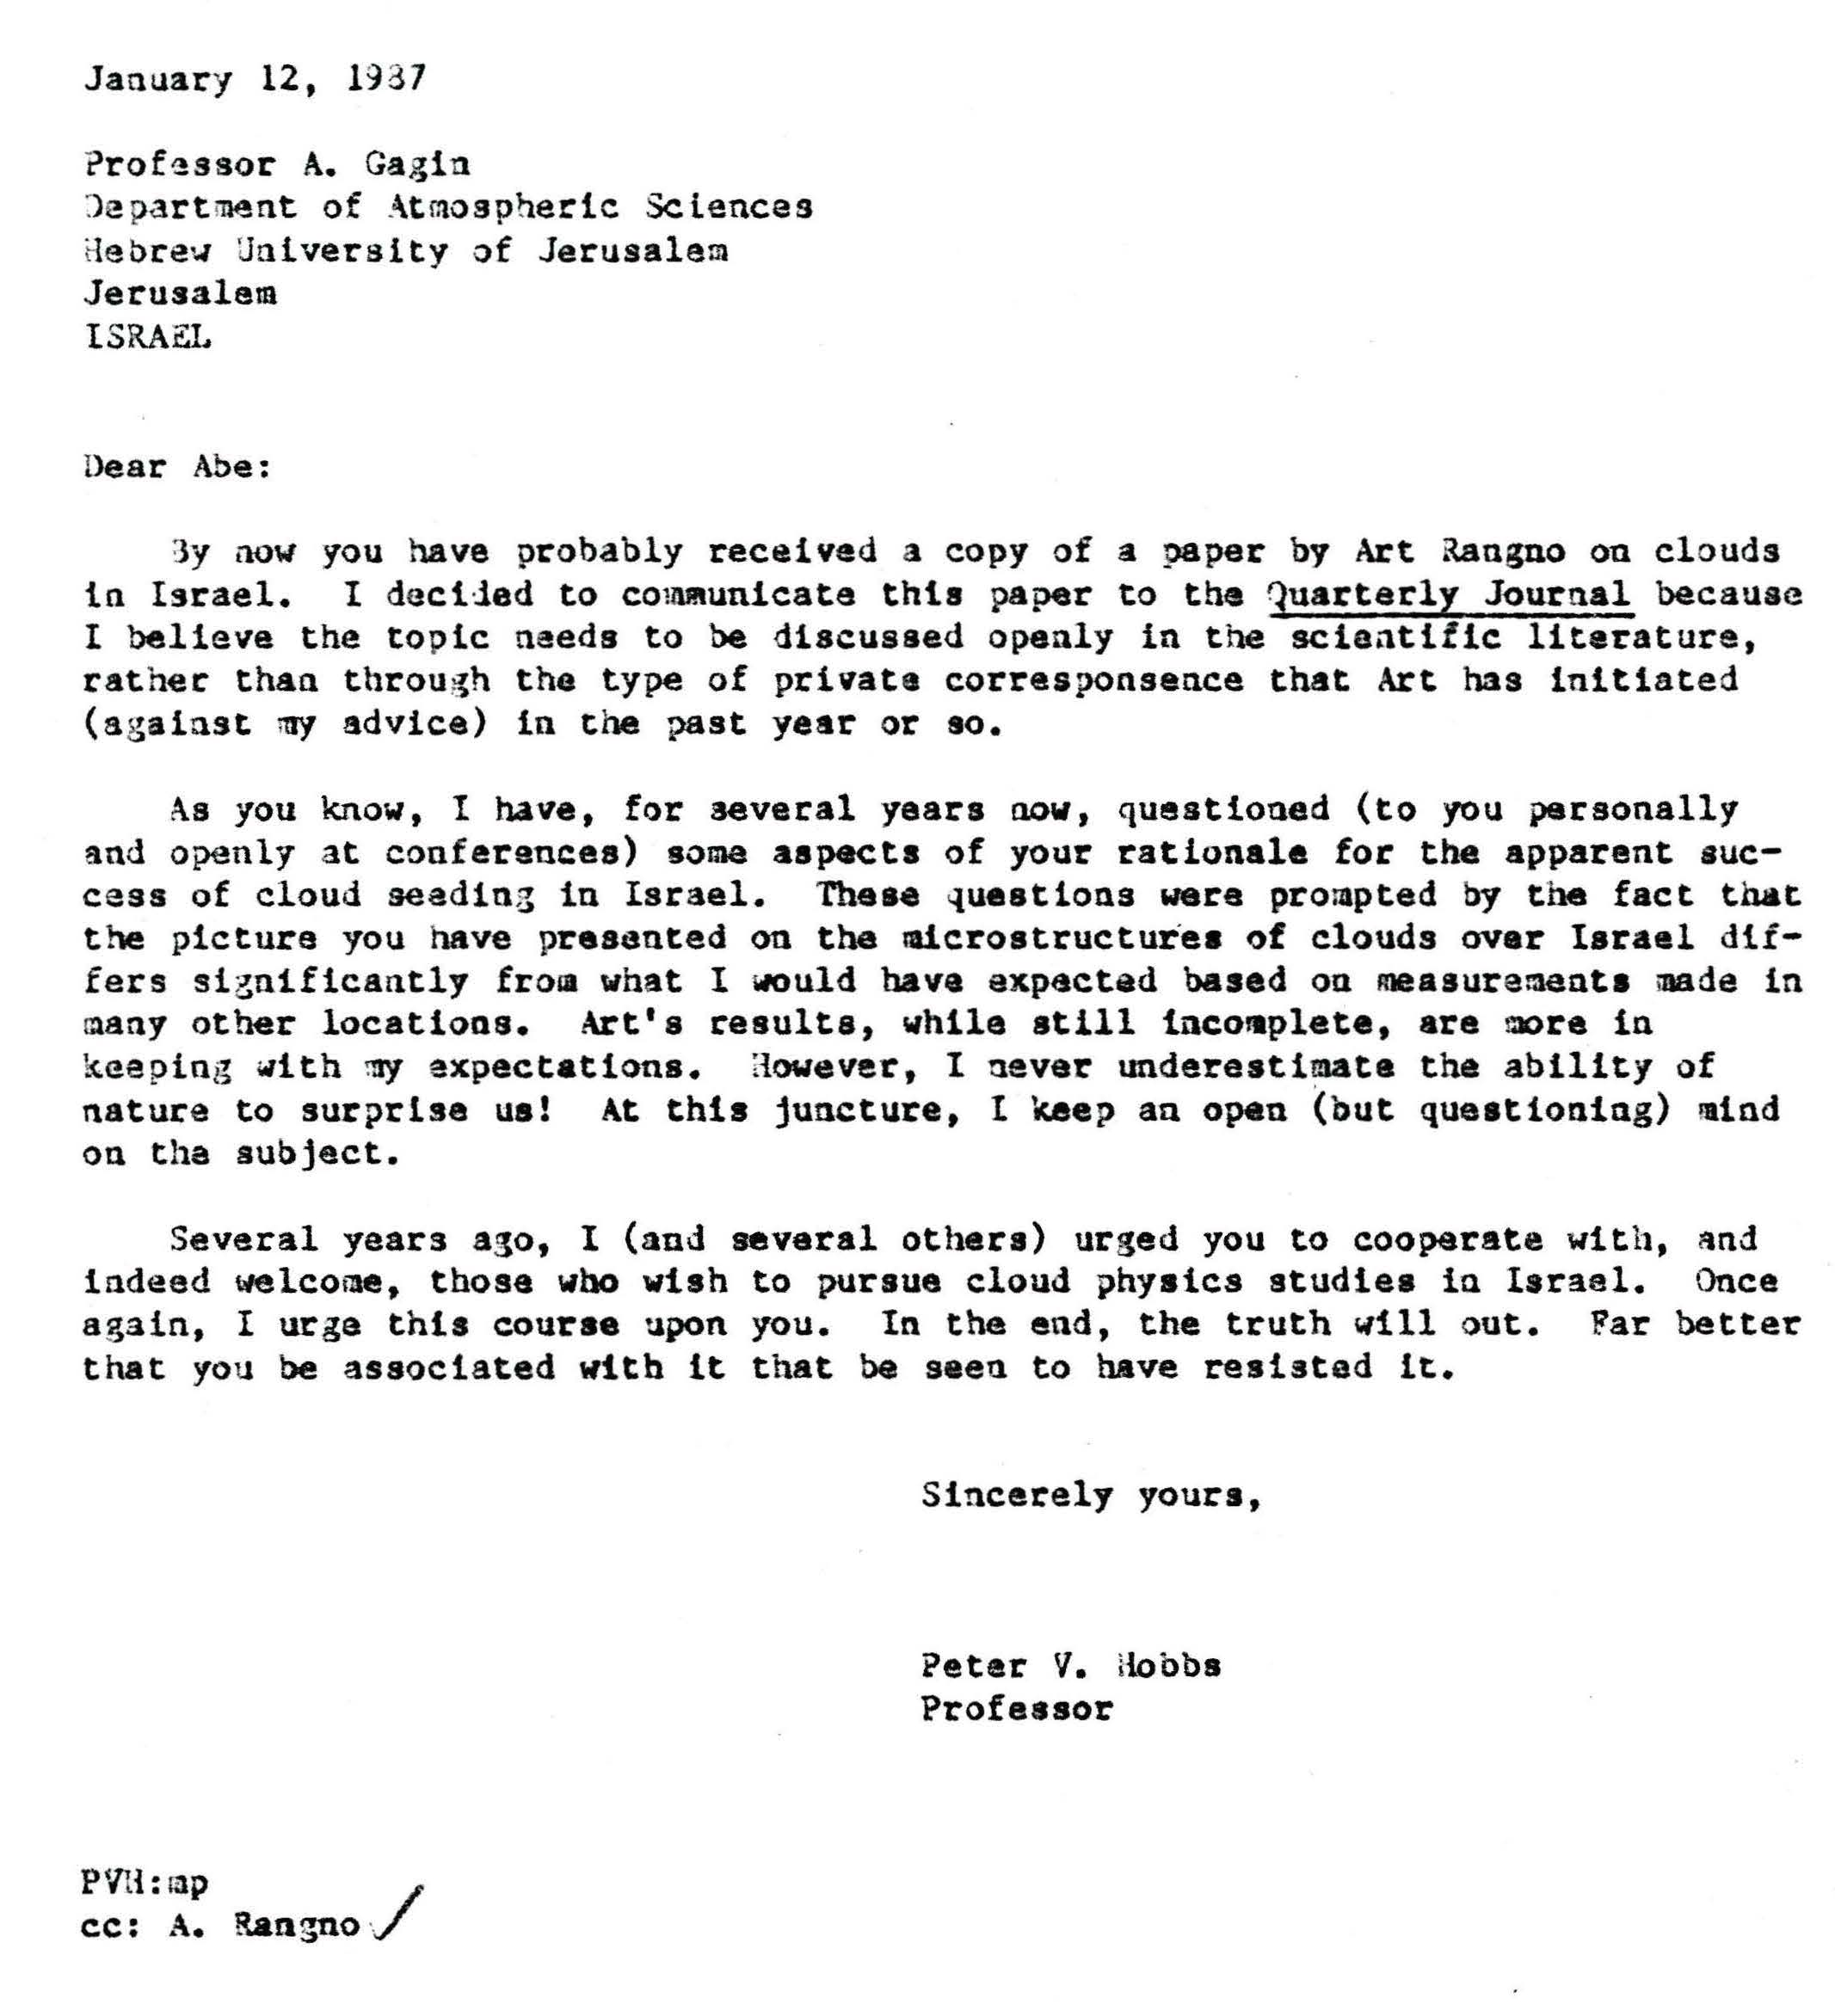
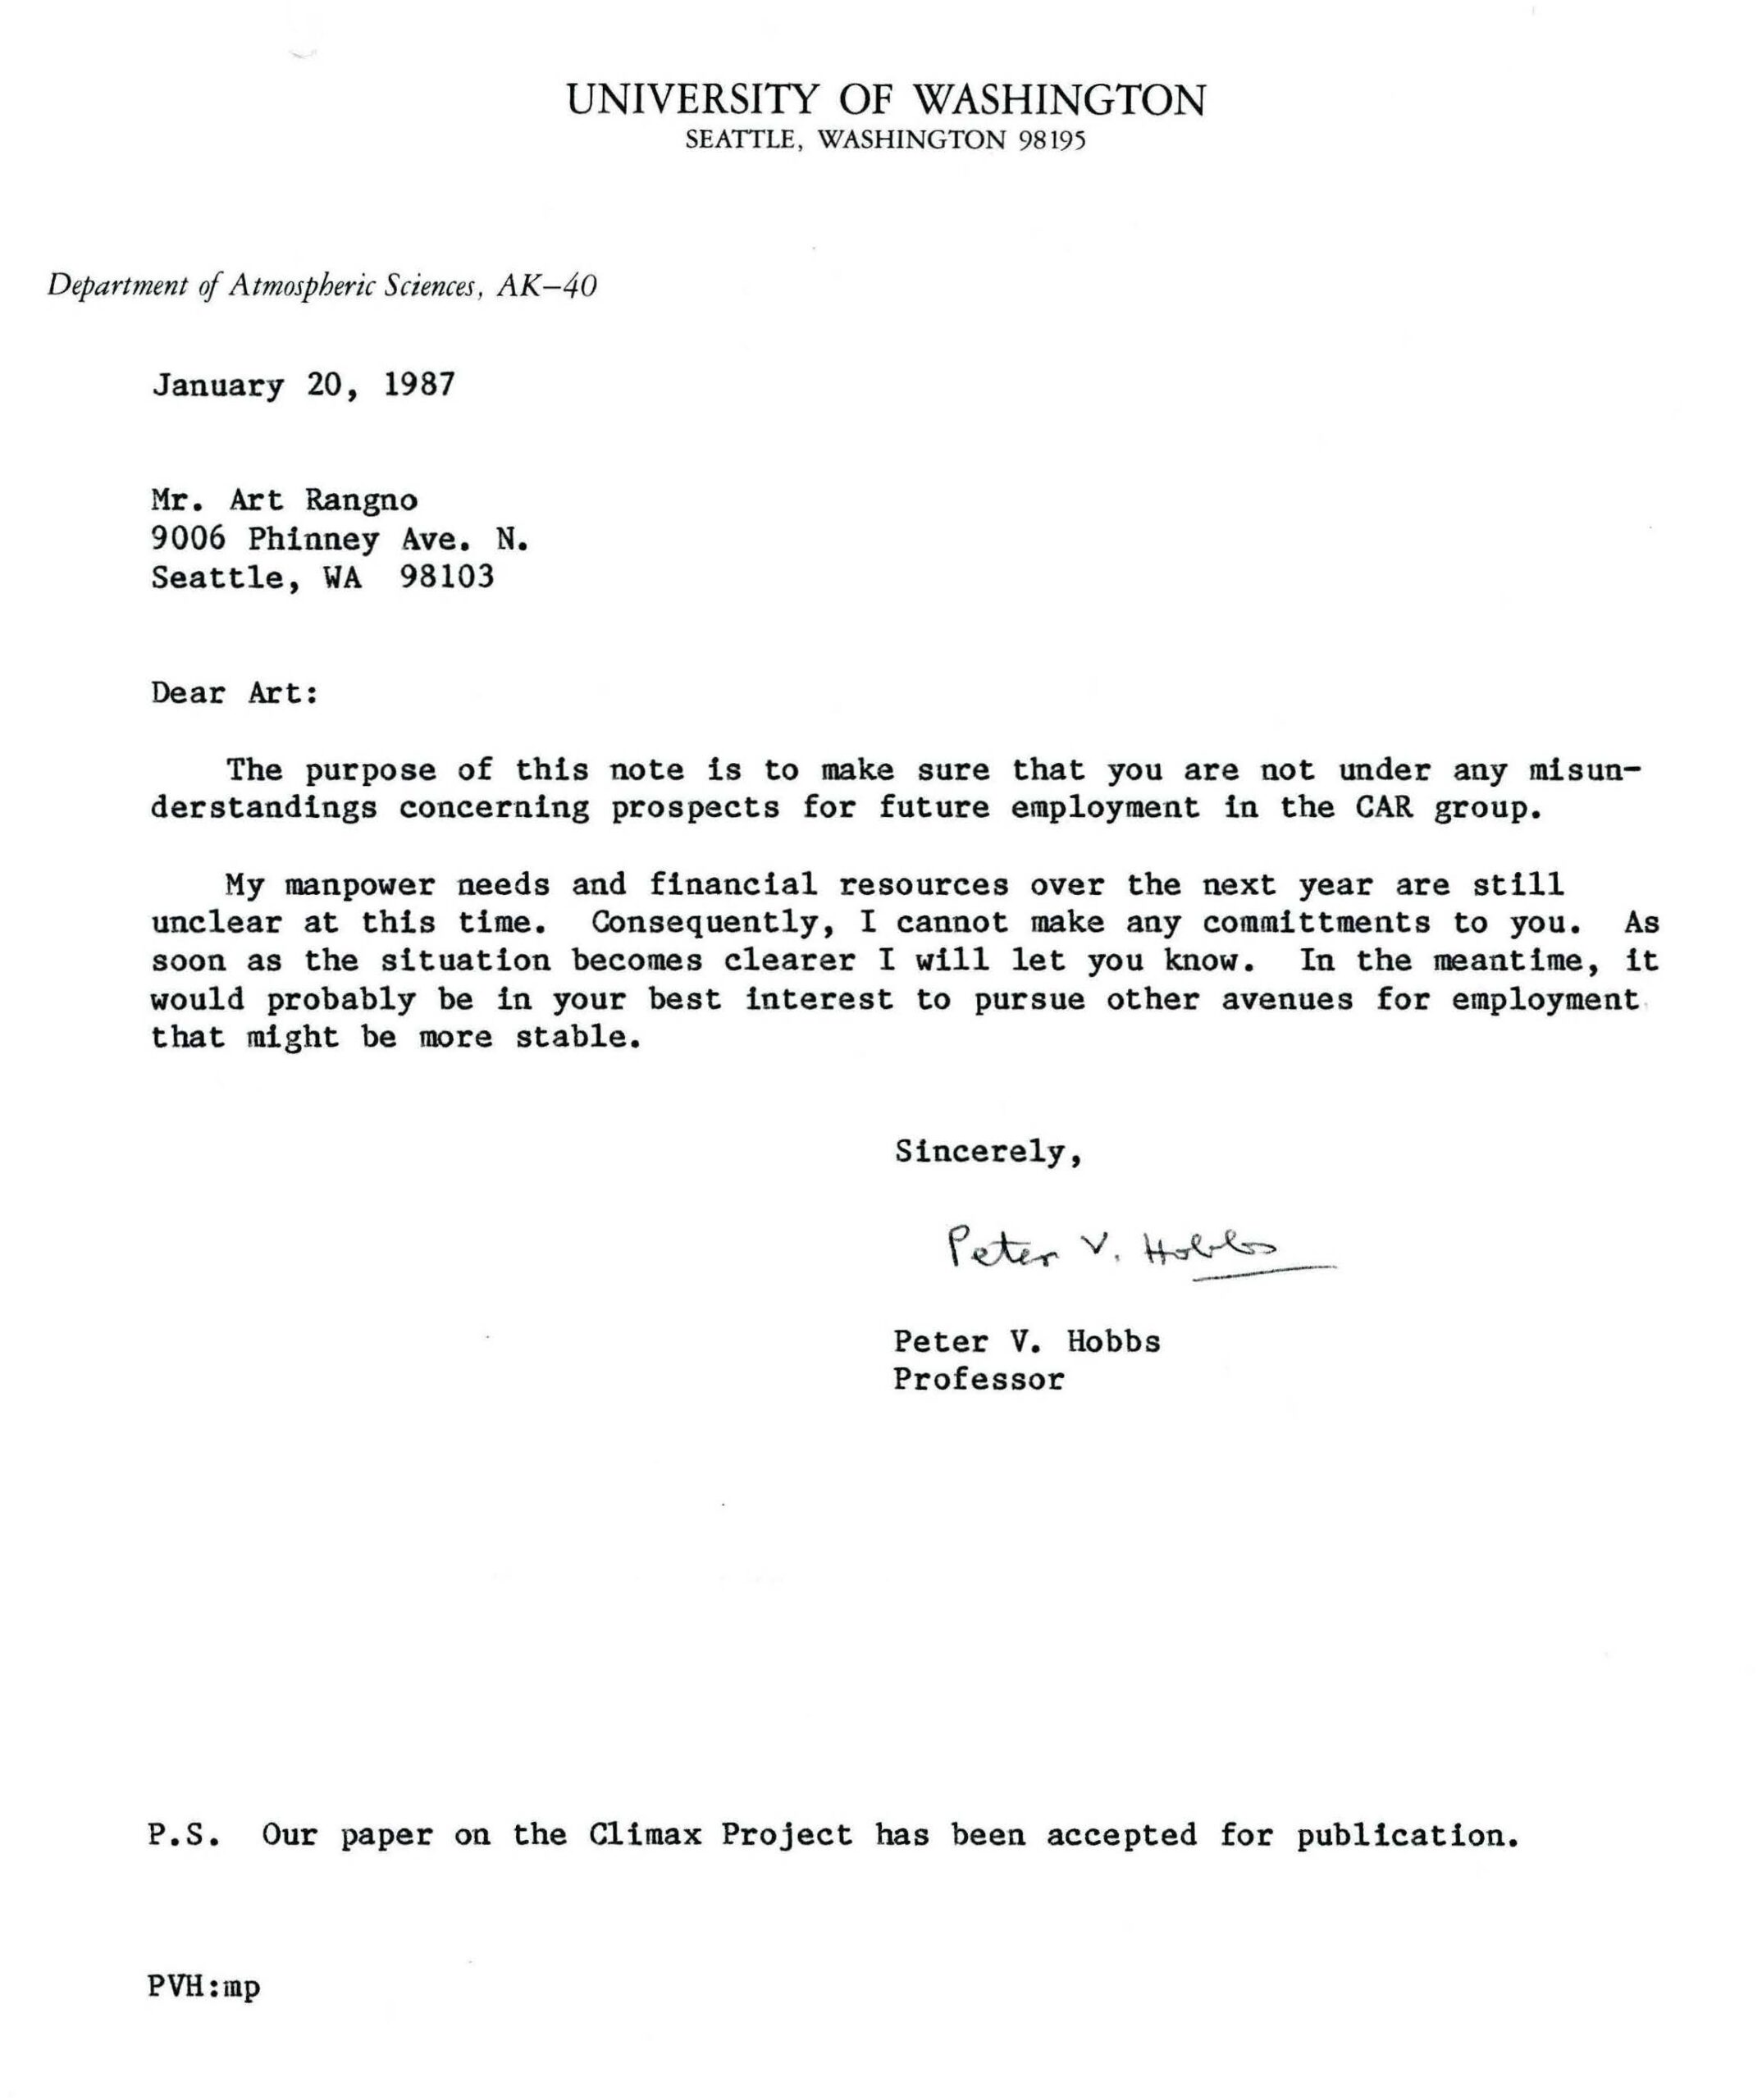


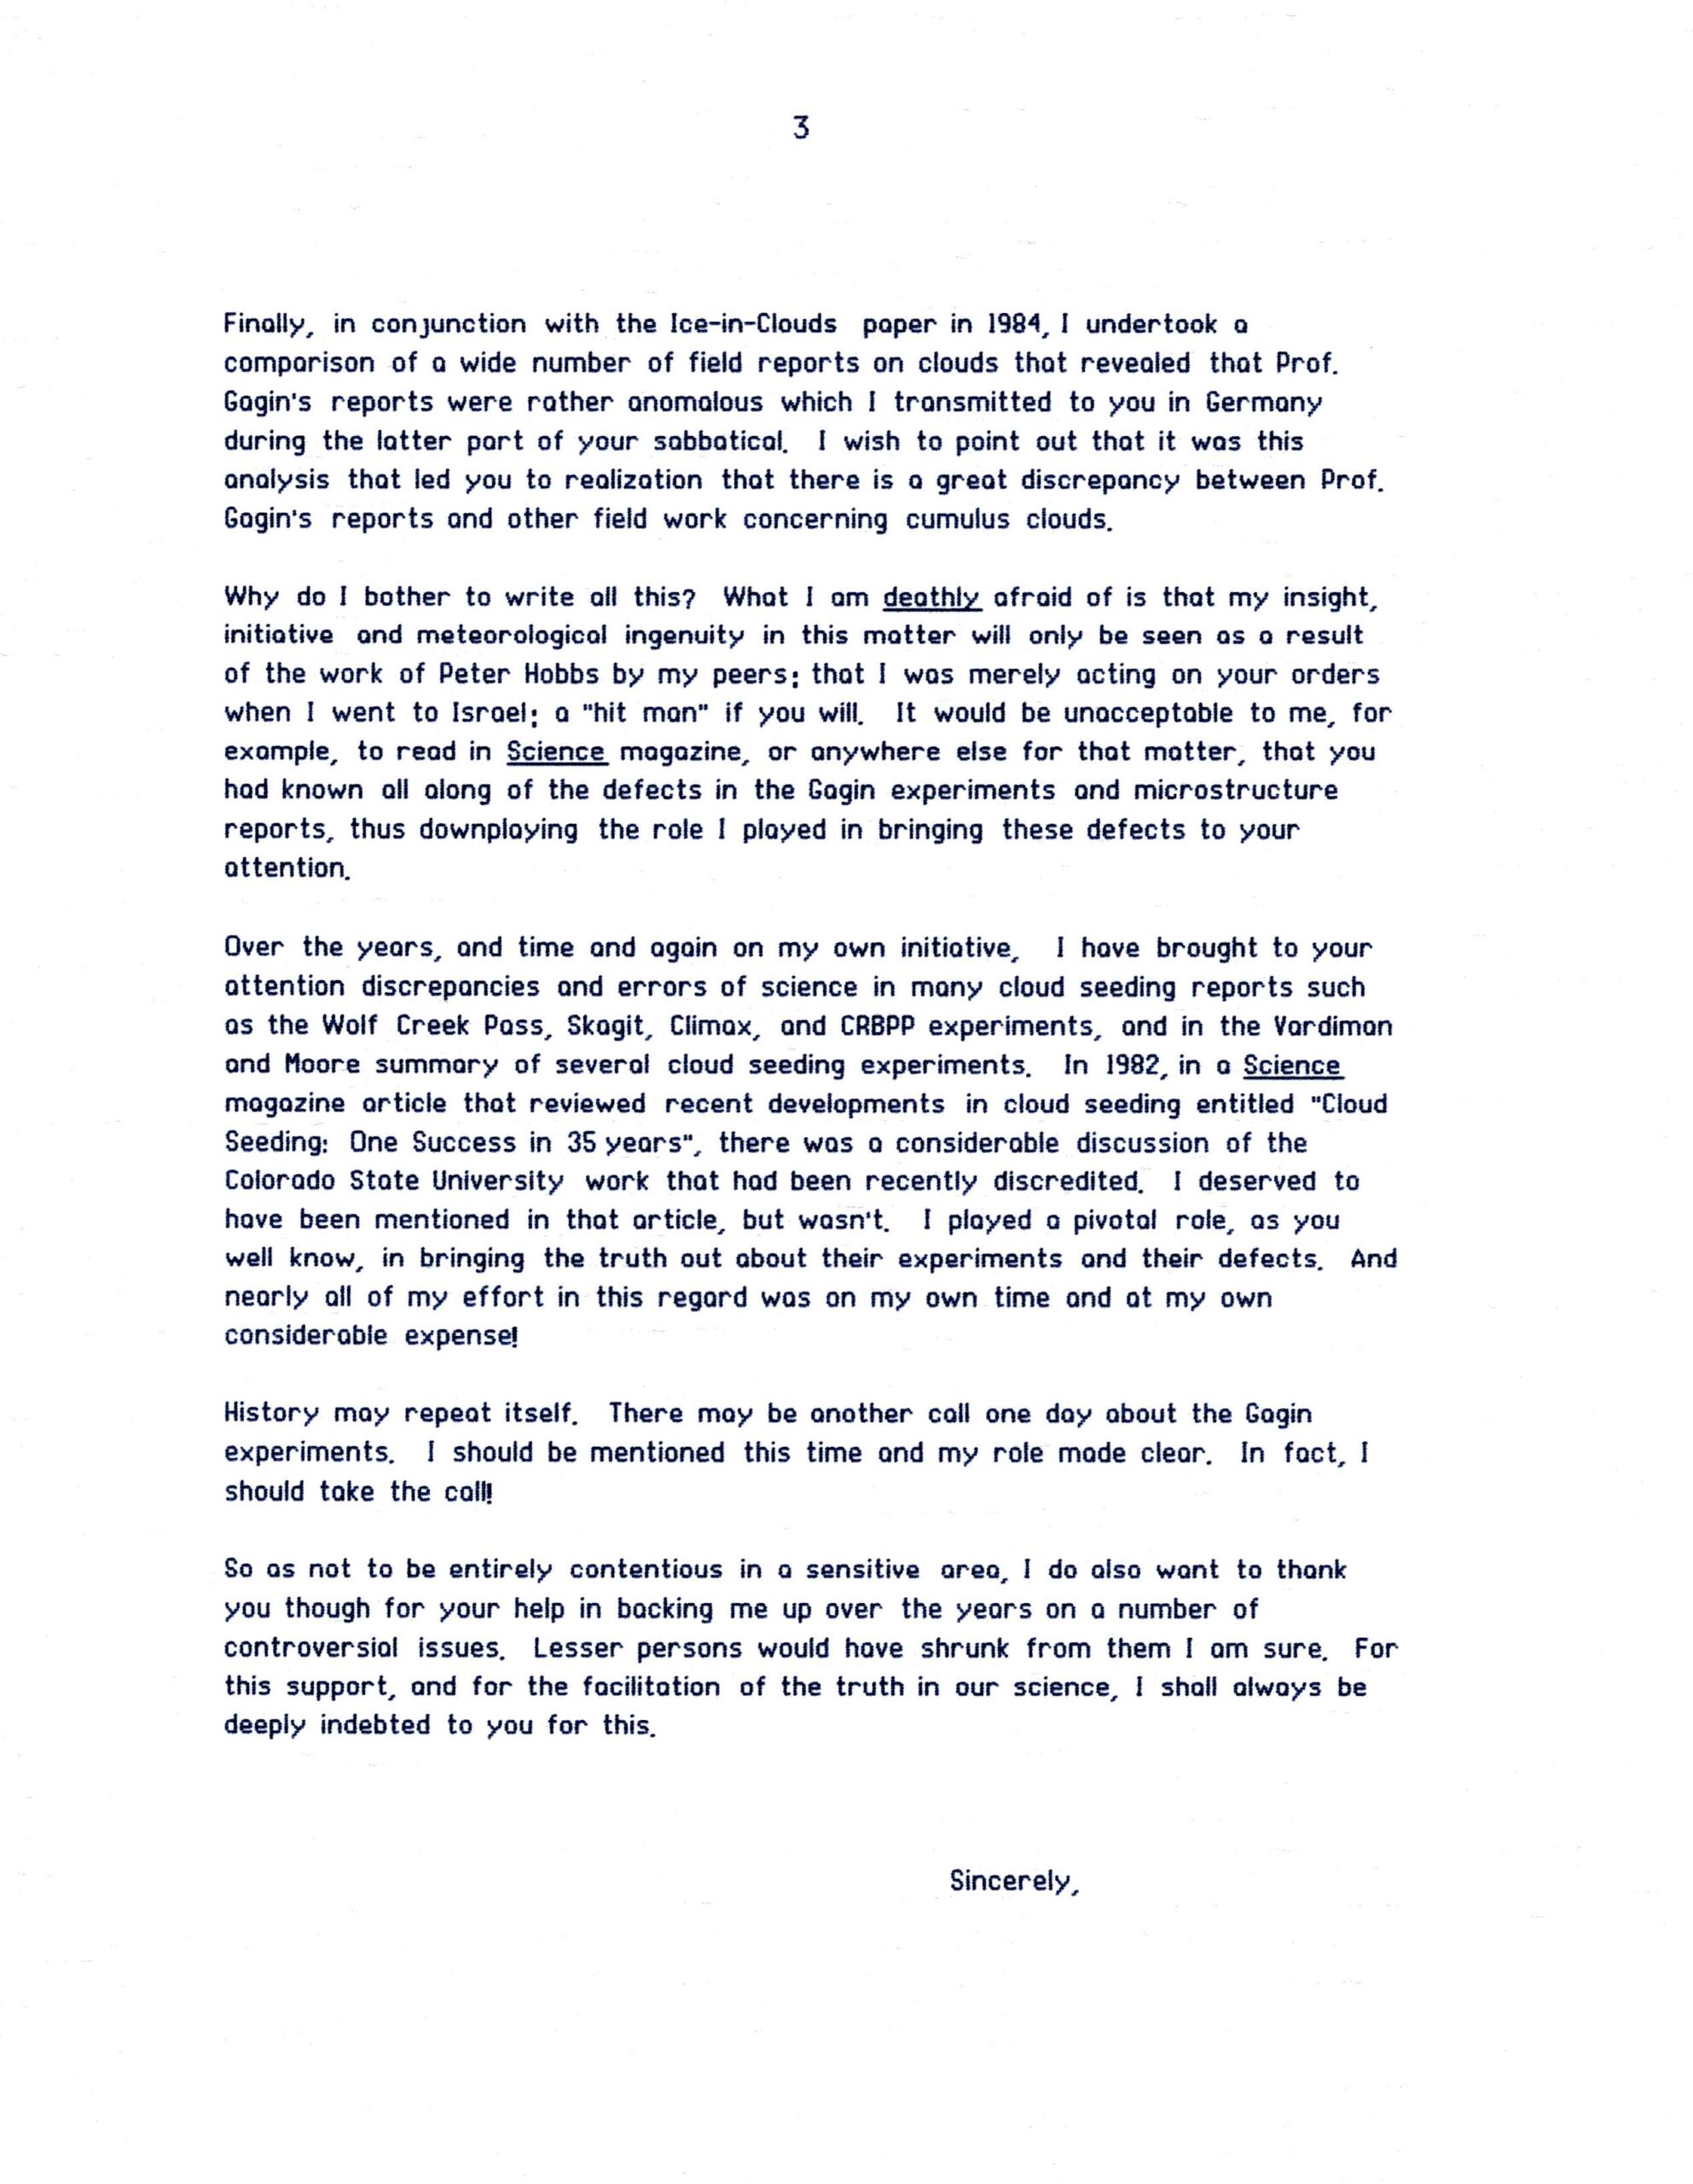
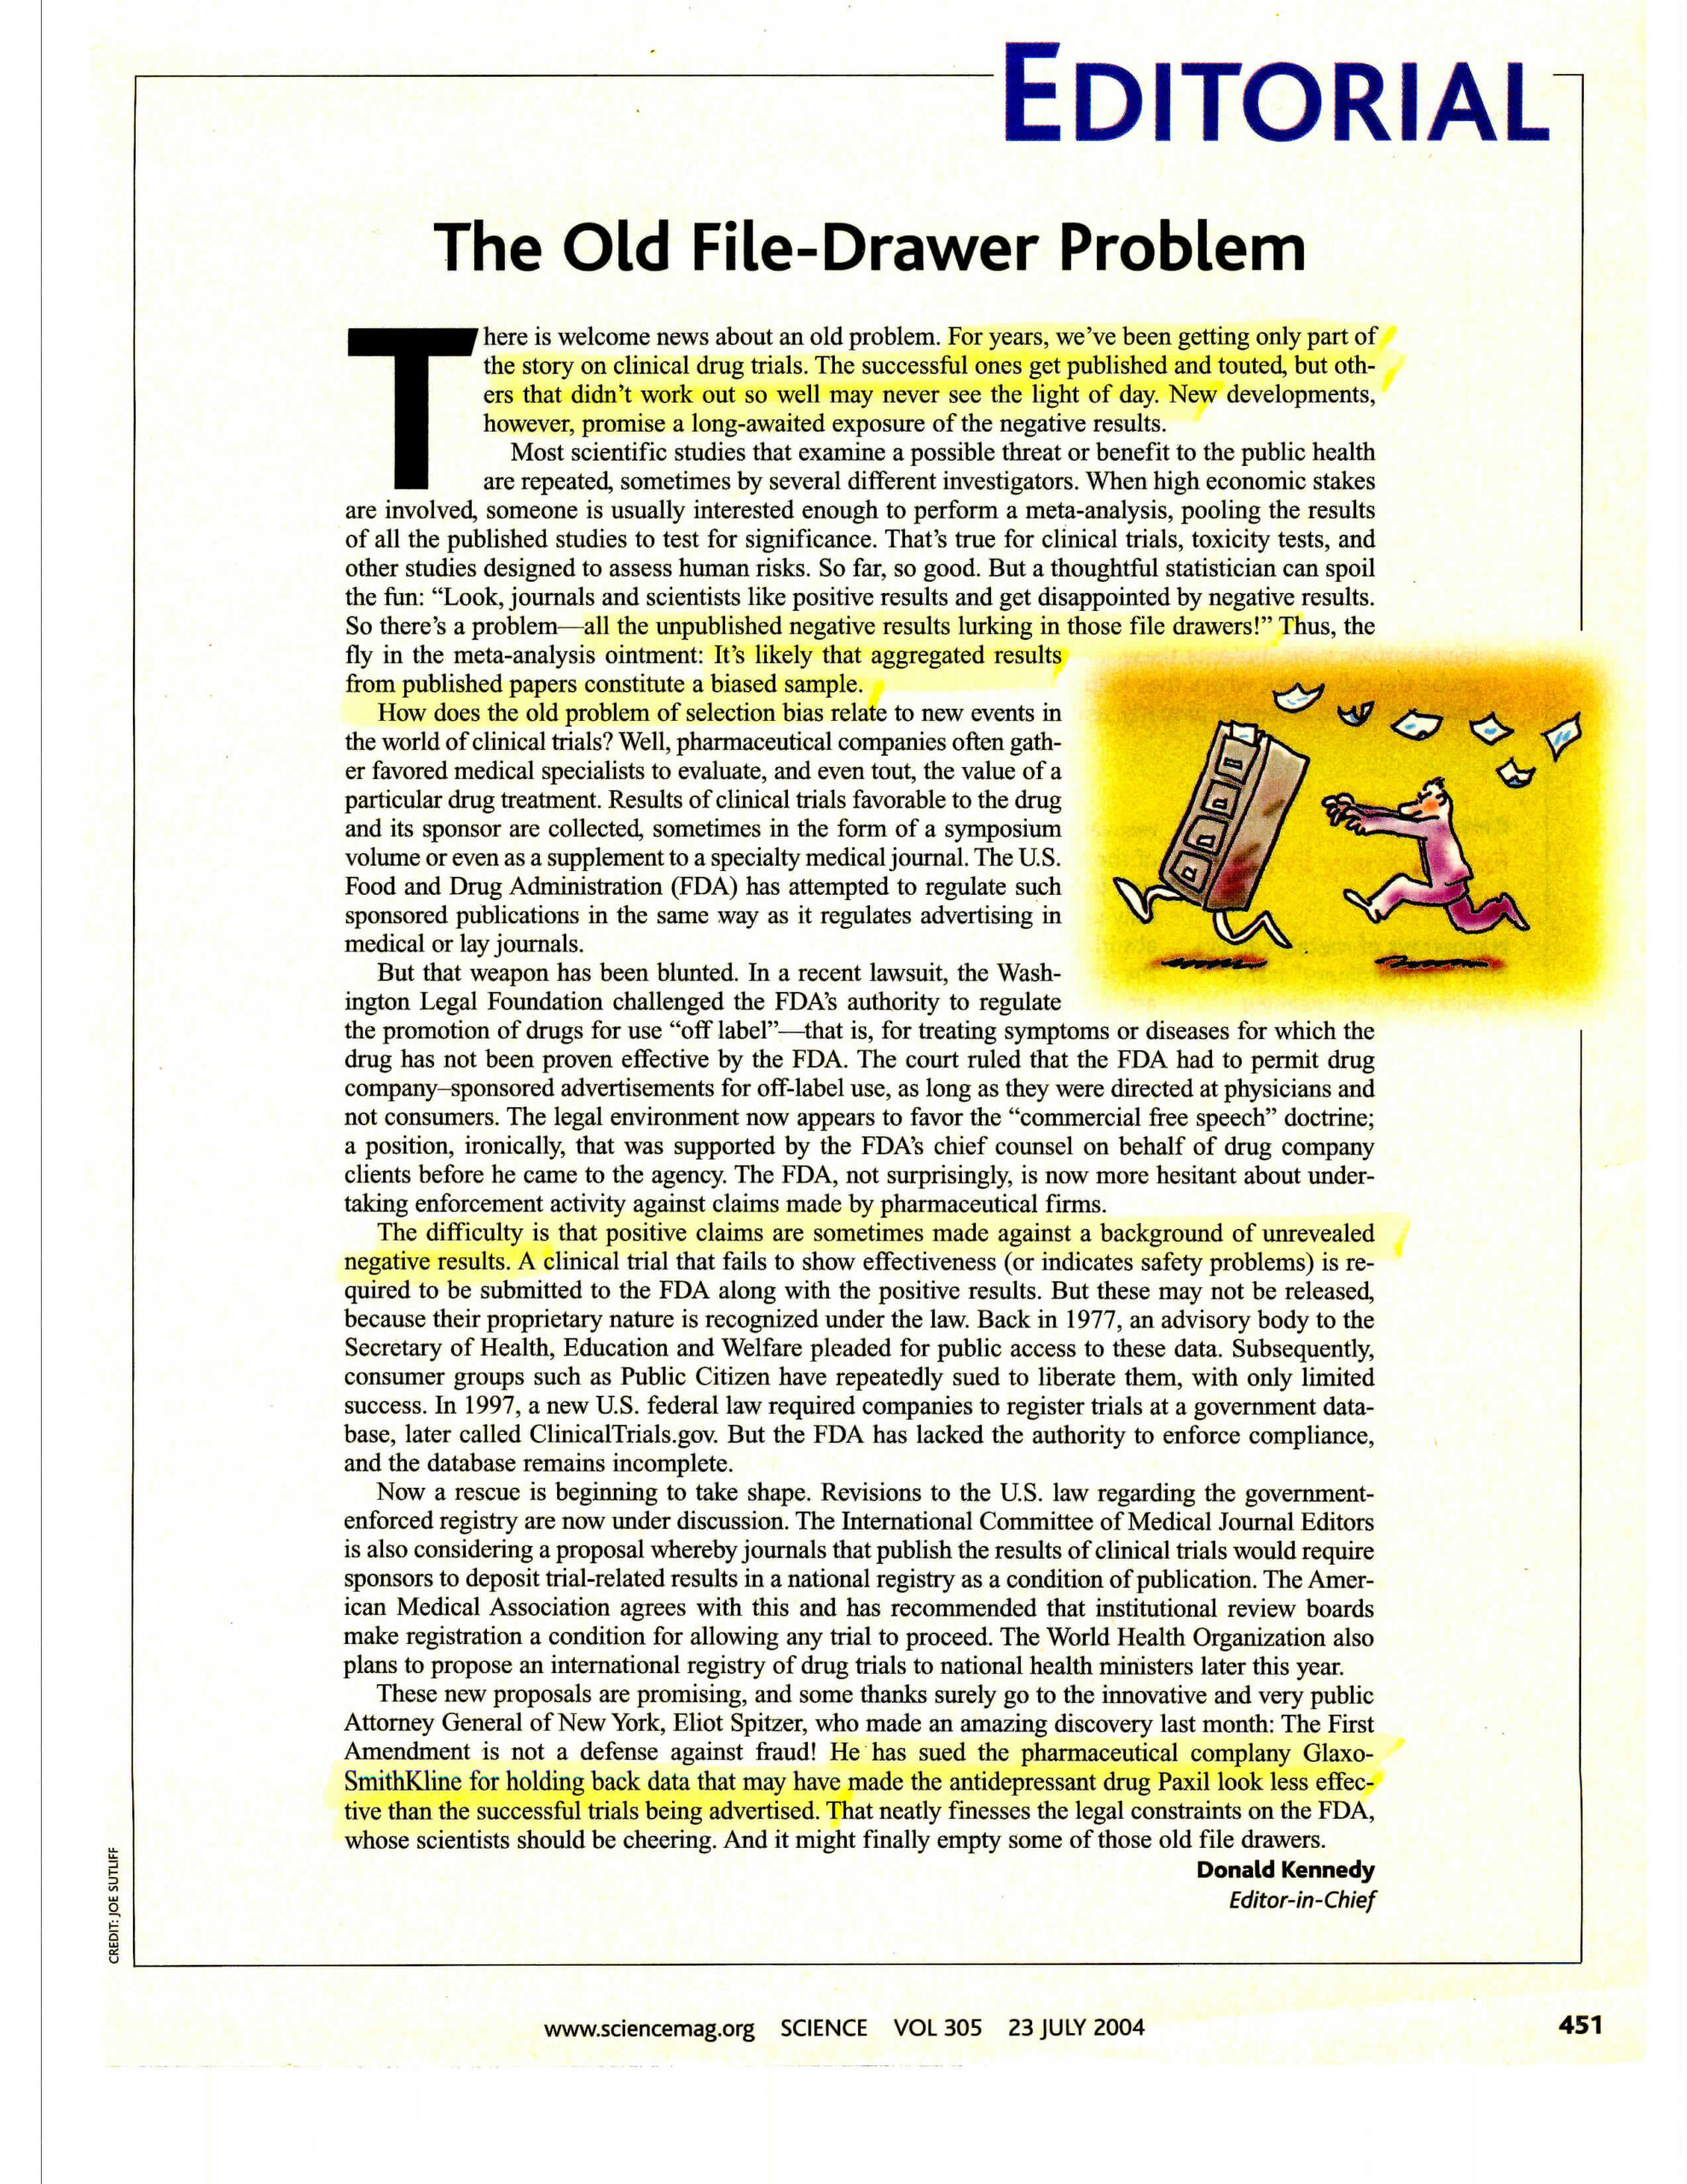
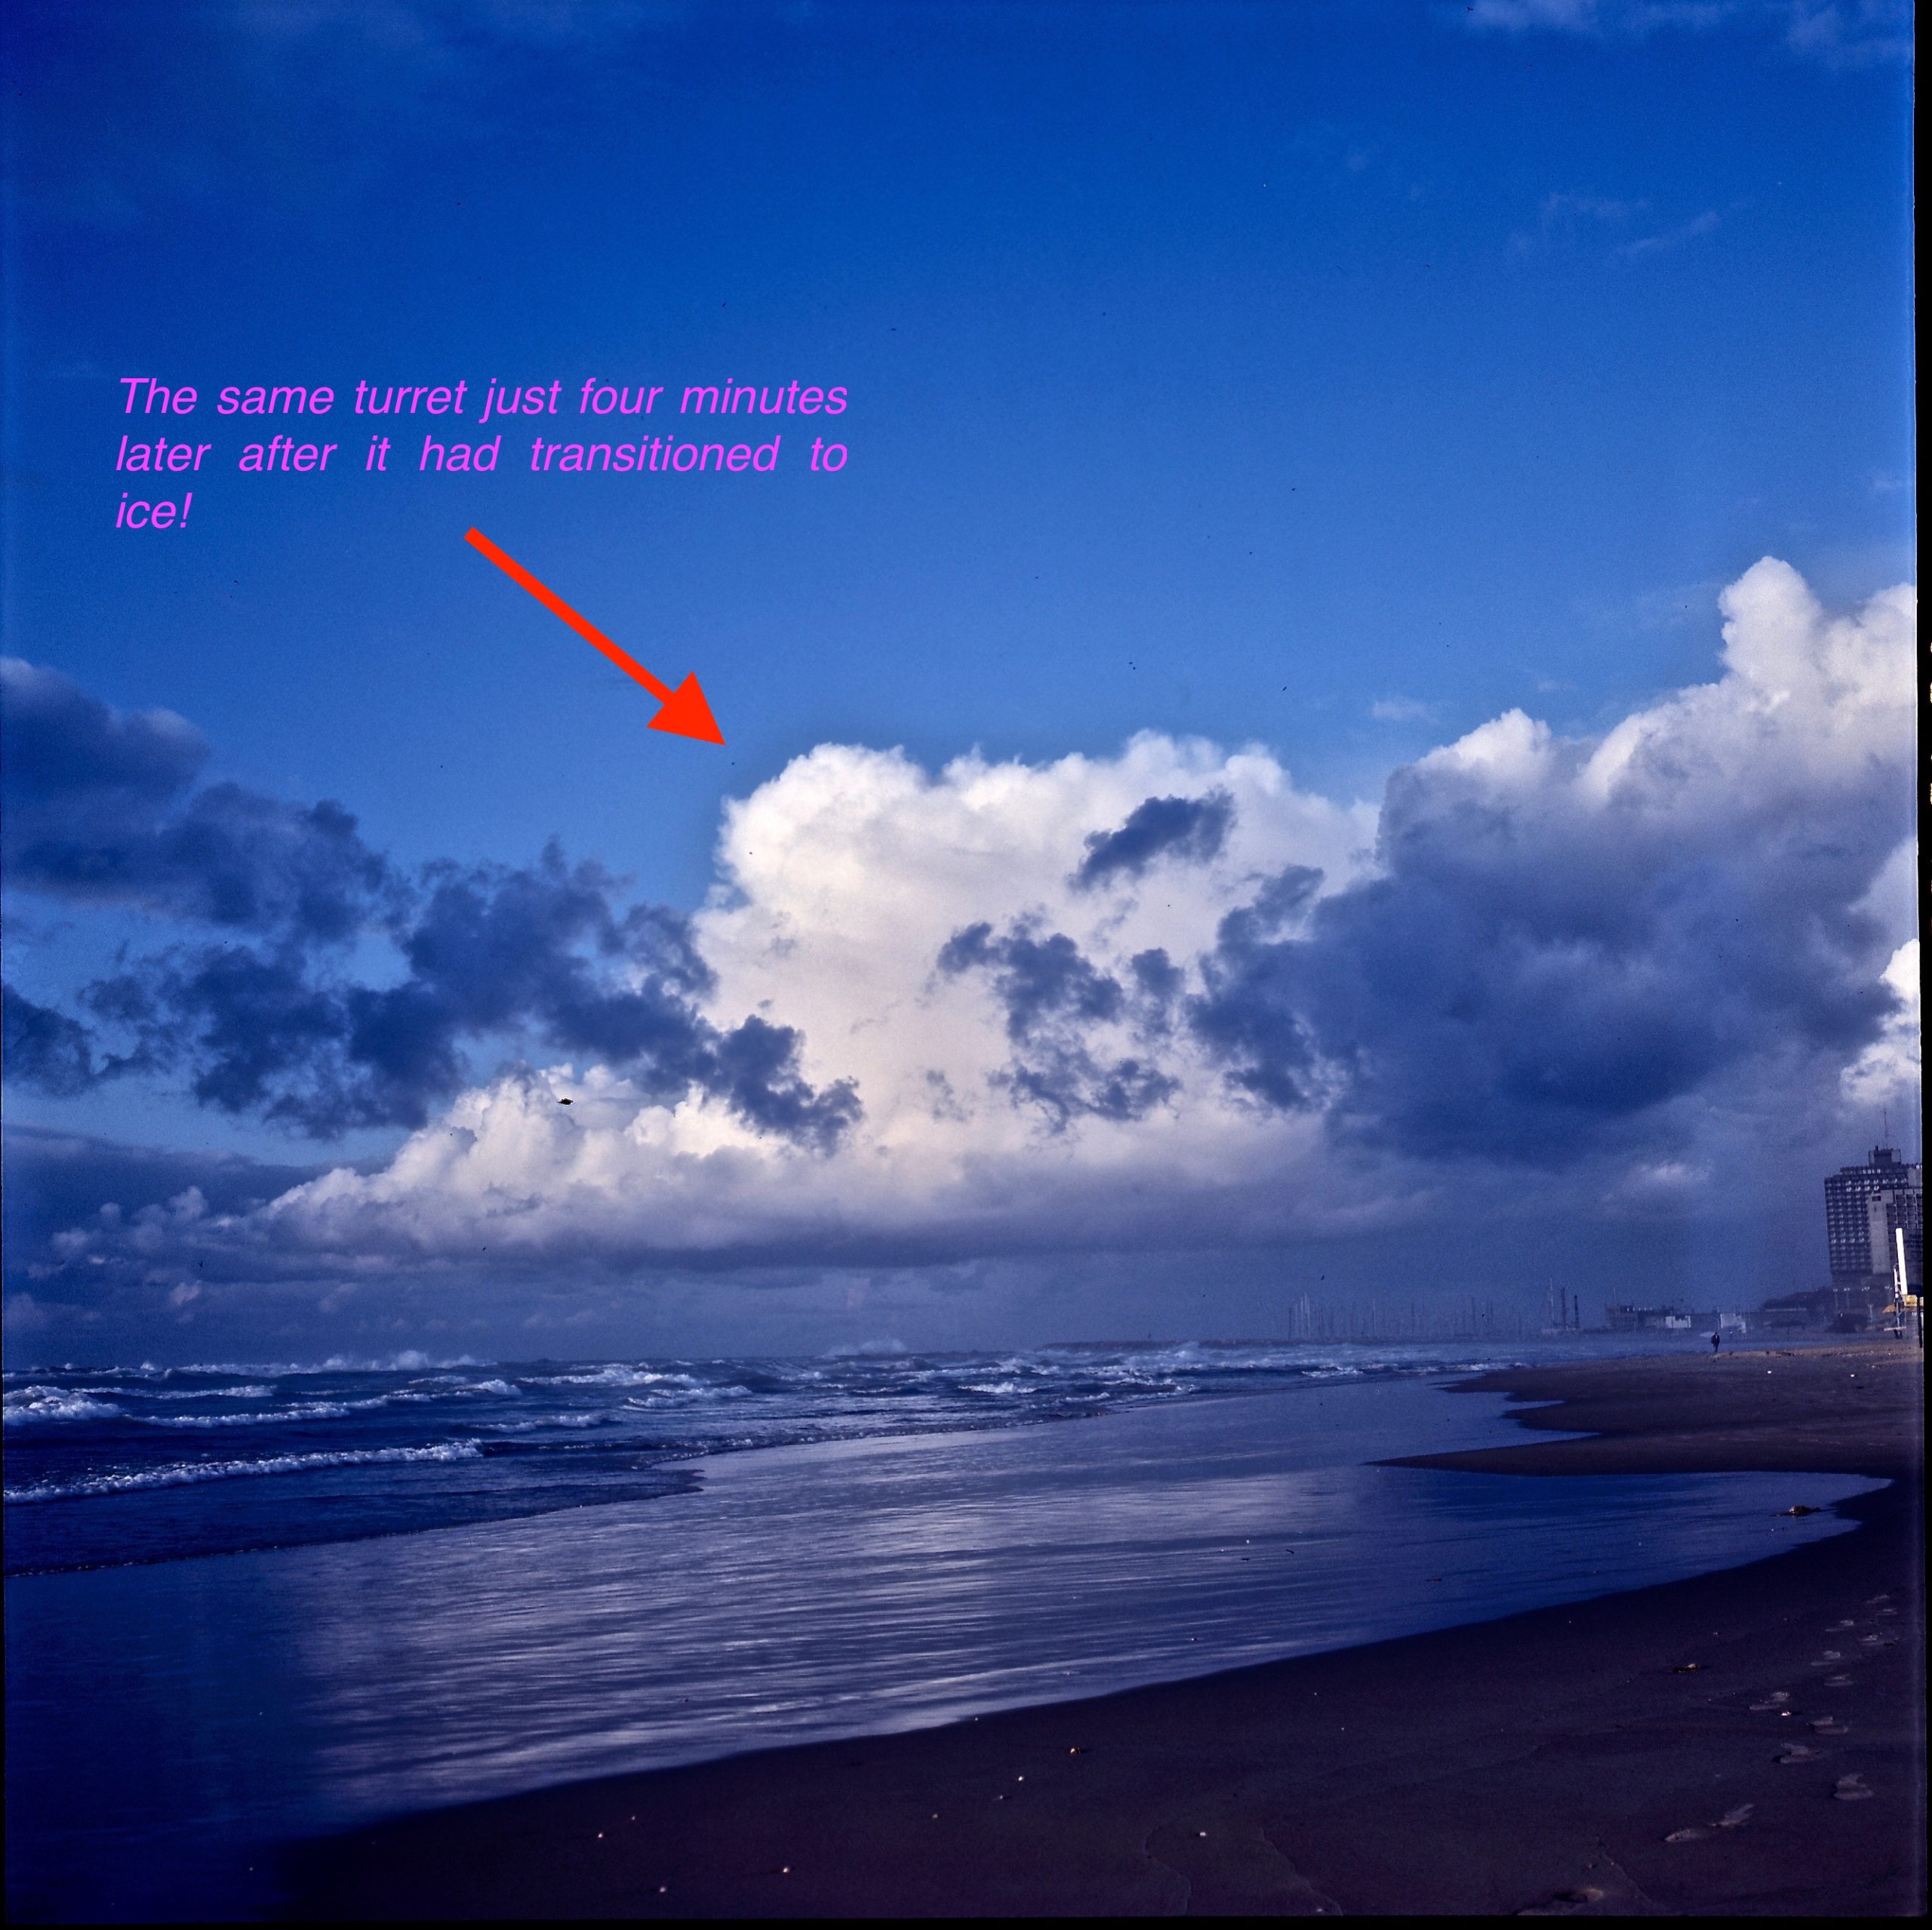