Here’s a nice little example of how the weather computing models start to go awry fast when a little flummoxed when little DELIBERATE errors are input into them as they start their northern hemisphere data crunch (below, from the global data ingested at 5 PM AST yesterday). Us folks here in Arizona and those in the Southwest US comprise one of two “centers” of the greatest uncertainty in all of the Northern Hemisphere, as shown below in the red and blue lines (selected height contours at 500 mb).
Model outputs and what they are predicting will go to HELL faster due to our “zone of uncertainty”. Chaos in action. Wiggle something here, and it falls apart over there and all over. This example is the contour forecasts for 5 PM tomorrow.
Valid for 5 PM AST Monday, February 4th.
Does this epicenter of uncertainty hereabouts mean we have a chance to get some real rain in the next 36 h?
No, but its great that you know about this uncertaity and how it plays out in the NOAA “ensembles of spaghetti”; useless-in-some-ways-knowledge, absorbed just for the sake of knowledge.
The uncertainty illustrated above is associated with a upper level wiggle in the winds and exactly how that will play out as that wiggle moves toward us from the NW today. Its a little baby trough in the upper air flow that the model is uncertain about but it is too weak to have much affect on the big cloud mass that will be drifting over us today, that cloud mass originally from a location about halfway between the Galapagos and Hawaiian Islands. These are real tropical clouds over us today, and they’ll be piled in layers (Altostratus, Altocumulus, Cirrus, Cirrostratus) over us to more than 350,000 feet!
Range of amounts here in Catalina: ZERO on the bottom to 0.10 inches, tops.
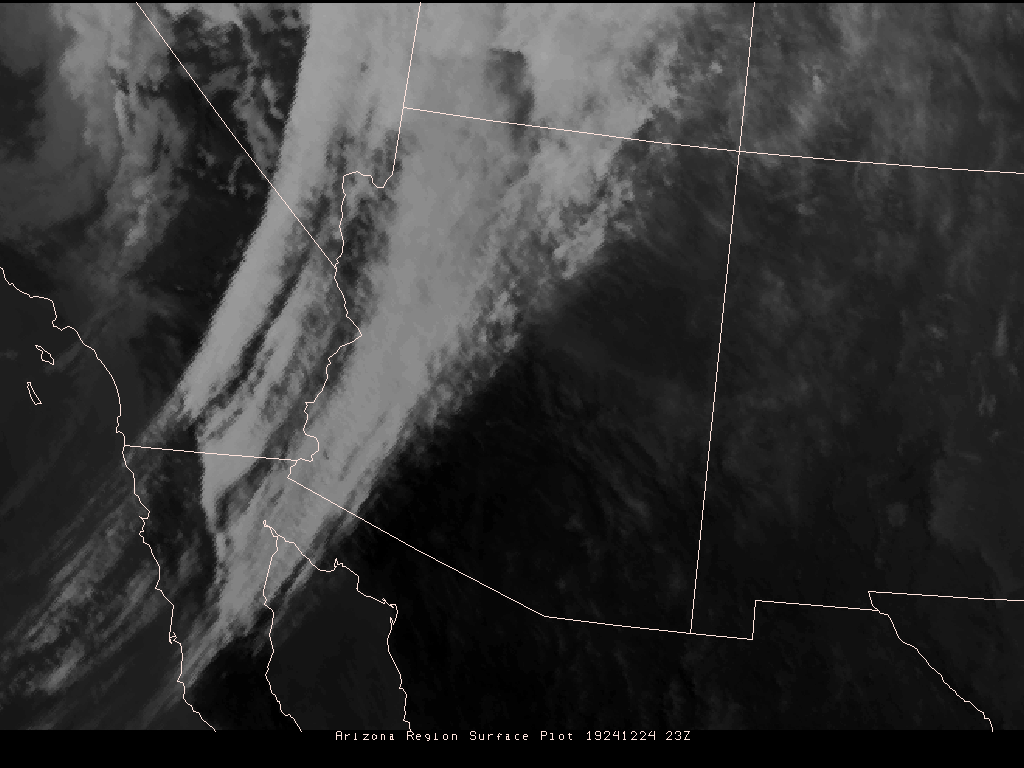
Below is an example (full set here) of what the Beowulf Cluster from the U of AZ sees in the moisture overhead at 3 PM local time (in other words, during the 84th hour of the Superbowl pre-game show). I realize that many of you will not be able to go outside and look at the sky at any time today due to this historical sports emergency, and so I will tell you something now about what you likely would have seen had you gone outside, perhaps even missing an equally historic commercial break of some kind:
Forecast sounding for 3 PM AST today, an hour before Superbowl kick-off.
What does this mean?
Weird clouds, most likely. Scoop clouds, concave (downward) looking cloud bottoms. Some areas of the sky might look like ocean waves upside down, “undulatus” clouds (we had a short-lived Ac undulatus yesterday to the NW of Catalina). Clouds with waves on the bottom. The bases of our tropical clouds are likely going to be in a “stable layer”, one where the temperature remains the same as you go up. It would be located just above the top of Ms. Mt. Lemon. Along with that stable layer, and is always a part of them, is wind shear; the wind turning in direction and speed as you go upward from just below this stable layer to above it.
Stable layers and wind shear produce waves, not ones always seen since the air is often too dry for clouds, but in this case, they should be visible. Could make for some interesting cloud shots this afternoon and evening. Here’s a risky example of what I think is likely, though with too much virga falling from above, they won’t happen, hence, the risk in a cloud detailed forecast:
An educated guess about how this afternoon’s cloud bases will look. There’s likely to be much more cloud cover, however, than is shown here.
Yesterday’s clouds
Lots of contrails overhead yesterday, an unusual number. Really, we are SO LUCKY not to have many days like this, kind of a sky pollution, though at present, an unavoidable one. Just be glad we don’t live right under a main, well-traveled airway (though, with predictions of a doubling of air traffic by 2020, we are likely doomed to more days like yesterday when Cirriform clouds are present).
“Hanging virga” materialized yesterday, starting from a cluster of late morning modest, but very cold, Cumulus clouds that transitioned to soft and small Cumulonimbus clouds as they approached the northern parts of Catalina, Charoleau Gap and Oracle yesterday.
How cold were those clouds?
Bases were at 10,000 feet, just above Mt. Sara Lemmon, at about -15 C (4 F), a real bottom temperature rarity for southern Arizona Cumulus clouds. The highest tops, probably only reached 15,000-16,000 feet above sea level and would have been close to -30 C (-27 F), also exceptionally cold for such a low top height. So, the clouds, for the most part, were less than 2 km (6,600 feet) thick. At times, they appeared to be miniature summer clouds with all the glaciation and “shafting” going on. Here are some shots:
10:25 AM. Small Cumulus begin clustering NW of Catalina. No ice evident.10:41 AM. Same cluster, but deeper, drifting east toward Charoleau Gap-Oracle. An ice plume can now be seen streaming to the east from one of the taller clouds. When clouds are this cold, and small, only a few of the “lucky” largest ice crystals may fall directly out below the base, while most float off to the side as here. If you were a skier up there, you’d call it “powder snow”; lots of single crystals rather than flakes.
Remarkably as cold as the bases were (-15 C), nature abhors starting an ice crystal until a liquid cloud drop has formed. So, the sequence goes like this; liquid droplet cloud forms (as in our smallest Cumulus yesterday, “humilis”), but then they must develop further to produce ice. There is a temperature AND drop size threshold requirement for ice formation, even in clouds this cold. As the clouds fatten upward, the drops in them get a little larger, and at the same time the temperature drops, too, and, voila, the ice-forming criteria for that day are met, and out pop the ice crystals. Those depth/cloud top temperature criteria change some from day to day.
And, as you likely noticed and wrote in your weather diary, those cold, but shallowest clouds yesterday did not produce ice, while ones that got a bit colder and fatter did. Most of the time, low-based clouds that reach just -10 C to -12 C begin to produce ice, and even at higher cloud top temperatures in the summer on occasion, the latter, a LOT of ice at cloud top temperatures warmer than -10 C.
There’s the enigma. How’s come yesterday’s tiniest clouds, with bases at -15 C, did not produce ice immediately? What is it about those itty bitty first formed drops that makes them so resistant to freeze? Surface tension? This kind of result for small cold clouds was found repeatedly in our aircraft studies at the U of WA.
11:29 AM. I looked to the sky for answers about ice formation, but it didn’t seem to know either.
11:04 AM. The same cluster continues to expand and deepen with lots of “hanging virga” just beyond CG, and in the distance.
Before the vast mid-afternoon clearing (associated with that passing trough /wind shift line above us), there was another complex of glaciating modest Cumulus and Cumulonimbus clouds with significant virga that went over the same area as shown in these photos. No doubt, someone got a flake or two, or more likely, a tiny ball of graupel (soft hail).
1:56 PM. Tiny non-ice producing Cumulus looking toward the SW. Notice the lean of the tops of these little guys toward the left, or toward the SE. They show that the winds have veered from westerly to northwesterly since the morning hours, this veering associated with the passage of the trough over us. When you see that lean in that direction, its pretty much over (the chances of precip).
By mid-afternoon, it was “all over” as the Cumulus dwindled to tiny versions, with no ice, and ultimately disappeared within two hours.
And with the clearing skies late in the day, the plummeting temperature. Was 31.x F by 7 PM, but just after that, the “sliders” started, as they usually do here on a little hillside, and the temperature pretty much leveled out and has briefly hit 28 F. In the meantime, just down the road, its 21 F in the Black Horse subdivision! The CDO wash would be even colder if we had a measurement there.
You can see our regional temperatures here from the U of AZ, and the more local ones here from Weather Underground, now owned by The Weather Channel and they better not screw it up any more than they already have re radar depictions (they don’t work as good.)
The weather just ahead?
More little troughs like yesterday, such as one passing over us today, and later tomorrow, likely to again to be ones, especially tomorrow, bringing a few small Cumulus over us in the afternoon, some of them shedding ice. We already have some ice clouds, low Cirrus, today, and along with those, maybe a flake or two of Altocumulus. It’ll be pretty scenic again.
Then The Warming, a vast and an amazingly quick change in the flow pattern that warms us up during the middle of the coming week. And, no rain indicated in mods for next 15 days, though as always, there is hope in the final few days that it will be wrong. More on that way down toward the bottom.
Some newsworthy weather is farther ahead…
There is something that will happen that you’ll read about, extreme cold in the East, 8-12 days out. This happens as a gigantic storm-blocking ridge piles up along the West Coast, all the way into Alaska. In these situations, Pacific storms are diverted to Alaska where the folks up there think its comfy with all that marine air blasting into them from the ocean, but then, that air turns cold over the continent and streams down into the US akin liquid nitrogen rolling down the side of Mt. Lemmon.
Why even talk about this when its so far out in the models, since they are often a joke that far out?
You do it, stick your neck out, because of how POTENT the “signal” is in the NOAA “ensembles of spaghetti” for this to happen. Besides, you might be getting a “scoop” as well, if the other forecasters aren’t on their toes.
A pattern of extreme temperatures over ALL of North America is just about certain. Check this out below. I’ve added some text on to help you know what to think when you see it. That’s what I try to do here; tell people what to think. Its great!
Valid 216 h from last night, or the evening of January 21st, AST.
The red arrow is up the shaft of a gigantic ridge, the one foreseen in the models lately. Note how special we are along the West Coast in this plot; there are no other protrusions of ridges anywhere in the whole northern hemisphere like this ours!
What is a ridge composed of? Deep WARM, comfy air. So a huge blob of warm air IS going to arise along the West Coast in 8 days. That translates to much warmer than normal temperatures practically from Alaska to here, probably a heat wave in southern Cal around this time.
At the same time, when the flow is disturbed like this, and has so much “amplitude” (goes north and south so much) like it shows here, that is, goes WAY to the north on one side of the ridge and then WAY to the south on the other, you get temperature extremes as you could EASILY guess. Extra warm over “there” somewhere means extra cold over “yonder” (in this case, the eastern half of the US.
Why do these coming temperature extremes have so much credibility?
Its because of the remarkably (to me) tight bunching of the lines (500 millibar contours), the way they are in the above graphic. This means the signal, the factors putting this pattern together are powerful, and have not been disturbed by the “noise” of the many small errors DELIBERATELY put into the model at the beginning of the run to get these differing plots. For 8-10 days out, these are about the “tightest bunching of lines” I have seen, meaning the forecast is robust; namely, is going to happen.
For us it means a further extension of droughty, but warm days that follow soon on the heels of our cold spell, into the 20-25th of January.
Beyond that?
As robust as the forecast is for 8-10 days out shown above, the models are pretty much clueless about how this pattern falls apart (not too surprisingly). To experience model cluelessness hereabouts, check this plot out below for 15 days away from the same computer run and notice the “out of phase” pattern being indicated. The gray lines show a trough in our region (maybe storms and cool), and the yellow lines, from a model run just 12 h later, last evening, shows a ridge over the West (warm, sunny weather indicated here). A forecaster, looking at this, and covering all the bases might say:
“Continued cool with variable clouds and showers today, otherwise mostly sunny and warm.”
That’s about what you get out of this last plot. Not much confidence.
Today, as everyone knows, will be the last pleasant day for quite awhile, so we’d better get out and enjoy it if you can, maybe call in sick. Likely to be a couple of AZ low temperature records set over the next week.
The skies will be great today, as they always are with some clouds present, and for a few days afterwards in the cold air with those deep blue skies along with passing Cumulus clouds, that at times and even though they are shallow, will send some virga down as the colder parts of the troughs go by. Should provide for some nice late afternoon and evening photo ops in the days ahead.
Today the satelllite imagery plus looking out the window, shows lots of Cirrus clouds today, probably devolving into dense, shady Altostratus at times. And a scenic, Altocumulus lenticularis cloud1 downstream from the Cat Mountains is pretty much a lock.
Also, in the progression of clouds today, we will probably see that clear slot that so often separates the middle and high clouds from the low, frontal clouds go by. If the timing of that clear slot is right, could be an extra special sunset.
Some Cirrus from yesterday, another one of those rarer days with virtually no contrails in the Cirrus, followed by a nice Catalina sunset:
2:36 PM. Cirrus fibratus (pretty straight fibers) looking NW. Note lack of contrails.5:45 PM. Cirrostratus fibratus (has streaks) with what looks to be a lower Cirrus uncinus (upper right and in the distance).
Rain, from the U of AZ mod run at 11 PM AST, has the rain beginning tonight after 10 PM AST and lasting but a couple of hours. Amounts here in Catalina, between 0.10 and about 0.40 inches, average of 0.25 inches, virtually no change from what was predicted 24 h ago.
Just about everything mentioned yesterday is the same today in the model, marginal cloud top temperatures for precip at the TUS site for most of the time the front goes by (in the model), but cloud tops will be colder over us and more likely to precip.
Seems temperatures will be marginal for ice-in-rain drops at the ground here since the much colder air will not arrive with the front’s very narrow rain band but encroach as it departs.
Also of some interest, the jet core at 500 mb is shown to become bifurcated with one branch overhead S as the rain moves in (another branch over NW AZ). This would be compatible with a rule of thumb about the rain and the jet at 500 mb. Rain, with extremely rare exceptions (<5% of the time), does not fall here on the southeast side of a jet stream racing to towards the NE, as we will have over us today. Will be curious to see if this “rule” holds up this time.
Tomorrow will be one of those cold days with spectacular small Cumulus clouds contrasted against the deep, dark blue of the winter sky. Should be some great scenes of light and shadows on the Catalina Mountains.
Snow ahead?
Snow falls here later in this cold, almost week-long episode, as a series of troughs plunge southward along the West Coast to AZ. Most likely day for some snowfall in Catalina, is now on the 14th2. Here’s the map for that, valid for 11 AM AST, Monday, from IPS MeteoStar:
Green areas denote those regions where the model has foreseen precip in the previous 6 h.
The weather way ahead–Dr. Jeckyl or Mr. Hyde?
Check out these bowl of rubber bands from “flapping butterfly wings” (slight perturbations put into the initial data ingested into the WRF-GFS model after which its re-run a number of times to see what slight differences do). The first one below is for the evening of January 20th, a real laugher considering its only 10-11 days away now and the mods are still clueless.
Note the yellow lines, a “control” run from last night’s 5 PM global data, and see how they BULGE toward the north over the western half of the US. Then look at the hard-to-see gray lines representing a “control” run from just 12 h earlier, that from yesterday’s 5 AM AST global data. They BULGE southward, the opposite way the yellow lines do.
The yellow lines indicate a huge ridge over the West, with little precip and seasonal temperatures in the SW US. On the other hand, the 5 AM control run shows a continuation of our present storm pattern and continued injections of cold air down the West Coast. Check out that gray line over northern Cal, for example.
So, from one model run to the next lately, our weather toward the end of the month in Catalina has gone from “yawn” to “yikes” (the latter blurted out yesterday when I saw that 5 AM output and all the storms it had). But blurted out a “yawn” when viewing the output from last evening. No precip after the cold week.
However, in deciding which of those two outcomes is most likely you have to dwell on the predominance of those blue lines that also bulge northward and are mainly located in southern Canada. Those strongly indicate that the “highs” , the bulges to the north over the western US, will prevail on the 20th, not the storms and cold weather with them.
Arrow points in the general direction of Arizona.
But how about after the 20th, at the very end of last night’s model run 15 days out? Now you see BOTH the yellow and the gray lines are bulging to the south (creating a trough bowl), AND, more importantly, those blue lines are not constrained to southern Canada, but are all over the West as well. Remembering that the atmosphere remembers suggests that the models are remembering, too, trying to regenerate the kind of flow pattern we’ve already been experiencing after a significant, quite pleasant, really, break from the cold week.
While this last panel is also a real laugher in many ways, due to all that uncertainty that’s indicated, the wildness in all those lines, you might want to hop off the fence in a longer term forecast toward the end of the month by thinking that what we’ve been having will return, a sort of “Back to the Future.”
Re-inforcing this view is how the red lines (570 dm height contours), usually on the periphery of the jet stream, become more compacted in the LATER, second plot compared with the first! This is a little remarkable since that would suggest the models have a better handle on the circulation pattern at 15 days over 11 days. Odd. Note, too, that those lines at 15 days are FAR to the south of AZ, supporting the idea of a cold trough in the SW.
———————————
1These are the almond shaped clouds composed of droplets with smooth, sharp edges that hover over the same spot, expanding and shrinking, sometimes for hours at a time, as the grade of moisture changes in the air being lifted behind the mountains.
2Personal aside: Have friend, former WA State Climatologist who also worked at the U of WA as I did, arriving here with his wife on the 12th for a vacation from the dark days of wintertime Seattle. They will be here for the whole cold week and possible snow as it turns out, and then go back. Having looked at the progs, he now wants to take a “vacation from his vacation”, maybe head off to Costa Rica after arriving in AZ!
Backdoor rain? Looks like any chance of rain will happen later this afternoon through overnight as mainly mid-level clouds twist around our low from the east. That low is now over Yuma, AZ, and the center will pass to the south of us tonight. We don’t see that happen too often. Here’s a nice loop of the circulation around it, also showing the radar echoes–very handy. (Some cloud shots at the bottom, way down there.)
Right now, our low is looking pretty dry, not much going on in it, or around it right now, and so any rain falling from mid-level cloud bands, like Altocumulus (with virga) and a likely deep band of Altostratus (also with virga), will be pretty light; sprinkles to maybe a hundredth or two. The better part of this is that with mid-level clouds coming from the east, they won’t be much dissipated by the air going downhill from the Catalina Mountains as you would expect with low clouds. However, in Mexico, since it is so cold in the center of this low, there will likely be reports of snow in unusual places, as in the last storm. The U of AZ Beowulf Cluster model, the best around for us, sees only a brief, fairly close call for rain tonight.
Still, while this low passage will be a little disappointing as far as rain goes, the skies will be great today with scattered Altocumulus, likely with a little virga, and scattered Cirrus, with a great sunset. Both of these cloud types can be very “photogenic” on days like this. Likely those mid-level clouds will clear out tomorrow morning, so get’em while you can. If you don’t, of course, this compulsive cloud photographer will.
Full cold ahead
Get ready for some terribly cold days just ahead, likely some snow in Catalina still, though the more moist Canadian model prediction for this storm has dried out overnight–tending to be more in line the with US models which have always had this cold wave as a light precip event. Precip is pretty much guaranteed here, and some snow probable in Catalina, but max and least precip totals from this storm have to be revised downward in view of the latest Canadian results. Minimum amount, 0.10 inches, max, 0.50 inches (was an inch due to how much offshore flow the prior Canadian models had the night before last). So, most likely amount is between those two extremes, or about 0.30 inches with precip beginning during the day on the 11th.
A further disappointment is that the mods now see this storm as a quickly moving event, and the precip is over by evening on the 12th, so it ends up as just a 24 h period of rain and snow chances, most coming, of course, in the first segment, a line of rain changing to snow with the frontal cloud band and wind shift line on Friday, the 11th. Dang.
What about the second cold blast on the 15th-16th?
Still coming, but this wiggle in the jet stream shooting down at us from the northwest, has a trajectory toward us that is farther east than it was shown in the models earlier, and the farther east and the further away the trajectory is from the coast, the drier these cold pushes will be. So, that second blast of cold air, while still looking very cold, is also looking pretty dry right now; may only get a passing snow flurry, or we’ll just see scattered small Cumulus with some virga.
In these latest model runs the jet stream pattern that has led to our “trough bowl”, the favored location where storms have been collecting in our region for the past month, begins shifting to the east at mid-month, and what’s more, the amplitude of the north-south oscillations in the jet stream fade to a more west to east flow.
This very different than what was depicted just the night before last. Here’s what I mean. Shown below is the first forecast panel, high “amplitude” pattern in the jet stream–always associated with temperature extremes, cold where the jet dips down, like HERE, and warmer than usual where it shoots up from the southwest,for example, there in Alaska.
Valid for the evening of January 15th. An example of “high amplitude jet stream configuration associated with temperature extremes.
This is a very common pattern. You probably remember how warm it was in Alaska during the 1962-63, and the 1976-1977 winters, but how friggin’ cold it was back East when this kind of high amplitude pattern was pretty extreme and persisted for weeks: the jet racing into Alaska from the mid-Pacific, and then shooting south into the US. Really horrible times for the East in those winters.
But look at what the model sees for the end of the 15-day forecast period, shown below! The jet hardly has any amplitude, just shoots in from the Pacific in a west to east flow. That means no temperature anomalies to speak of, and a moist West Coast regime, sometimes with precip getting this far south, too.
Valid the evening of January 22nd, a Tuesday.
What does spaghetti say about all of these changes?
Its pretty clueless, that is, slight changes in the observations make a big difference in what happens, and that’s why its so wild looking in the Pacific and the US (shown below). This means you probably can’t count on the above pattern a lot, except that the amplitudes have gone down, that seems to be a pretty solid expectation. That jet surging into AZ could just as well be intruding into Washington State in a west to east pattern. That would mean that our 30-days of below normal temperatures here in AZ, beginning in mid-December (shown here by the NWS, lower right panel), are about to end after about a week to ten days, and with that, a long dry spell likely to set in.
Yesterday’s clouds
Mostly Altostratus, thinning at times to Cirrus, and late, a few Altocumulus/Cirrocumulus patches. Here are a couple of shots.
7:22 AM. Under lit Altostratus at sunrise. Those little pouches are regions of light snowfall (virga).1:49 PM. Boring, generic Altostratus translucidus, an ice cloud. Sometimes droplet clouds like Altocumulus are embedded in them, but none can be seen here (they would be dark, sharp-edged flecks). The massive clearing that occurred in the late afternoon is visible on the horizon. If you saw that clearing, it would have been a great time to tell your friends that, “Oh, I think it will be sunny in 3 hours.” It would have been quite a magical moment for you.5:36 PM. This beauty of a patch of Cirrocumulus undulatus (tiny granulations in waves) and a lump of Altocumulus (lower left). TUcson sounding indicates they were about 15,000 feet above the ground at -20 C (-4 F). No ice apparent. It happens.
(Note written on Dec 22nd! Something happened to the title I gave this previously, so its been titled now.)
Didn’t seem possible that such a fast moving storm could drop this much! Neither did the mighty Beowulf Cluster at the U of AZ think so much would fall here. But there it is, a great addition to December’s 1.34 total from the three prior days of rain, pushing our December total to 1.82 inches, just above the December average for Catalina of 1.72 inches (corrected).
Here are the ALERT system gauge reports from around the region at 5 AM AST. You will see that the Bridge at CDO Wash and Lago del Oro got more than here, 0.51 inches, quite unusual, even though its only a half mile a way. Its lower than here.
Don’t be fooled by all those low totals in the Catalina Mountains, that’s because the gauges don’t work when the precip is SNOW! Get your cameras ready for a spectacular, snowy Catalina Mountains scene this morning.
In all of this rainfall data you will see that our half inch is about the MOST recorded anywhere in the lowlands, which can be attributed to the type of storm and the flow it had, more west to southwest flow at cloud levels. That flow caused clouds to thicken up over the west side and up top of Catalina, helping to wring more rain/precip out of them than flow from the south at cloud levels.
In classic fashion, the temperature plummeted about 15 degrees as the front barged through Catalina at 2:30 AM AST, now at 38 F at 4:45 AM. Now (5:12 AM) that the rain has stopped–it will be a gorgeous, if cool day, the temperature is rebounding. Here’s this morning’s temperature trace, pretty dramatic:
The first recording rain gauge bucket tip last night here, indicating an accumulation of 0.01 inches, happening as the rain began to beat against the windows of the house, was at 2:07 AM. The forecast for the onset of rain from this keyboard yesterday was 2:08 AM. I hope nobody got wet due to an errant (semi-facetious) forecast…
Today?
Small Cumulus clouds, that’s it, a gorgeous day with fantastic views of the snow covered Catalinas, punctuated by passing cloud shadows. Doesn’t get any better than this!
Ahead?
More precip before the end of December. Christmas Day now a rain day according to last night’s model run. That run indicated it would be nothing extraordinary. But we reject that notion for the time being, that a storm on or about Christmas Day and later in the month will be more than just a run of the mill rain. This rejection based on our venerable “spag plots” that continue to indicate stronger storms than ordinary during the last week in December and early January. The thought here is that the run of the mill quarter inch or so rain indicated on Christmas Day is an outlier model run. More rain on that day will show up later….we hope! The superior Enviro Can model is make that Christmas Day storm look much more potent, BTW.
Yesterday’s clouds
What a pretty day it was! “Pretty Cirrus” again, then some Altocumulus perlucidus, finally Altostratus translucidus, shown in order below.
10:08 AM. Cirrus uncinus (hooks and tufts at the top) and Cirrus fibratus (gently curved fibers).
The surprise of the late afternoon, and one that strongly indicated that this front would produce more precip than expected, was the sudden obscuration of the peaks of the Catalina Mountains by Stratocumulus clouds around sunset. I couldn’t believe it, and it was a strong sign of a moist current ahead of the front. Still, I could not imagine a half an inch!
4:41 PM. 4:41 PM. The strong indication that last night’s front was going to be more potent as a rain producer; the sudden appearance of mountain-topping Stratocumulus clouds.5:33 PM. Holes in the Altostratus overcast beyond the horizon led to a few underlit rays that underlit the layer, resulting in a bifurcated color arrangement.
Pima County has a rolling archive of 24 h rainfall. Below under “Table” are those totals as of yesterday, at 4 PM AST, probably that 24 h period capturing the full storm. Here in Catalina, with another 0.21 inches after 5 AM, our 24 h total ended up at 0.96 inches; 0.98 inches at Sutherland Heights, 1 mi NE of this site. The most in our immediate region is 1.57 inches at Pig Spring just NE of Charoleau Gap. We seemed to have captured the most that this situation could have produced. ‘Bout time!
ALERT network Rain Table, 4 PM the 13th to 4 PM the 14th. Click “Table” to see.
After the steady rains of early yesterday the sky broke up into one reminiscent of a summer day with those cold Cumulonimbus clouds and dense rainshafts, and some spectacular rainbows. But some of our greatest beauty is when the sky breaks open and the clouds and shadows quilt the snow-capped Catalinas.
4:35 PM looking SE on the Catalinas and Pusch Ridge. An icy, pretty well glaciated Cumulonimbus cloud drops another inch or so of snow.4:34 PM. Simultaneously, another cold Cumulonimbus cloud and its last bit of trailing rain produced this luminary. Typically brighter rainbows occur when the raindrops are larger. The bow ends at the top because its snow, not drops. Its a nice graphic of where the snow level is.2:28 PM. Stratocumulus top the Catalinas and water-covered rocks glisten in the the brief sunlight (look above road).Also at 2:28 PM, farther north along the snow-capped Catalinas. So pretty.
1 PM. Example of the summer-like appearance of our cold Cumulonimbus clouds yesterday, this one over the city of Tucson.3:08 PM. Another summer like scene showing a “Cb” moving into the Oro Valley.
What’s ahead?
Today: Its raining now at 5:15 AM, what we would code as “RW–“, two minuses indicating “very light rainshower”, not measurable unless it continues for many minutes. (It didn’t.) Some might have called it a sprinkle, but if you’re really weatherwise, you would NEVER call it “drizzle”! C-MP (the writer) gets overly worked up when people call sprinkles, “drizzle.”
——small harangue—–
Drizzle, to repeat for the N+1 timeth, is composed of fine drops (less than 500 microns in diameter) that are close together and practically float in the air. Umbrellas are much good in even the slightest wind; forget about it seeing well if you wear glasses and your riding a bike with a baseball cap. A baseball cap can work pretty well in keeping your glasses free of drops in REGULAR rain composed of drops larger than 500 microns in diameter, mostly millimeter sizes, ones that fall rapidly, and don’t have time to get under your baseball cap unless its REALLY windy, or your going awfully fast.
—–end of small harangue—-
Now, where was I?
Oh, yeah… We’ll have passing light showers today, maybe a few hundredths to a tenth of an inch is about all we’ll be able to manage today; if everything was perfect, a quarter of an inch. Better check the U of A model….see if it agrees. Oops, not done yet, or is busted. Oh, well. We’ll continue to be north of the main 500 millibar current (see below), a necessary but not sufficient factor for rain here in the wintertime. Means the clouds will be cold and ice likely to form in them as the day goes on and what sun we have deepens them up a bit, as well as an enhancement as our weak, incoming trough goes by during the day. Anything is welcome!
Here’s the mid-day pattern aloft, from IPS MeteoStar:
Way out ahead
Its always exciting when you’re in a trough bowl, the location where the average position of one of the four or five waves (troughs) around the globe are. When you are in one of them, as we are, they function like storm magnets for your location. Individual storms head in your direction, usually from the west or northwest, “bottom” out in latitude, then “eject” out to the northeast. Our wettest SPELLS are characterized by the positioning of the average or “mean” trough in our location (“trough bowl” its been called here). Doesn’t mean that it rains everyday, but there always a new storm heading in your direction until the pattern changes and the “mean” trough moves somewhere else.
So, we got another rain chance on Wednesday, looks similar to this one, probably light, but then later, the models are suggesting a chance for more substantial rains associated with some very strong troughs that move in within the 10-15 day range, or from December 24-30th. Check out the size of this big boy on the morning of December 25th at 5 AM AST compared to what is passing over us today. Note how much farther off Baja the main, broad band of the jet stream is flow.
Valid, 5 PM AST, Christmas Eve. Look at the clustering of red lines in northern Mexico in this cropped version. This jndicates that the forecast of an upper trough in this area at that time is VERY likely, not certain, but I’d out money on it.
I wouldn’t bother getting you excited about something this far out unless there was some good support in the spaghetti. Below is a cropped version of that plot (the full one below), concentrating on our area.
Remember what Edward N. Lorenz, an MIT meteorologist asked in the title of a paper when he developed the chaos theory: “Predictability: Does the flap of a butterfly’s wings in Brazil set off a tornado in Texas?” (Thanks to the AZ Star for publishing this quote recently.)
So, in doing these “ensembles”, that is, running the computer models over and over again with slight errors deliberately introduced to produce these differing sets of lines in our “spaghetti plots, we are trying to see how different a forecast will turn out, with, figuratively, “butterfly wings” flapping around that we don’t know about.
If the lines don’t change at all from the original model run using the data that came in, then the forecast will be realized as it was first presented. If the lines look like a bowl of rubber bands (as they are below in the full plot for Christmas Eve), then the forecast is unreliable, subject to huge changes in time. But, those red lines south of Arizona are well clustered, indicating, figurotively speaking, that no “butterfly” is going to change it. So, troughs predicted in the actual run for that time period, are almost certainly going to verify.
In sum, watch for a stormy period around Christmas.
It doesn’t get any better for a desert in southeast Arizona than this; a model run with NINE panels of rain, including rain on Christmas morning, and here they are from last night’s 5 PM AST global data, our best computers in action. Remember the bad old days just a few weeks ago when no rain was foretold in the models for 15 days ahead, and that dry forecast was seen day after day for another 15 days?
Those days are gone. The “mean”, as in average position of, mean (as in bad, angry weather) trough is here now. You are in it. You can’t escape. “Trough bowl” in progress!” We’re going “weather bowling”! OK, enough exclamatory statements. This doesn’t mean every day is bad, but storm days will keep recurring beginning next Friday.
Here are a couple of those forecast panels from last evening, the first for Friday’s major rain about which a news release was released. This is so great. What’s even greater is that the Canadians, with their more accurate model, are on board for a big Friday rain, too! Two models with rain, as we know, guarantee a rain!
Friday morning the 14th at 5 AM AST.Also valid for Friday morning, the 14th at 5 AM AST. See lower right panel for rain areas over the prior 12 h.
Here’s another one on Christmas Day (left out some other rain days):
Storms will be dropping like bowling balls, one after another, like down a water slide, moving southeastward every few days out of the Pacific over the next two weeks, likely longer since once patterns get established they persist. In fact, “persistence” is one of our greatest forecast techniques, just saying what’s already been (say, cold and wet), will be what’s ahead. Its great!
An example of how you could have become quite the neighborhood weather guru last October and November. As a cloud maven junior, you would have already gained some prestige in your neighborhood. Now imagine adding to that status if your neighbors had come up to you in October at some point and asked about the winter. You would ONLY have had to have known about the weather you had already had for the past week or so to state, with furrowed brow, “I foresee much the same weather OVERALL as we’re having for the next two weeks, maybe a month” to your neighbors! And the majority of the time, you would be right! Think of all the right forecasts you would have made day after day in October, November, into early December!
This is because, as all weathermen and weatherwomen know, the jet stream and the storms it carries gets stuck in groves like the water in rivers for weeks at a time; but then suddenly jumps the banks into a new pattern. So, using retrospective forecasting techniques, your going to be right a majority of the time. To paraphrase so many internet ads, “this is a little known secret that weather forecasters don’t want you to know.”
But today you’d be so WRONG with that retrospective forecast technique! Change happens.
The “stream” is “jumping the banks” right now–some kind of tipping point has been reached somewhere and the new, cold and wet pattern is about to begin in the West, its just ahead beginning with that big rain here on Friday into Saturday.
But how do you know that one storm is the beginning of many, not just a breakthrough fluke in a continuing dry pattern? Confidence is added by having some spaghetti, not just examining the many panels of rain. Here, 10 days out, we are in the trough bowl! Little doubt about it; count on it.
And because our rains are associated with cold air invasions, there’ll be snow birds heading back to Illinois and Wisconsin pretty soon, wondering why they came to Arizona. Of course, the ski birds will be quite happy with the pile up on top of Ms. Mt. Lemmon.
What’s the real unknown here?
How much precip will our cold wet regime really bring? While we’ll have a number of opportunities for drought denting storms, they could also be a stream of minimal, relatively inconsequential ones. That’s the real bugaboo here in this monumental pattern change. The exact trajectories the storms take is going to be pretty unknown today. We could end up with frequent storms and cold days, but only average rainfall or even a little below after two weeks. Or, as in the first slug on Friday and Saturday, a total in one 24 h period that gives the December amount into respectable levels just by itself.
C-M has a gut feeling that we will see above average rains here over the next 30 days (two inches or more). “Gut feelings” are pretty worthless, but, there you have it.
Remember our logo, “Right or wrong, you heard it here FIRST!” :}
A day of pretty Cirrus and a nice sunset yesterday:
5:35 PM.
Now for some more of that Catalina climo, featuring December
(Most of these data below are due to the folks at Our Garden right here in Catalinaland just off Columbus._
First, the rainfall frequency chart for December. Not much going on. Chances of rain on any day about the same as any other, no trend up or down during the month, except for that one peak. Below this chart, in the monthly averages for the October through September “water year”, you’ll see that the average rainfall has jumped up considerably in December from November. Yay!
But will it rain at all in December 2012?
Let’s check…and also look, just for the HECK of it, whether any trough/storm is headed here in the 11th-13th rain frequency peak shown in the first plot…to see whether the atmosphere “likes” to have a little rain in Catalina in that time frame this year.
Below, the USA WRF-GFS model output, again rendered by IPS MeteoStar, from the global data taken at 5 PM AST valid for Monday, December 10th at 5 AM (close enough):
Astounding! A strong trough with rain IS predicted in about that time frame where the chance of rain in our 35 year record peaks, though a bit early. If this map verified, rain would be ending at about the time of this map, 5 AM AST on the 10th, it would be very, very cold, probably in the upper 30s in that rain. Amazing.
But let’s check with the superior Enviro Can model from the Canadians, our friends to the north, because-its-built-on-the-Euro-model-where-they-have-more money-for-big-computers-and-better-models-than-we-do.
Not even close to the prediction by the USA model!
Unbelievable difference, in fact. In the USA model, the apex of the trough is over us in Catalina and in the superior (or will it be?) Canadian model, its over the “‘Braska” Cornhuskers, Lincoln, NE, maybe ONE THOUSAND miles farther east!
Unbelievable2. This is a phenomenon, BTW, which does happen from time to time, that is called, “model divergence”, to put it mildly.
The NOAA spaghetti factory, which I have annotated for you below:
Outstanding forecast reliability is indicated in the Pacific, off Asia, but who cares?
Sadly, only mediocre reliability indicated here in the Great SW USA, as shown in the wanderings of the blue lines.
But will a trough be close to us?
Pretty much count on that because so many blue lines feint to the south in interior of the western US. I think we’ll surpass the Canadians this time…
There’s still a chance of rain on the 9-10th, but its pretty slim. Having cold air invade us, to varying degrees is pretty much guaranteed even if sans rain because that nearby trough will drag cooler air this way as it goes by.
Its the AMPLITUDE that matters here, and in our USA model, that is not so well known. In fact, the blue lines, with so many of them north of us are telling us that the actual forecast map from last night’s global data is an outlier model run; can’t count on it. It will likely come and go on the future model runs.
OK, there are a lot of graphics and discussion today, much of it unnecessary as usual, but there it is. We’ll begin with yesterday….not today.
Yesterday morning’s WRF-GOOFUS run once again had rain in Arizona/Catalina area. Was heartened since the prior 24 h’s predicted rain had disappeared in the three runs after that. Here’s what came out YESTERDAY morning for Wednesday the 12th. Cool, eh? Below this map is the corresponding upper level map.
Valid for Wednesday December 12th at 5 AM. Green areas denote where precipitation fell in the prior 12 h.Also valid for Wednesday, December 12th. Note how the jet stream at this level pours down from the Pacific NW into California and then across northern Mexico.
Then the same thing happened as the day before, that Catland rain disappeared again in the model runs up to last night’s. Not good.
But, I am happy to report that the rain is BACK, and why I am at this keyboard this morning. The very latest run, one that was conducted using the data from last evening at 11 PM AST is shown below with AZ rain again, this one valid for 11 PM AST on the 11th.
Now you might wonder why I would go through all these machinations to show you likely model illusions of rain here in the distant future, providing you only those ones that have rain here in them.
That’s because this is not about being objective, but rather SUBJECTIVE, really caring about rain here.
There is no way I am going to show you model outputs for our region that have no rain in them! I only show those ones that have what I want to have happen here, rain, and that’s why I show them. Its a very biased sample that you get. But its quite altruistic of me since any rain ahead MIGHT yet help the spring blooms that we ALL enjoy. So, by being subjective, I bring hope where maybe there wouldn’t be any. You can see I am really thinking of others in being so biased.
“What does the spaghetti say?”, you ask, as a person having a tremendous amount of weather perspicuity. “These outputs any good?”, you continue in a burst of meteorological eloquence.
Grudgingly, I am providing the NOAA “ensembles of spaghetti” map for the same time, December 12th. I’ve added an arrow in case you don’t know where you are.
Ensemble members valid for December 12th, affectiionately known as a spaghetti plot. Remember this crazy lines are due to deliberately putting little errors in the initial analysis to see how much difference they make from the real forecast that came out using the actual data. The wilder the lines, the less reliable the longer term forecast.
Now, the blue lines indicate more or less where the heart of the jet stream will be, the red lines, the periphery, or it when they are separate from the blue lines, a separate branch of the jet stream bordering the sub-tropics.
As you see here, the bulge toward the equator in the RED lines over our area strongly indicates that a trough WILL be here in the southern branch of the jet stream on December 12th. Often however, those troughs in that southern branch often only bring high or middle clouds; no rain. Need a bunch of blue lines down thisaway to get rain, and as you can see, MOST of the blue lines (“members”) are well north of us.
What to conclude from this?
That distant rain on the 12th shown repeatedly by a biased Mr. Cloud Maven person, would still have to be considered an outlier model run. But having said that, these spaghetti plots have been getting more supportive of a rain. Instead of a 5% chance, now maybe its up to 20%, based on the map above because some of the blue lines are beginning to be extruded toward Arizona.
—————
Weather coming up elsewhere in the US
BTW, in these model runs, one of the things that is a real eye-opener from the lastes run from last night is a gigantic mass of cold air that comes down into the Rockies after December 12th and affects most of the US. Awful for Christmas travel. Here’s a predicted surface weather map for December 15th, annotated to help you figure it out.
That mass of cold air is shown to move very rapidly into the US from the Arctic, and so the air will not be modified much by its southward movement–the configuration below is probably good for -40 F or even lower in Montana and some other high valleys in the northern Rockies. Hope you’re not traveling then…
Looks, too, like that icy air will be traveling over ice and snow until it reaches the US border according to this snow-ice coverage map from NOAA below. No wonder Canadians mass on the US border! Its apparent from this map! That will also keep that air relatively unmodified (keeping it as cold as possible) until it hits mostly bare ground in the good ole USA.
Some 8 days ago a spaghetti plot indicated with confidence that a “warm in the West”, “cool in the East” pattern would develop. Well it has materialized. Thanks to Hamweather, this chart shows the records set with that pattern so far. They’re not so numerous, but the forecast of a strong trough off the West Coast pulling warmer air north into the West and a trough in the East dragging down cold air from Canada has verified. The point of this is that those strange looking “spaghetti” plots can have some power if you’re not overwhelmed by all the lines.
————————-crass commercial break, just in time for Christmas————————————–
BTW, after learning about this spaghetti verification, you might want to consider adding to your collection of cloud maven junior tee shirts this new attractive—well, stunning really — “I love spaghetti” black Tee offering with a truly gorgeous multi-colored example of the NOAA-NCEP “ensembles of spaghetti.”
Here’s last night’s example from NOAA-NCEP to get you excited about getting that tee:
I think you’d look great in it, and, of course, most sophisticated when it comes to being a cloud maven junior and advertising that you know about something like this. Most people have never heard of these plots, which puts you ahead of masses.
Remember the “You are here” Milky Way Galaxy tee showing where the earth was? Well this one would be as good for you to be seen in as that one! And this new cloud maven junior tee is only $29.95 plus shipping and handling, which brings the total to $75.42. (I’ve been studying how the online vendors do it….)
Think of all the people you might meet that would ask you about your tee by saying, “Huh?”
Then you would go on a long spiel, making new friends, by pointing out areas on your tee where the signal is strong and the forecast reliable, and where the forecast model is clueless. In the above example tee, that trough north of the Hawaiian Islands 15 days from now looks pretty solid while things are pretty clueless in central Europe, roughly diagonal from the trough north of Hawaii. You know where Hawaii is, don’t you?
——————–End of crass commercial break————-
The weather ahead, way ahead…grasping for a switch to be turned on
A great pattern popped out yesterday. Hasn’t been seen since, but it was so exciting that I thought I would share it with you. We’ve been in a stagnant pattern for a LONG time now; storms racing across the Pacific into the northern half of the West Coast. As a weatherman, we’re always looking for the switch; patterns like that just don’t last ALL winter, but a tipping point happens, and boom, everything is suddenly different.
In this model run from yesterday, a tipping point happened and the storms began moving southward along the Alaskan coastline to off California in about 10 days. One of those is shown here near San Francisco. At this time in the run, December 15th, 5 AM AST, extensive rains are shown in Arizona!
While it might verify, there has not been support for this pattern since, and the ensembles of spaghetti, shown above, are not very encouraging, actually not at all, only suggesting a trough in the northern Plains States. A trough is suggested in the southern Rockies, and not a strong one at that since that trough is mainly confined to the red lines, those demarcating the periphery of the jet stream, or may even be a weak southern branch separate from the northern one. Usually doesn’t rain here with those.
But, this quasi bogus output looked so great, I had to post it anyway. I was so excited yesterday when it came out, because we know there WILL be a pattern change. There always is, even if its short-lived and isn’t a total drought buster. I guess this indicates a degree of desperation when you’re posting model outputs with little chance to verify.


