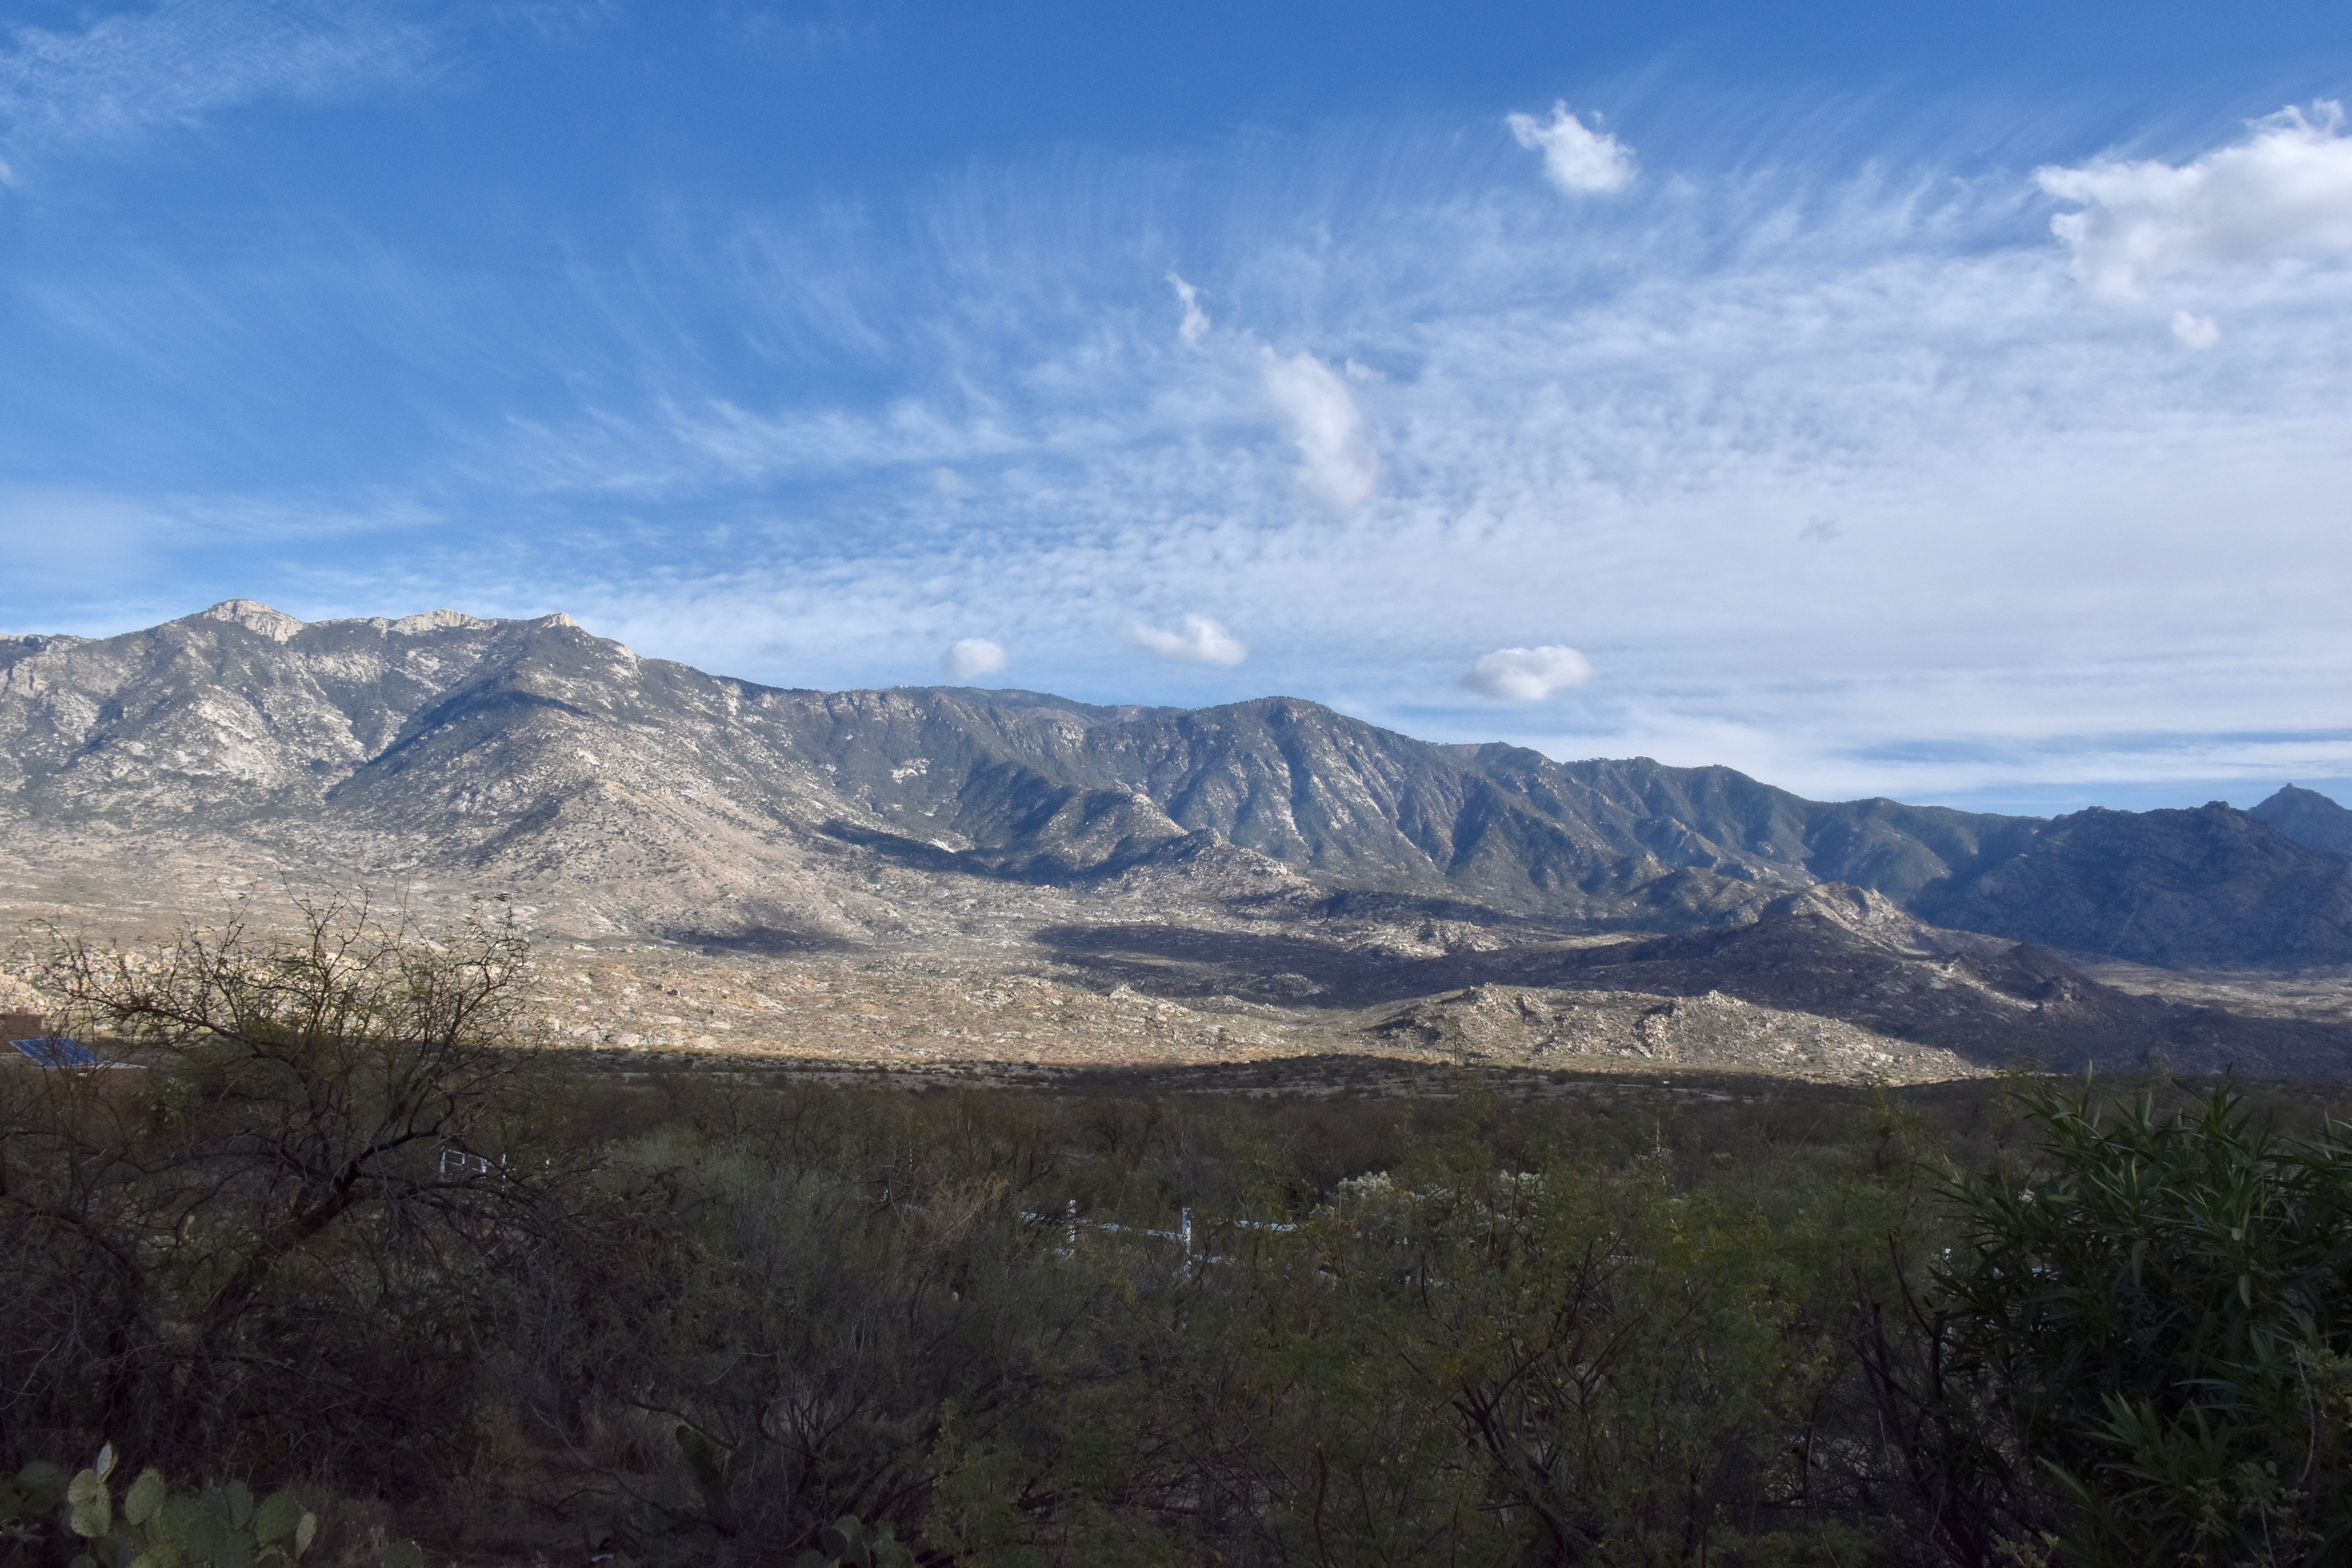
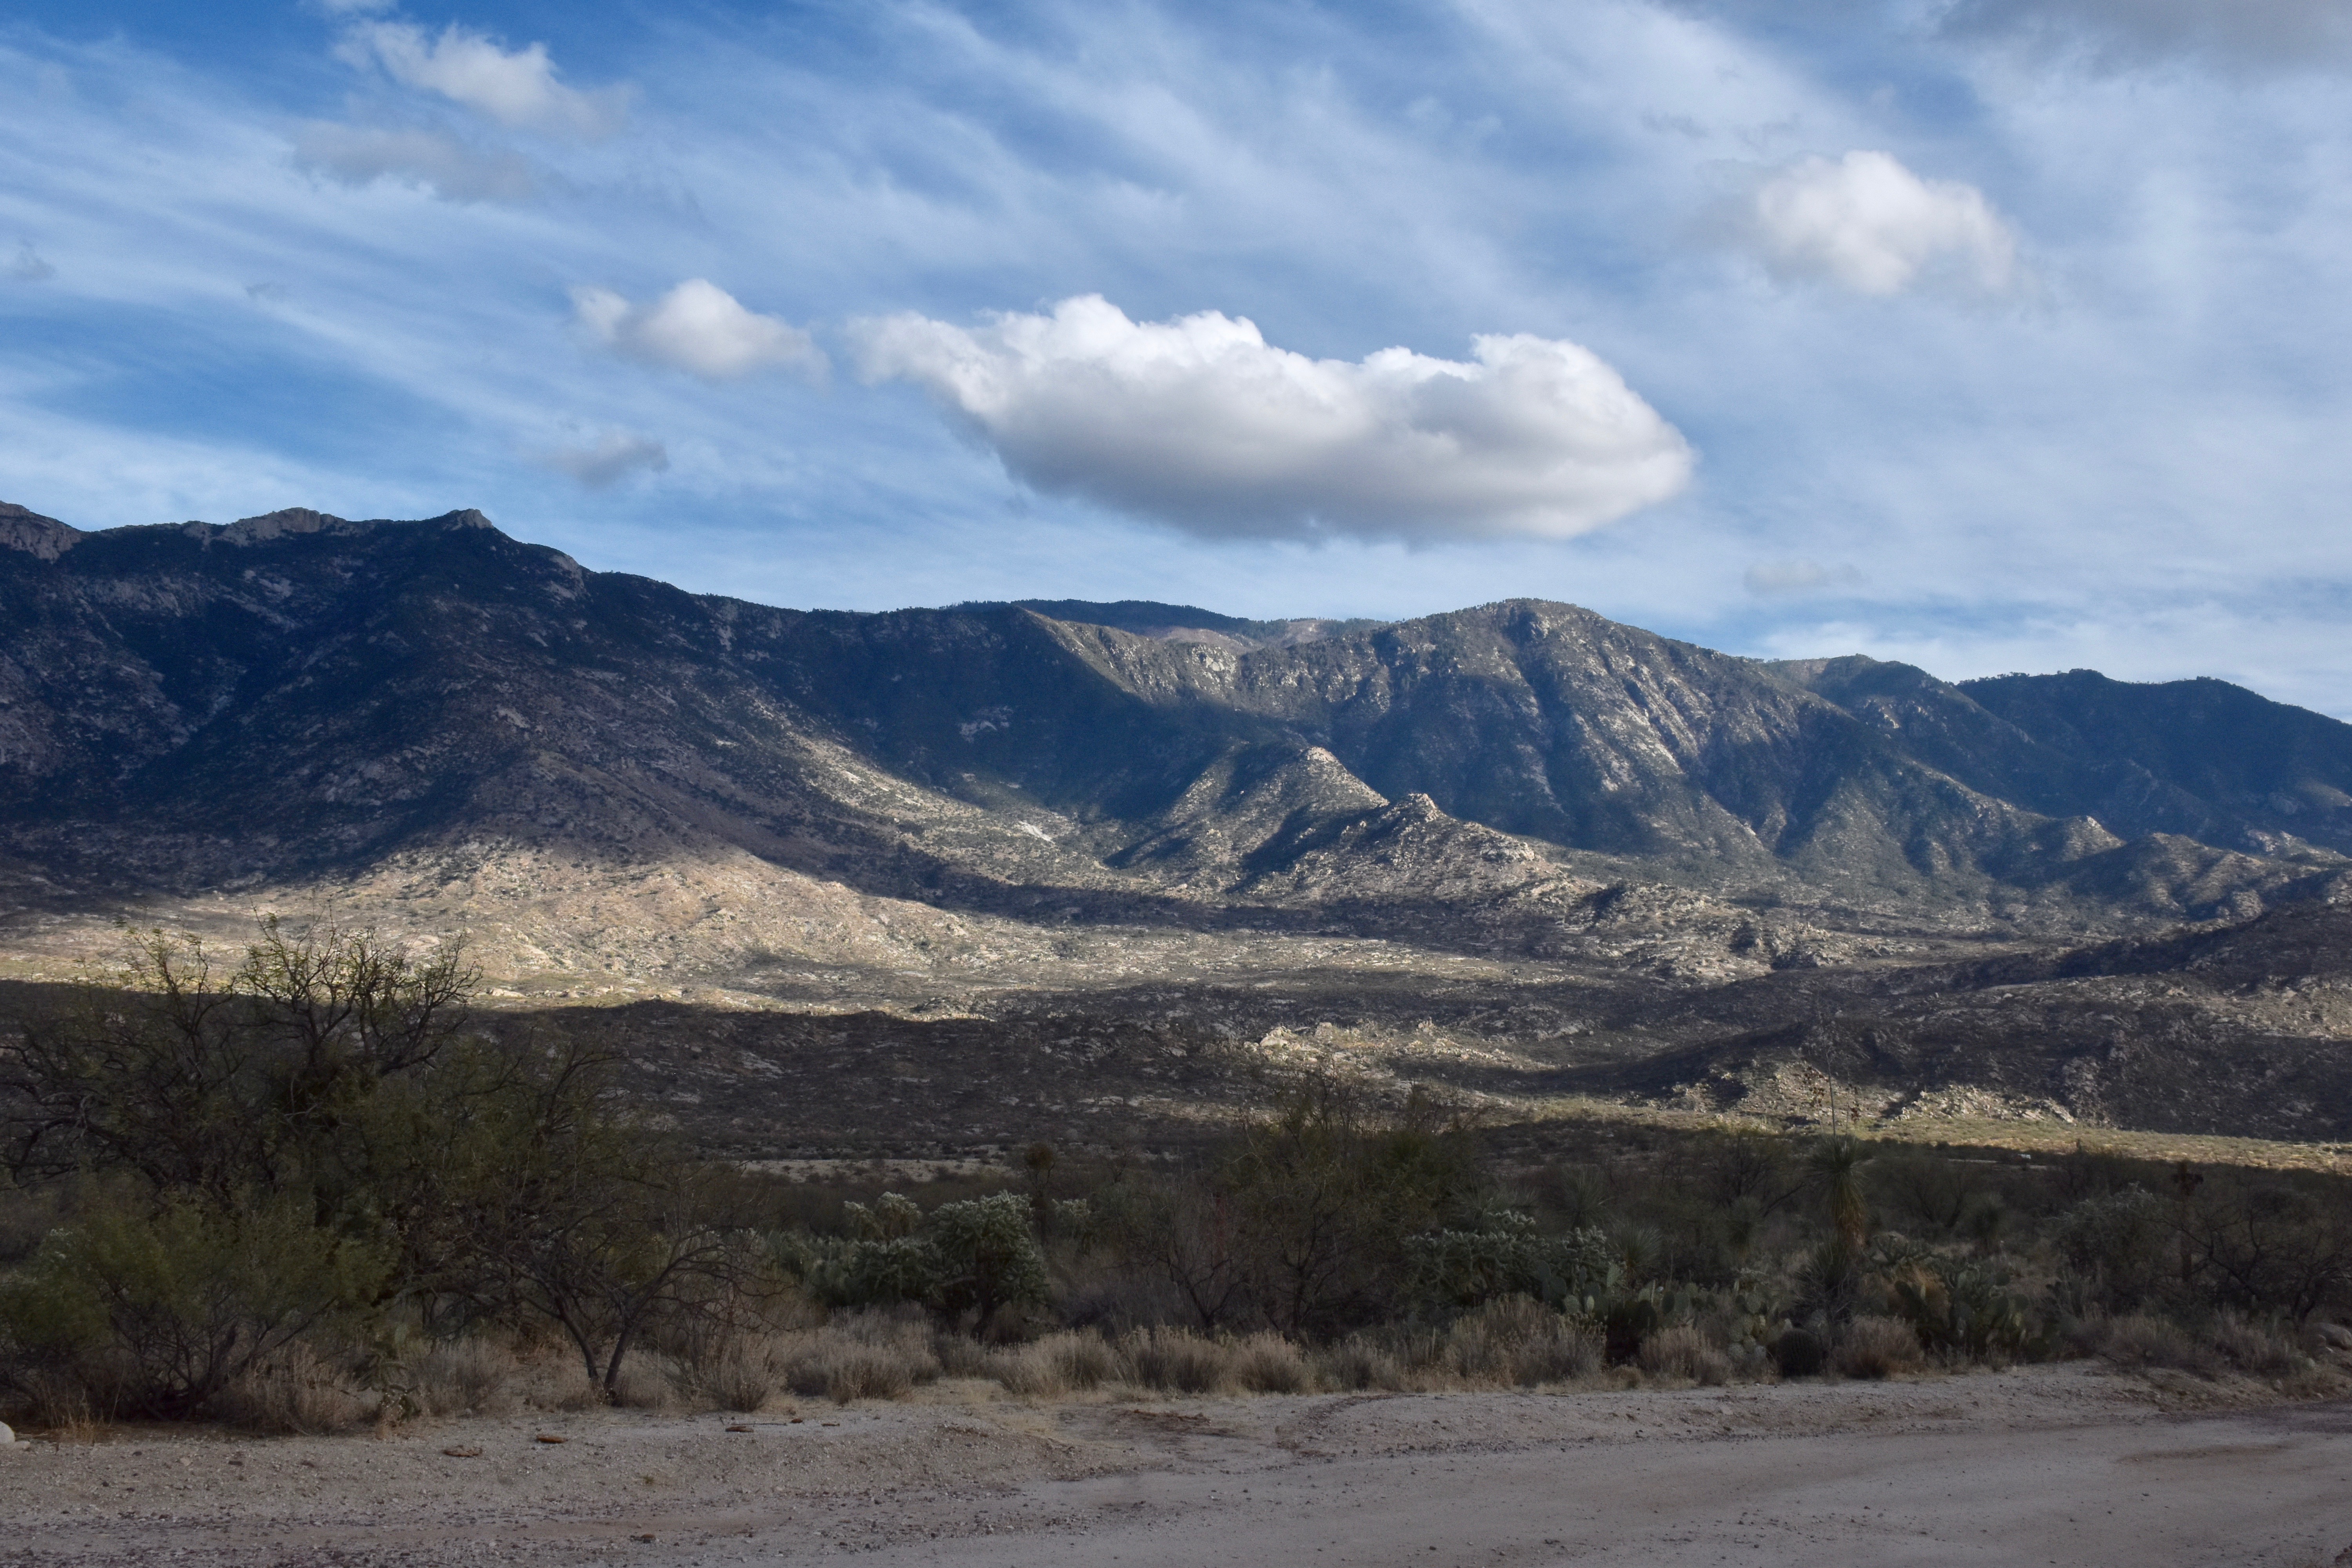
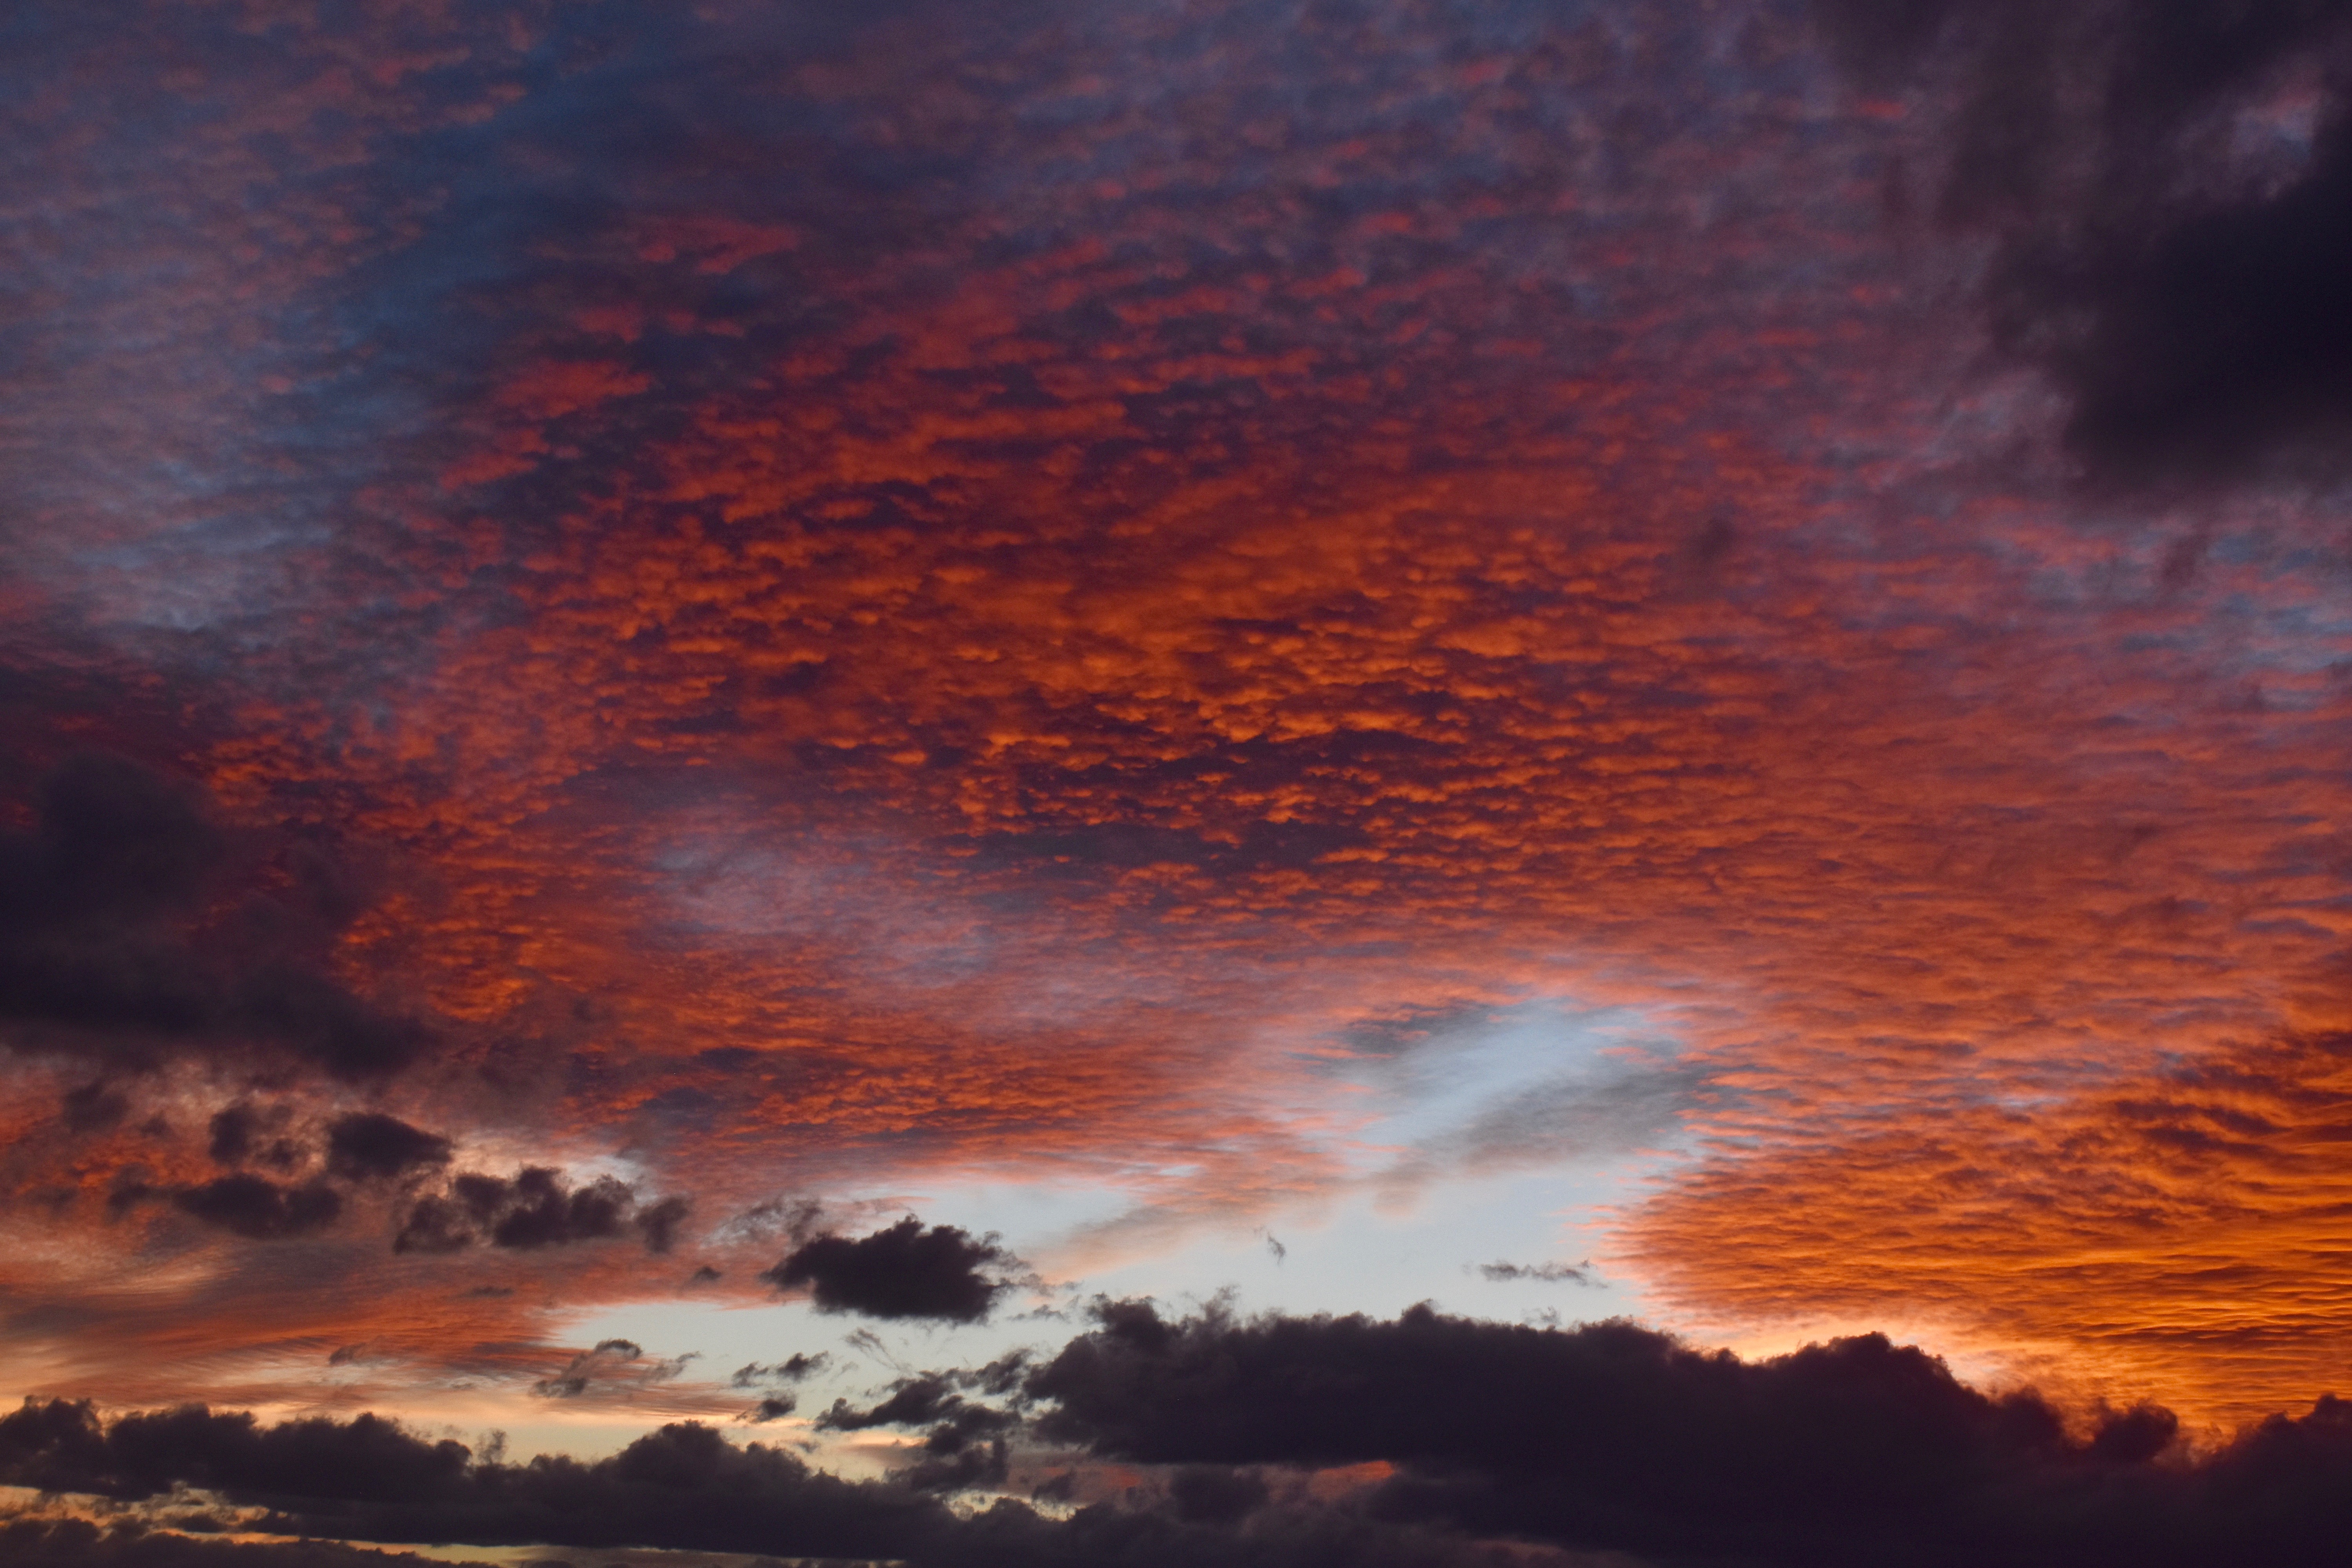
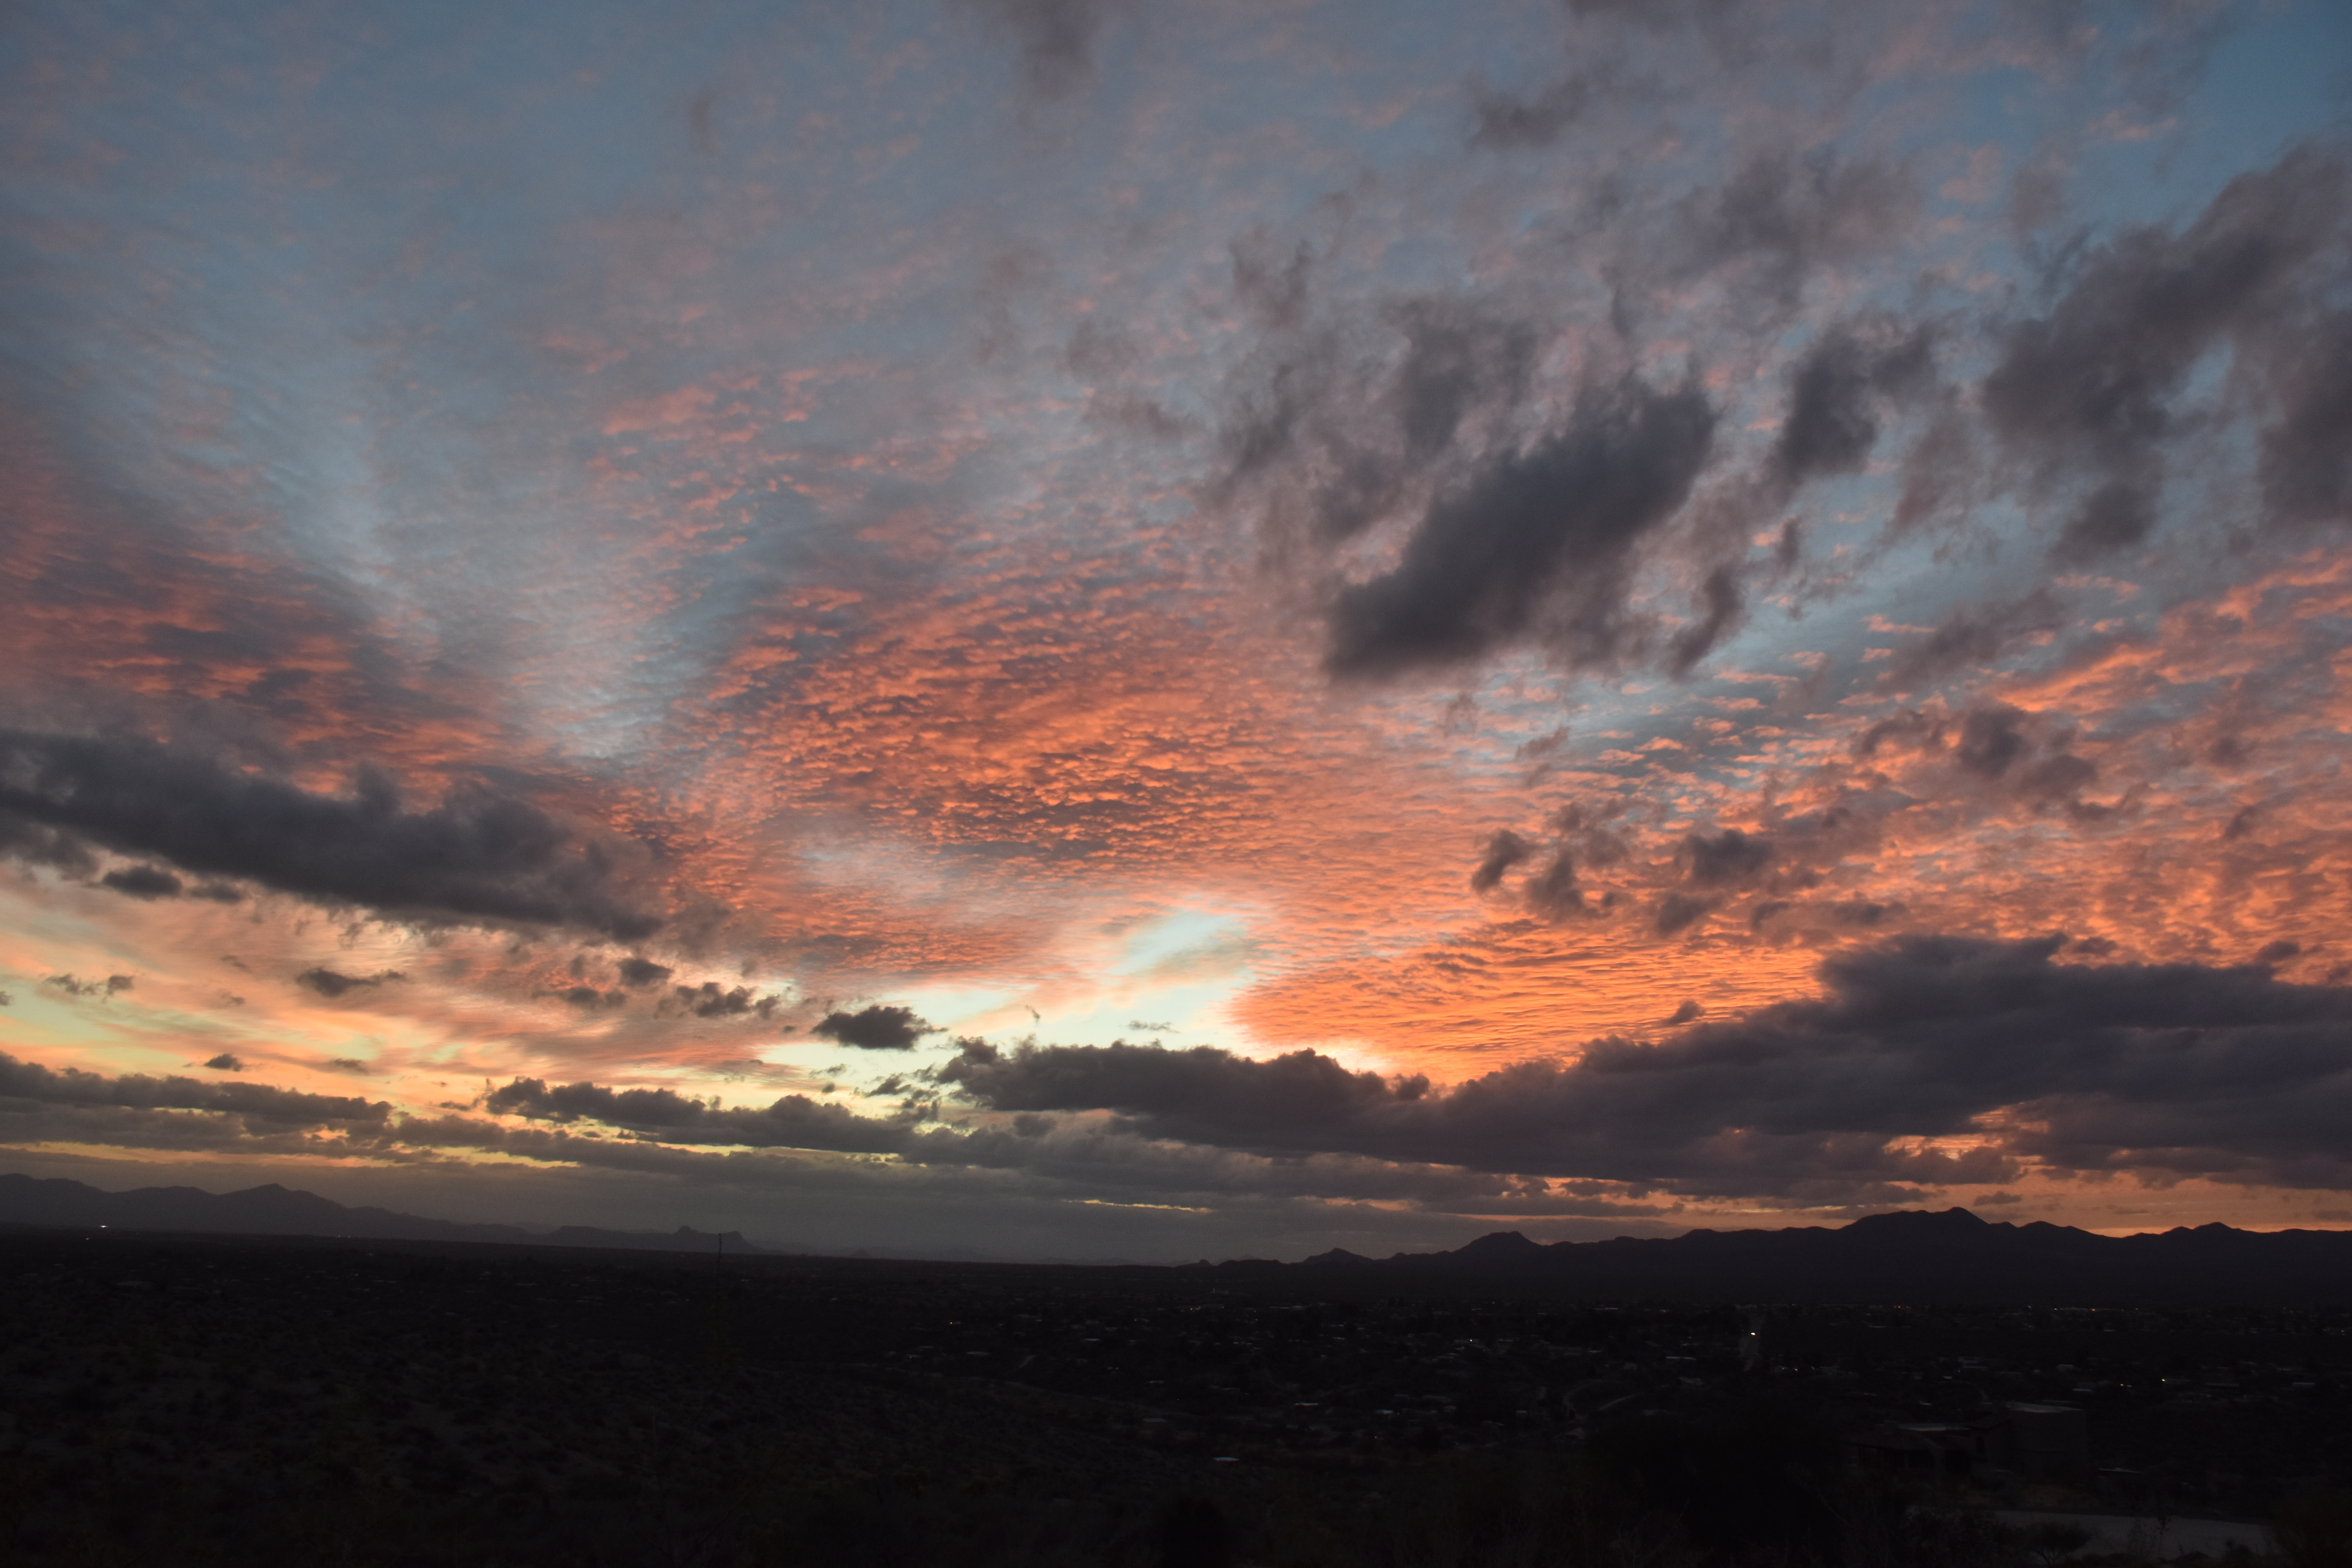
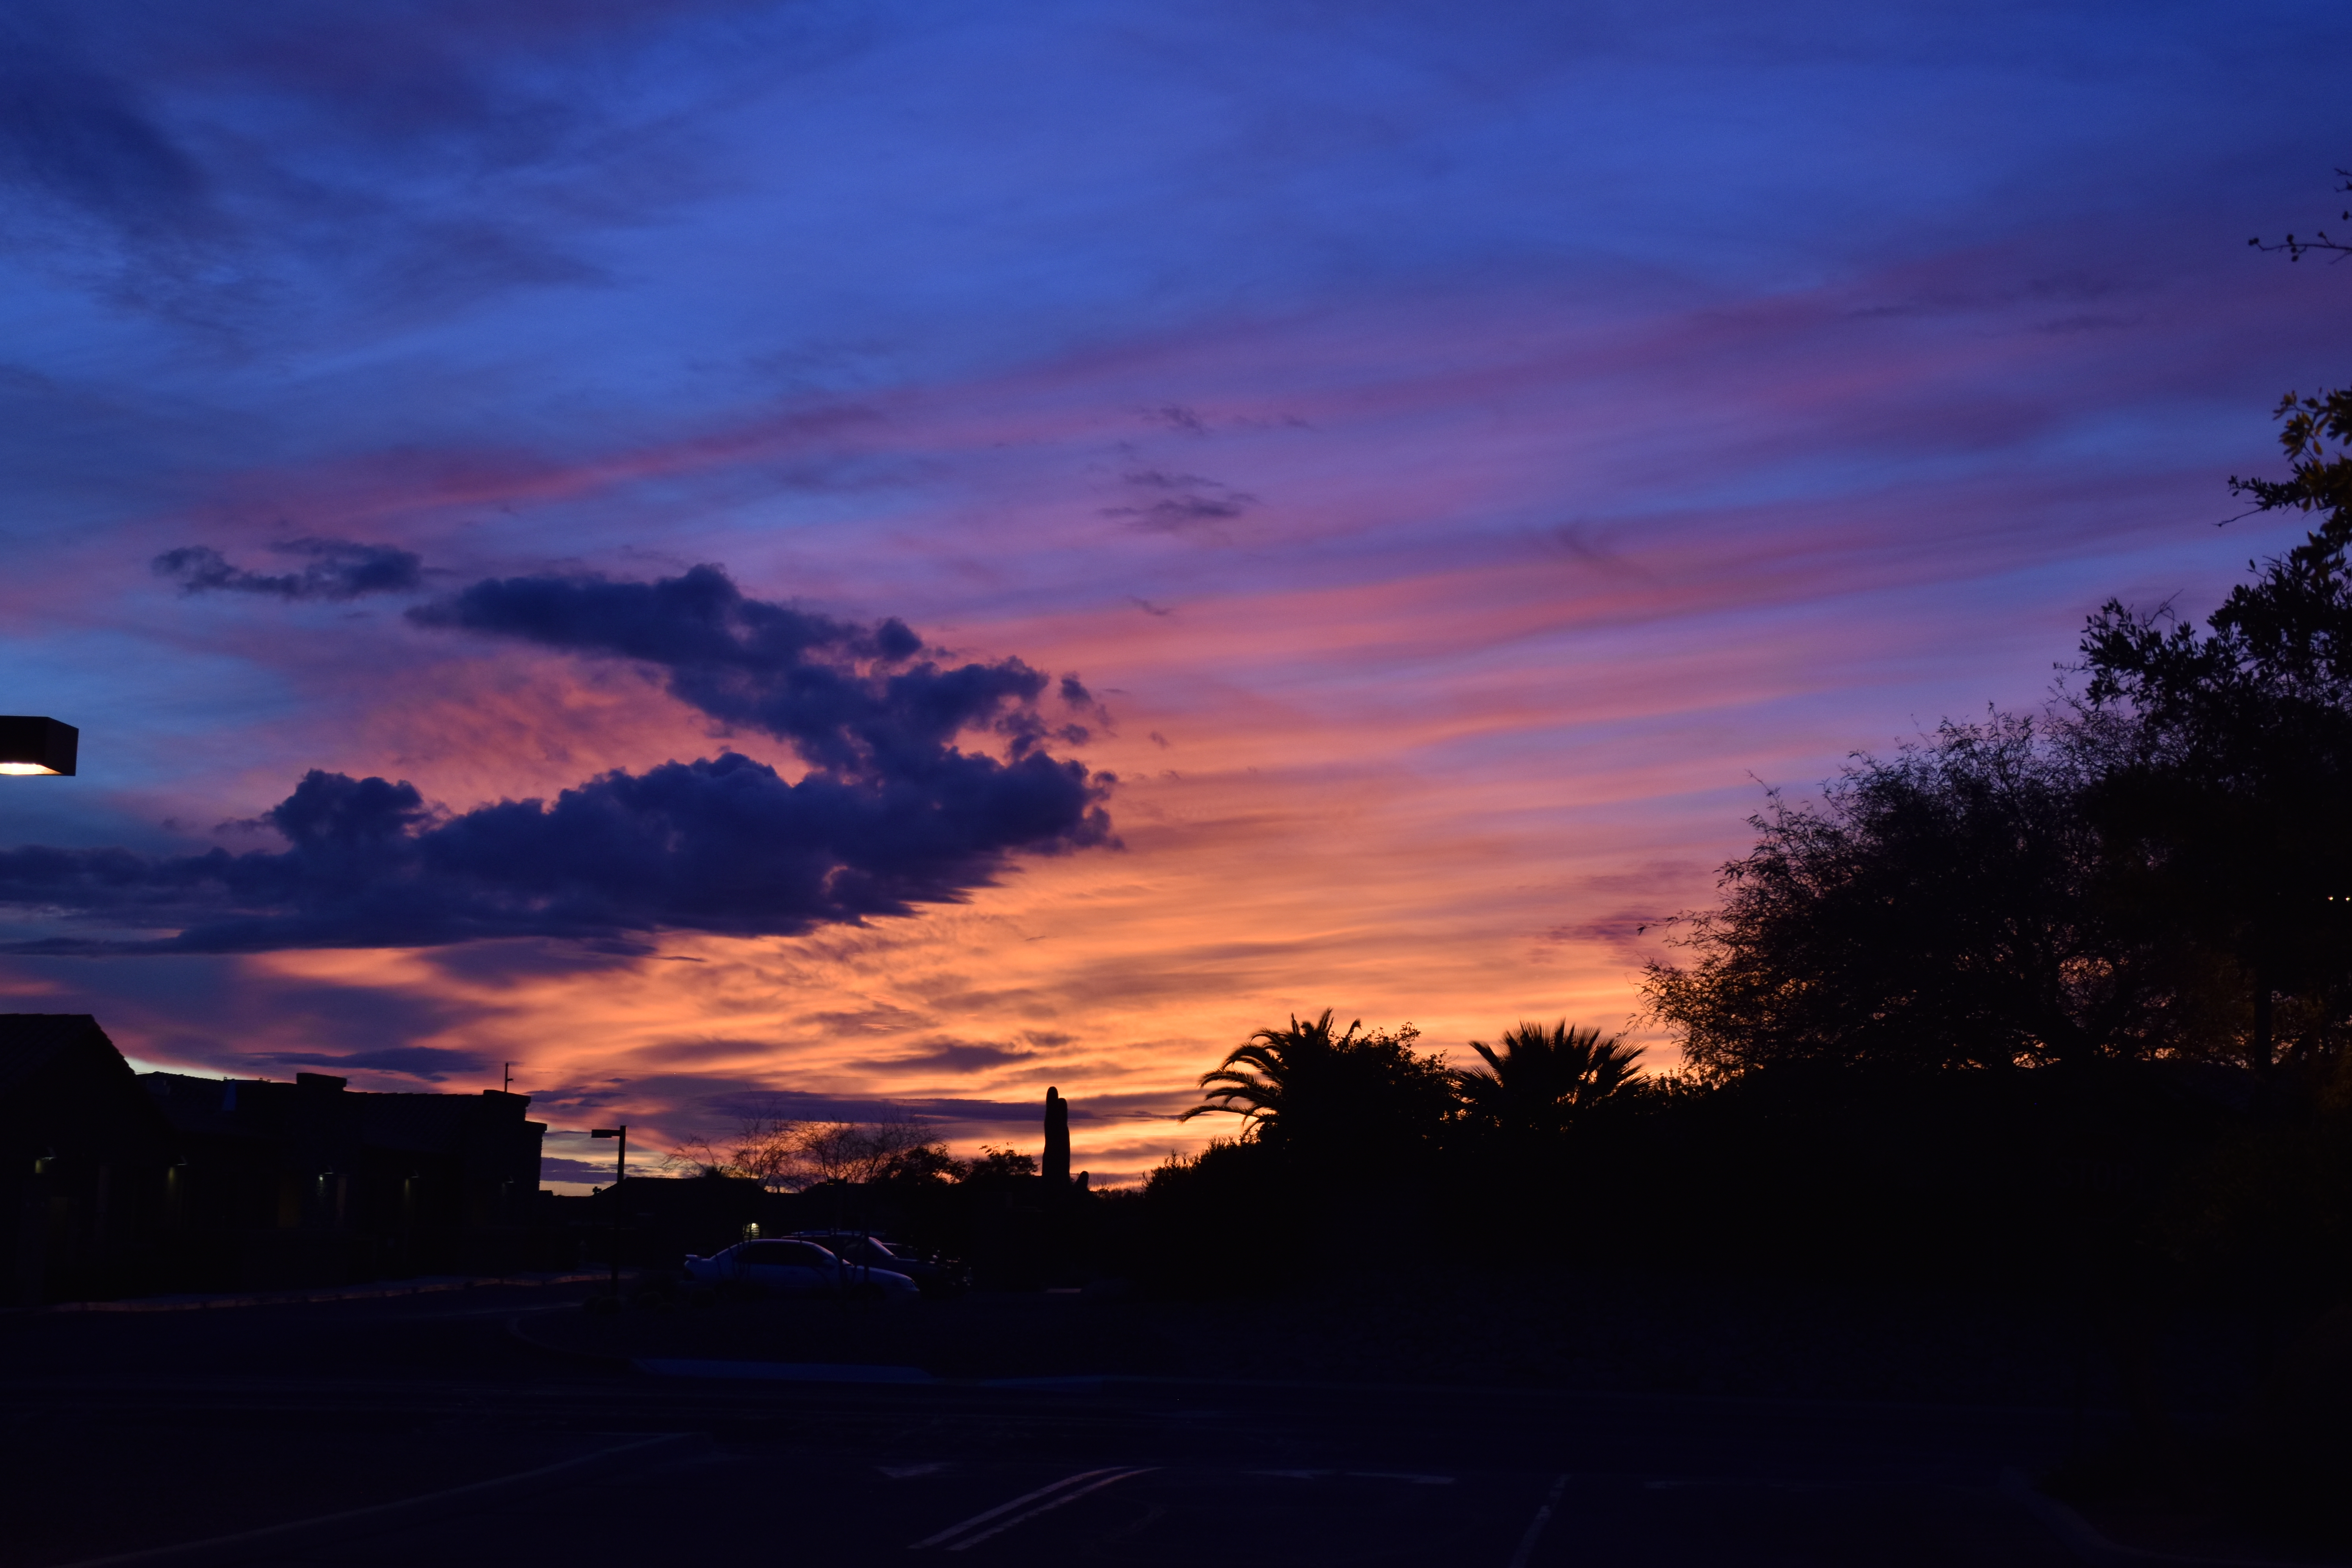
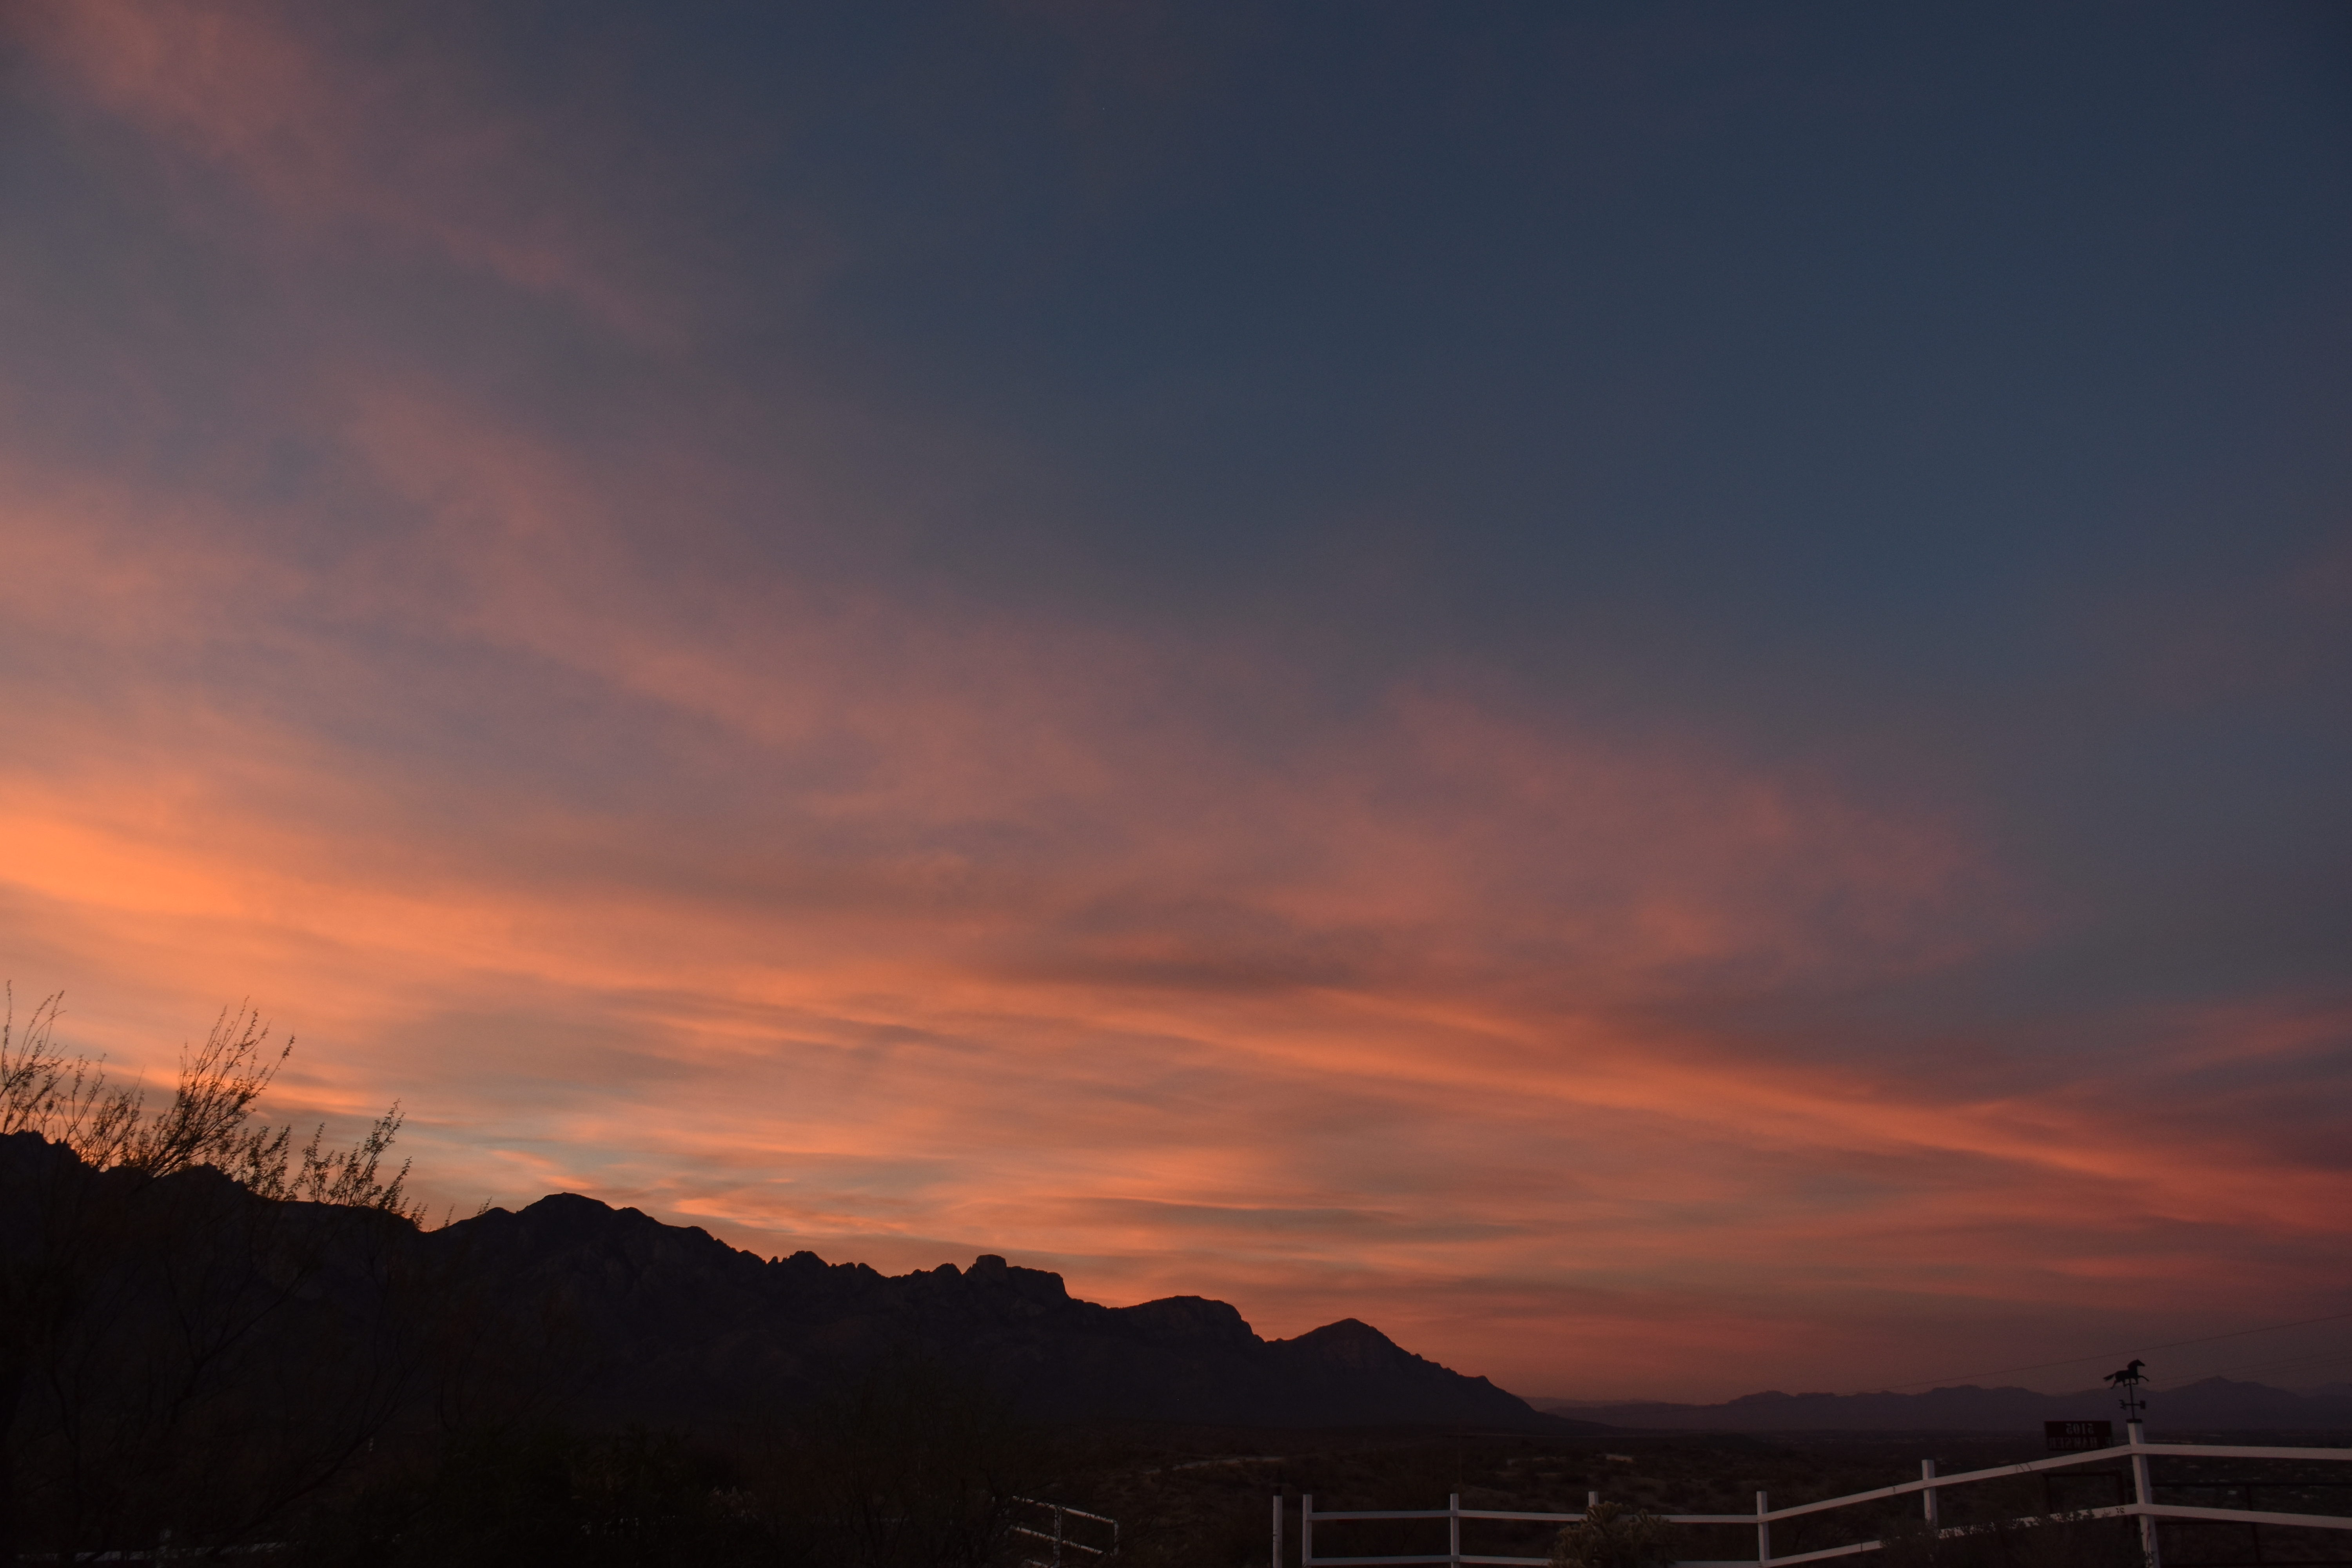
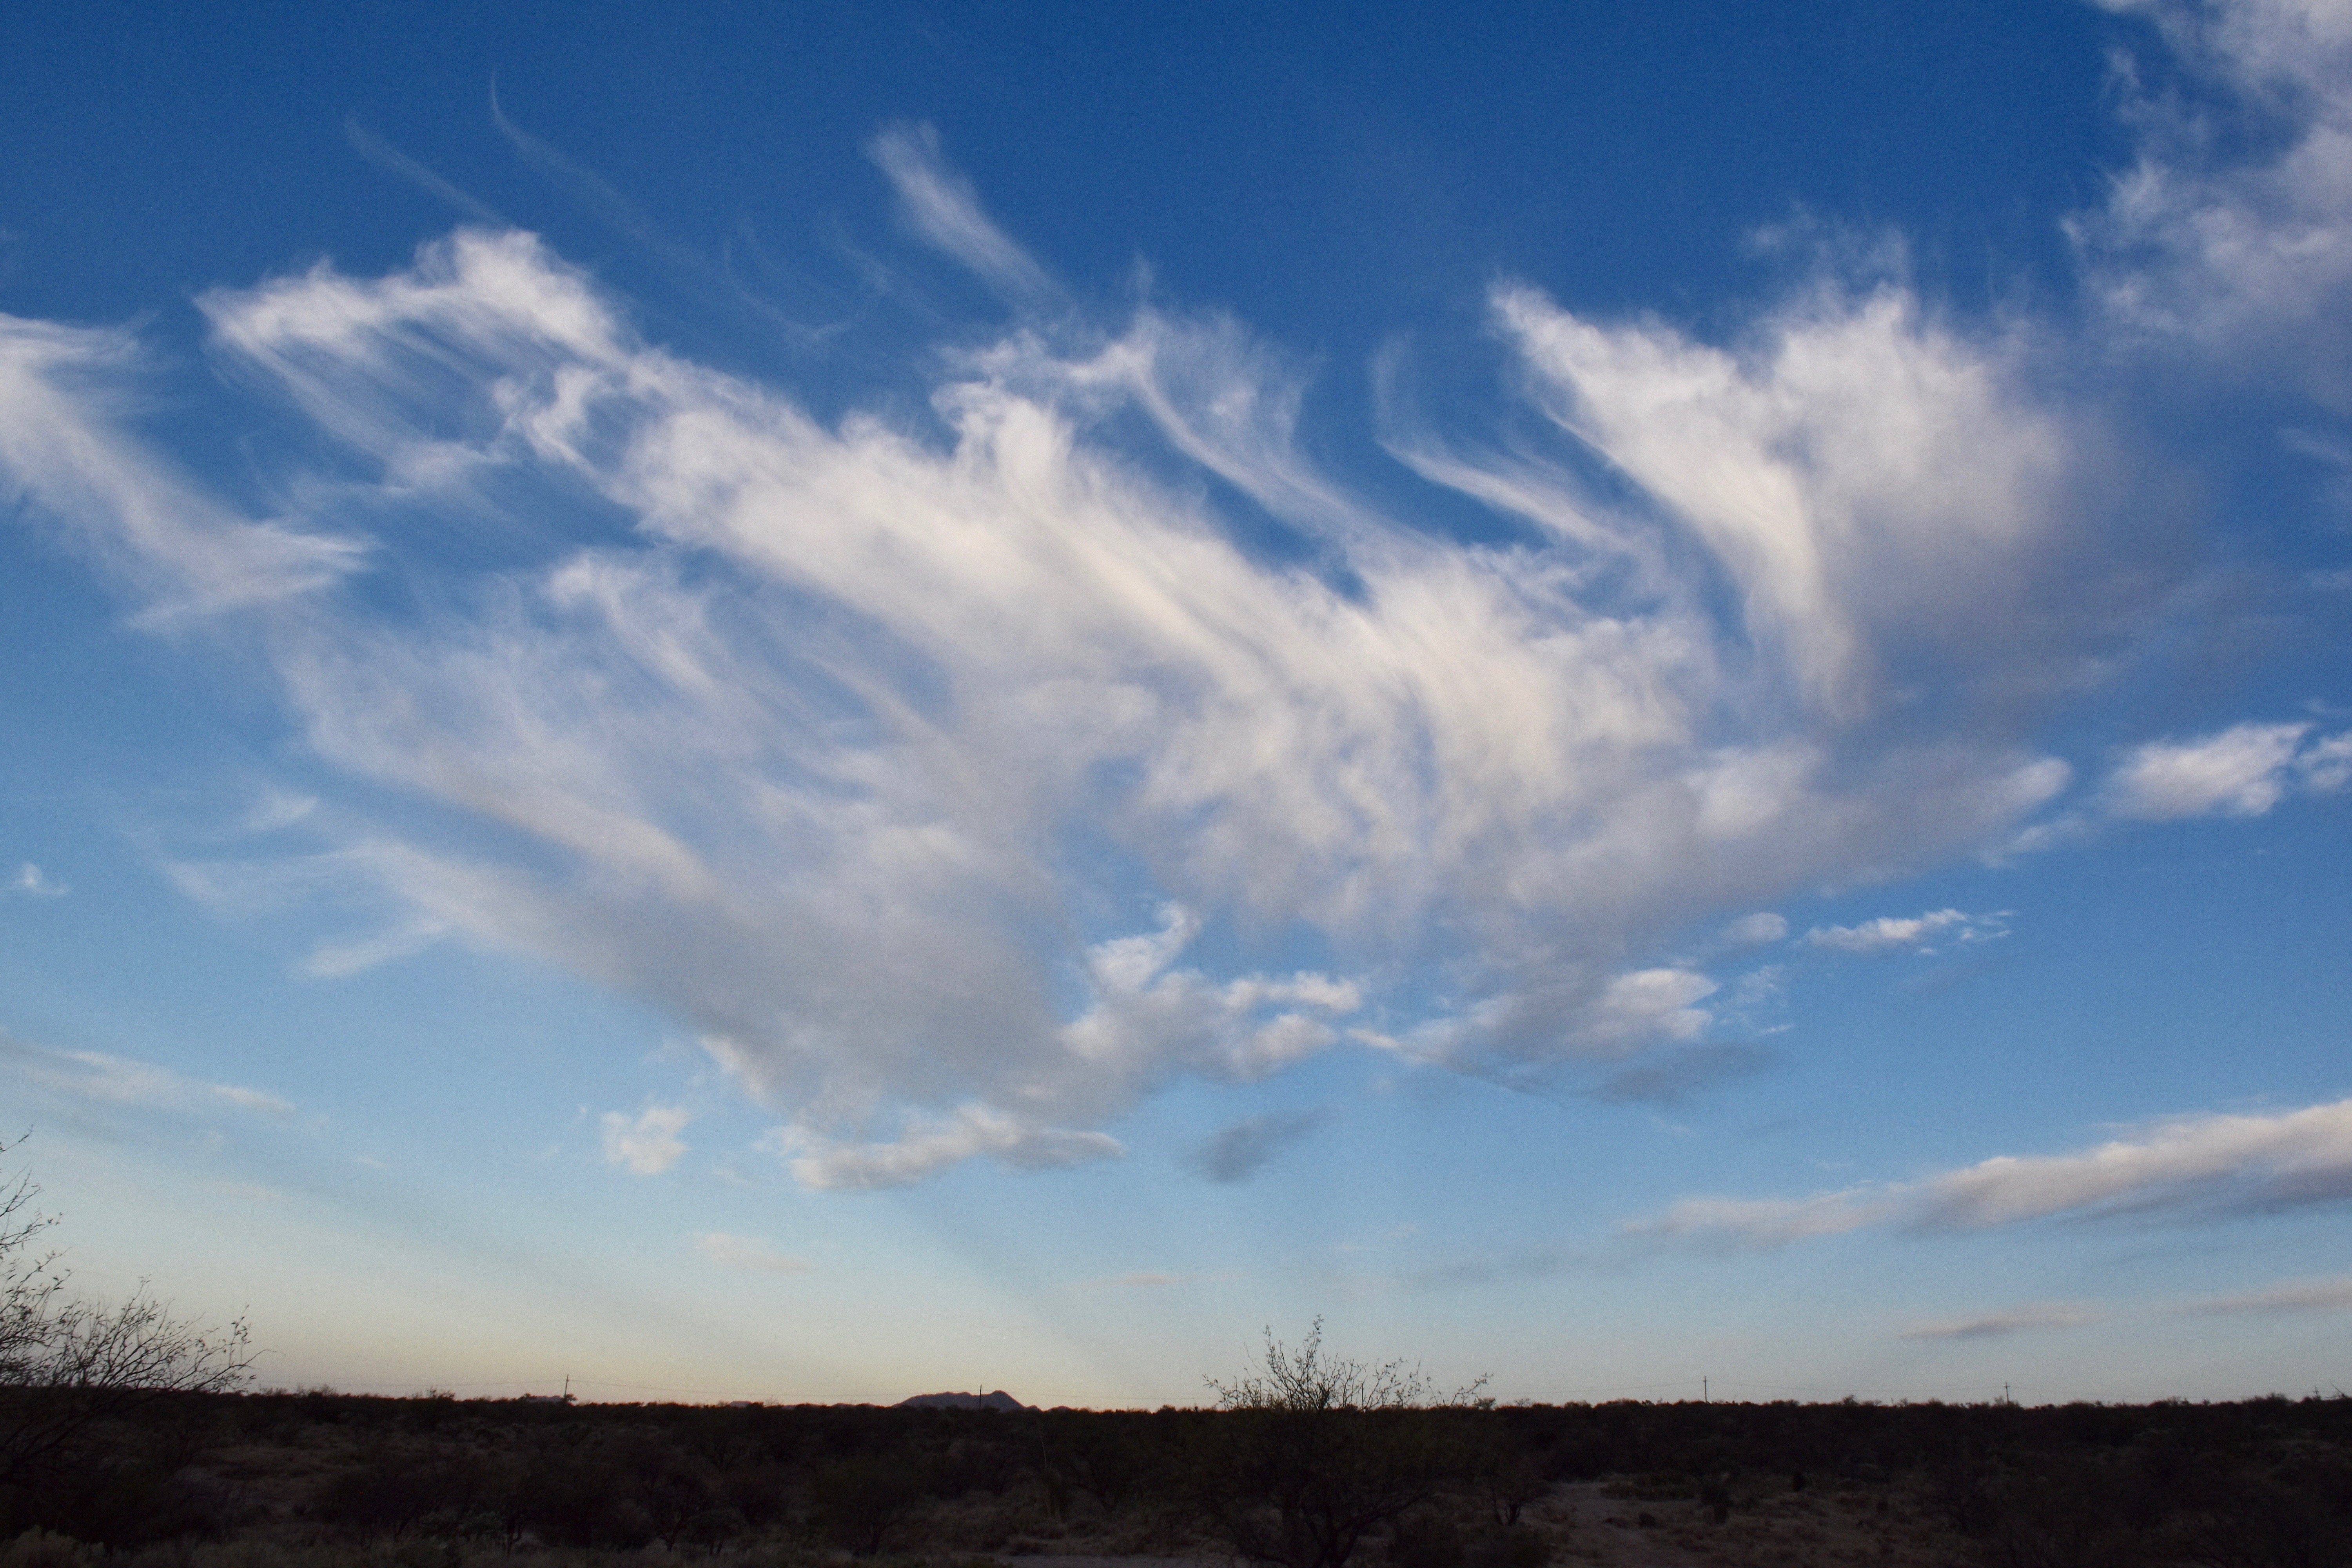
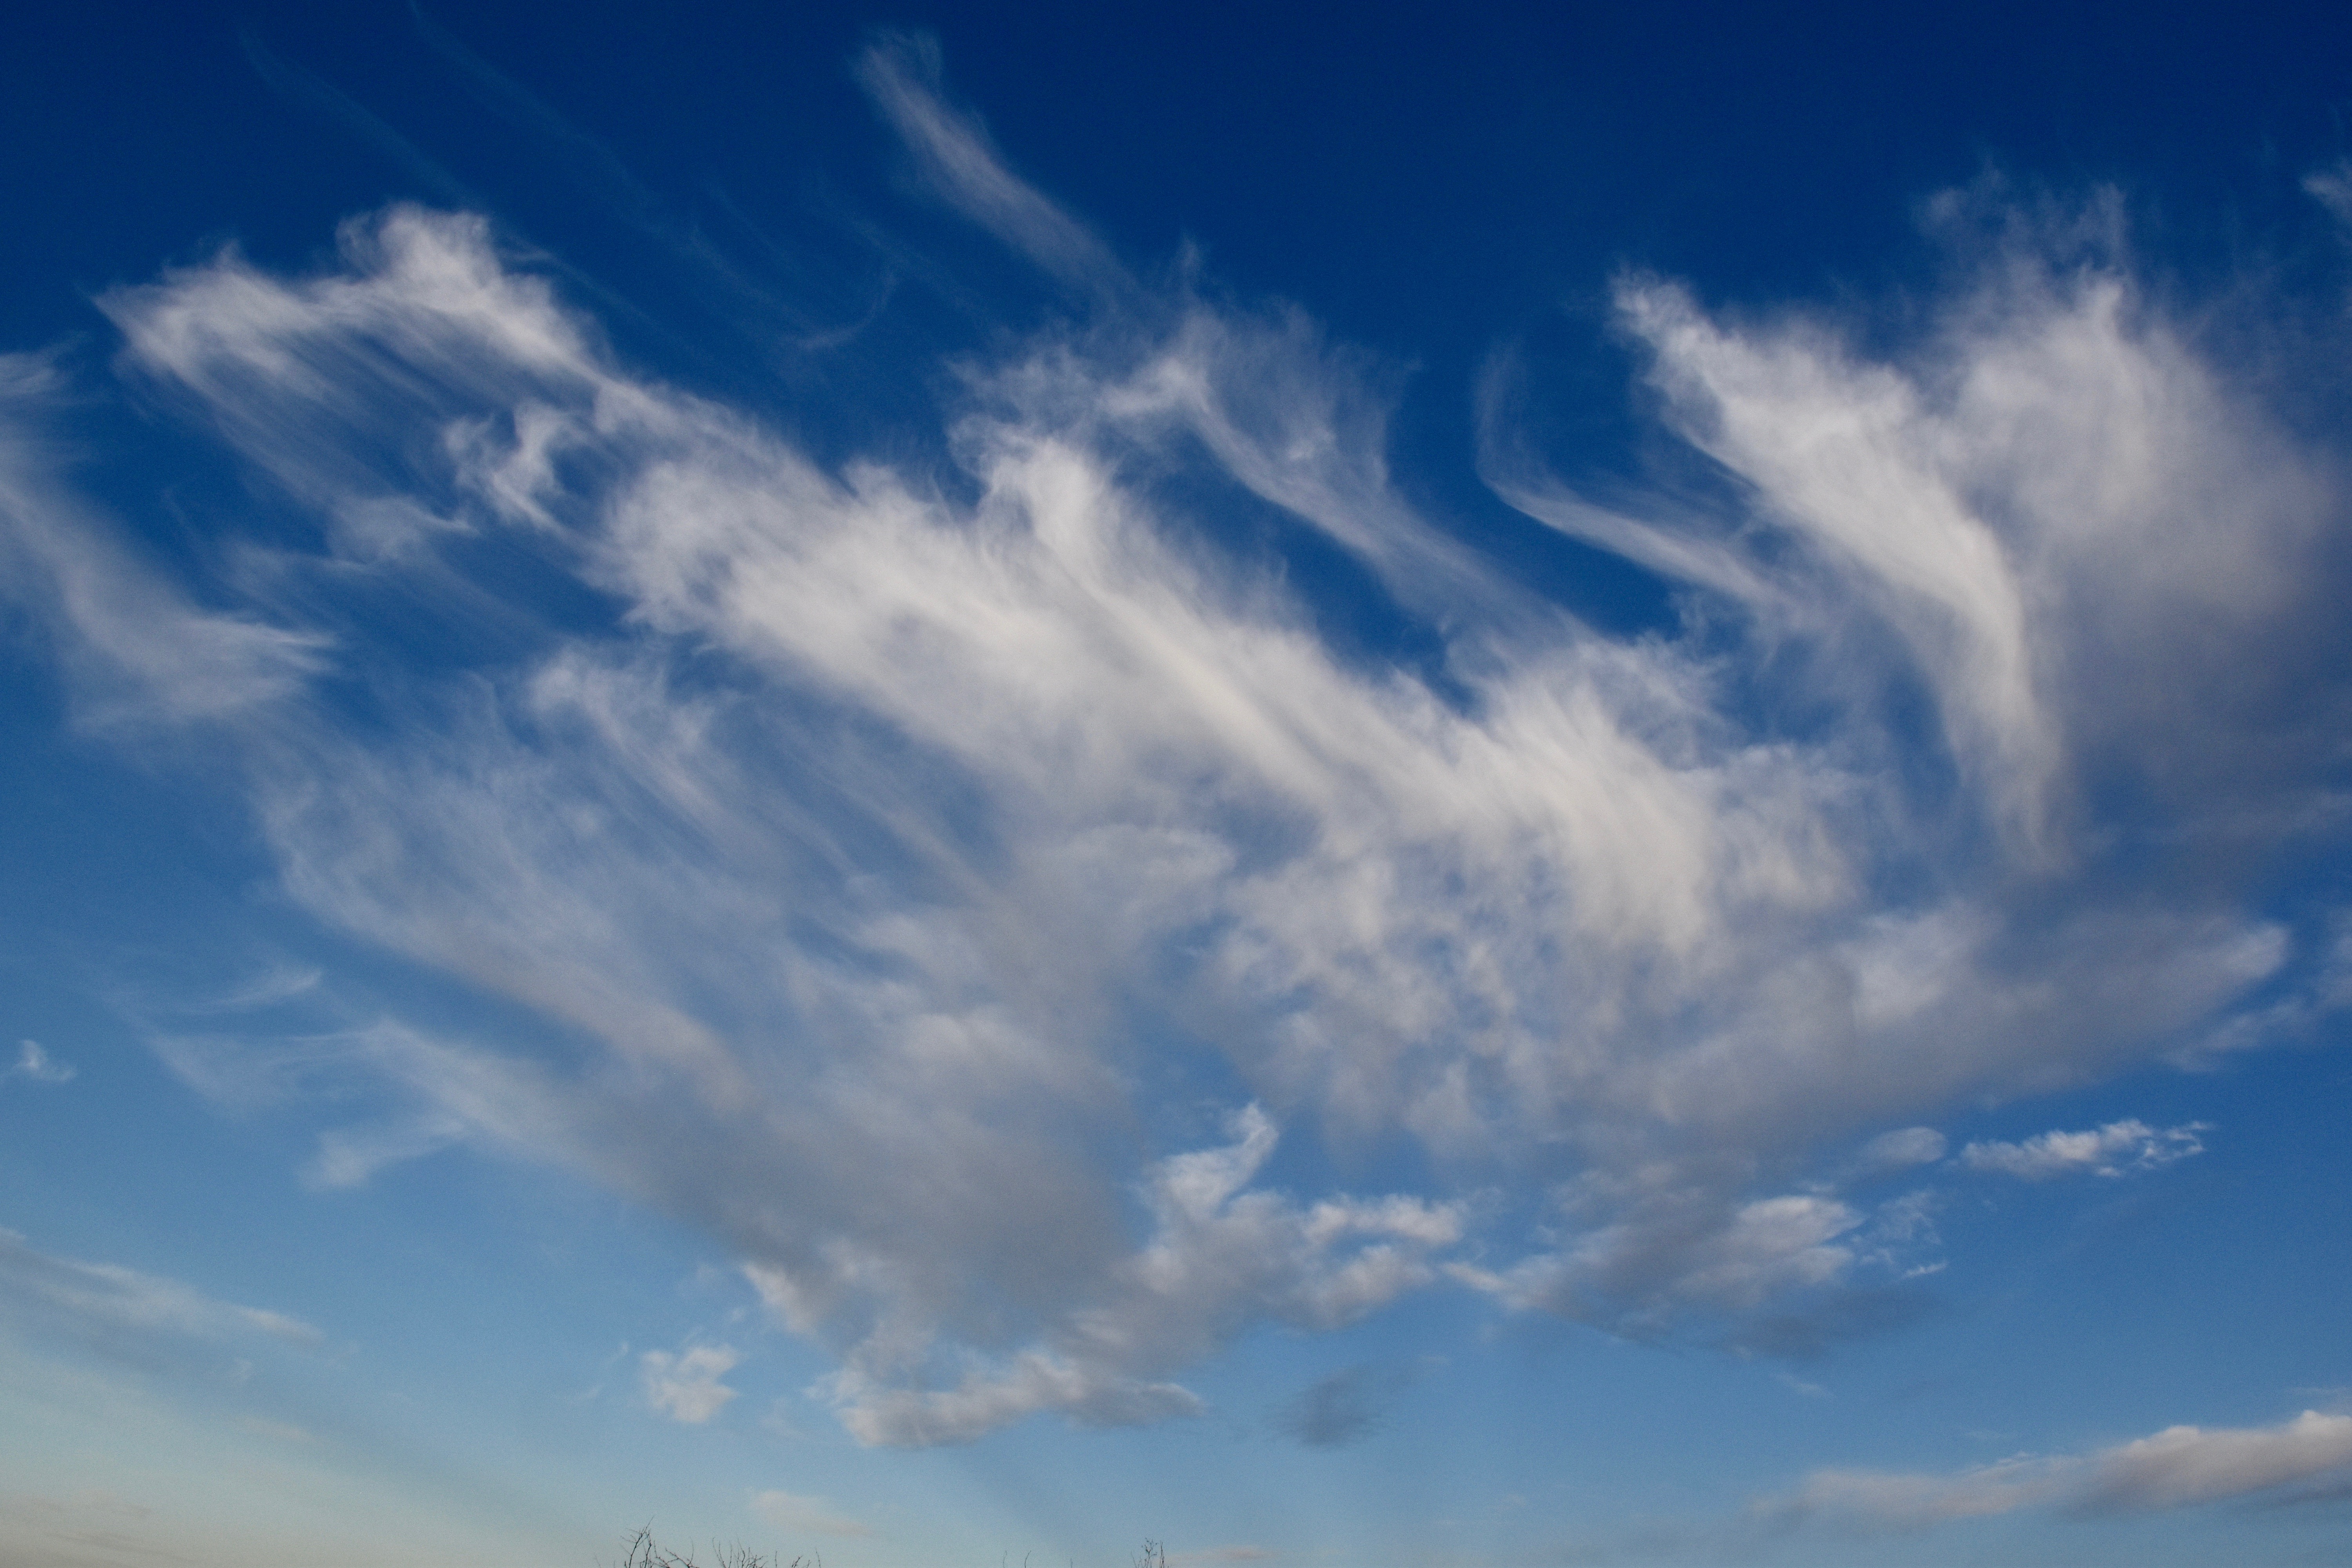
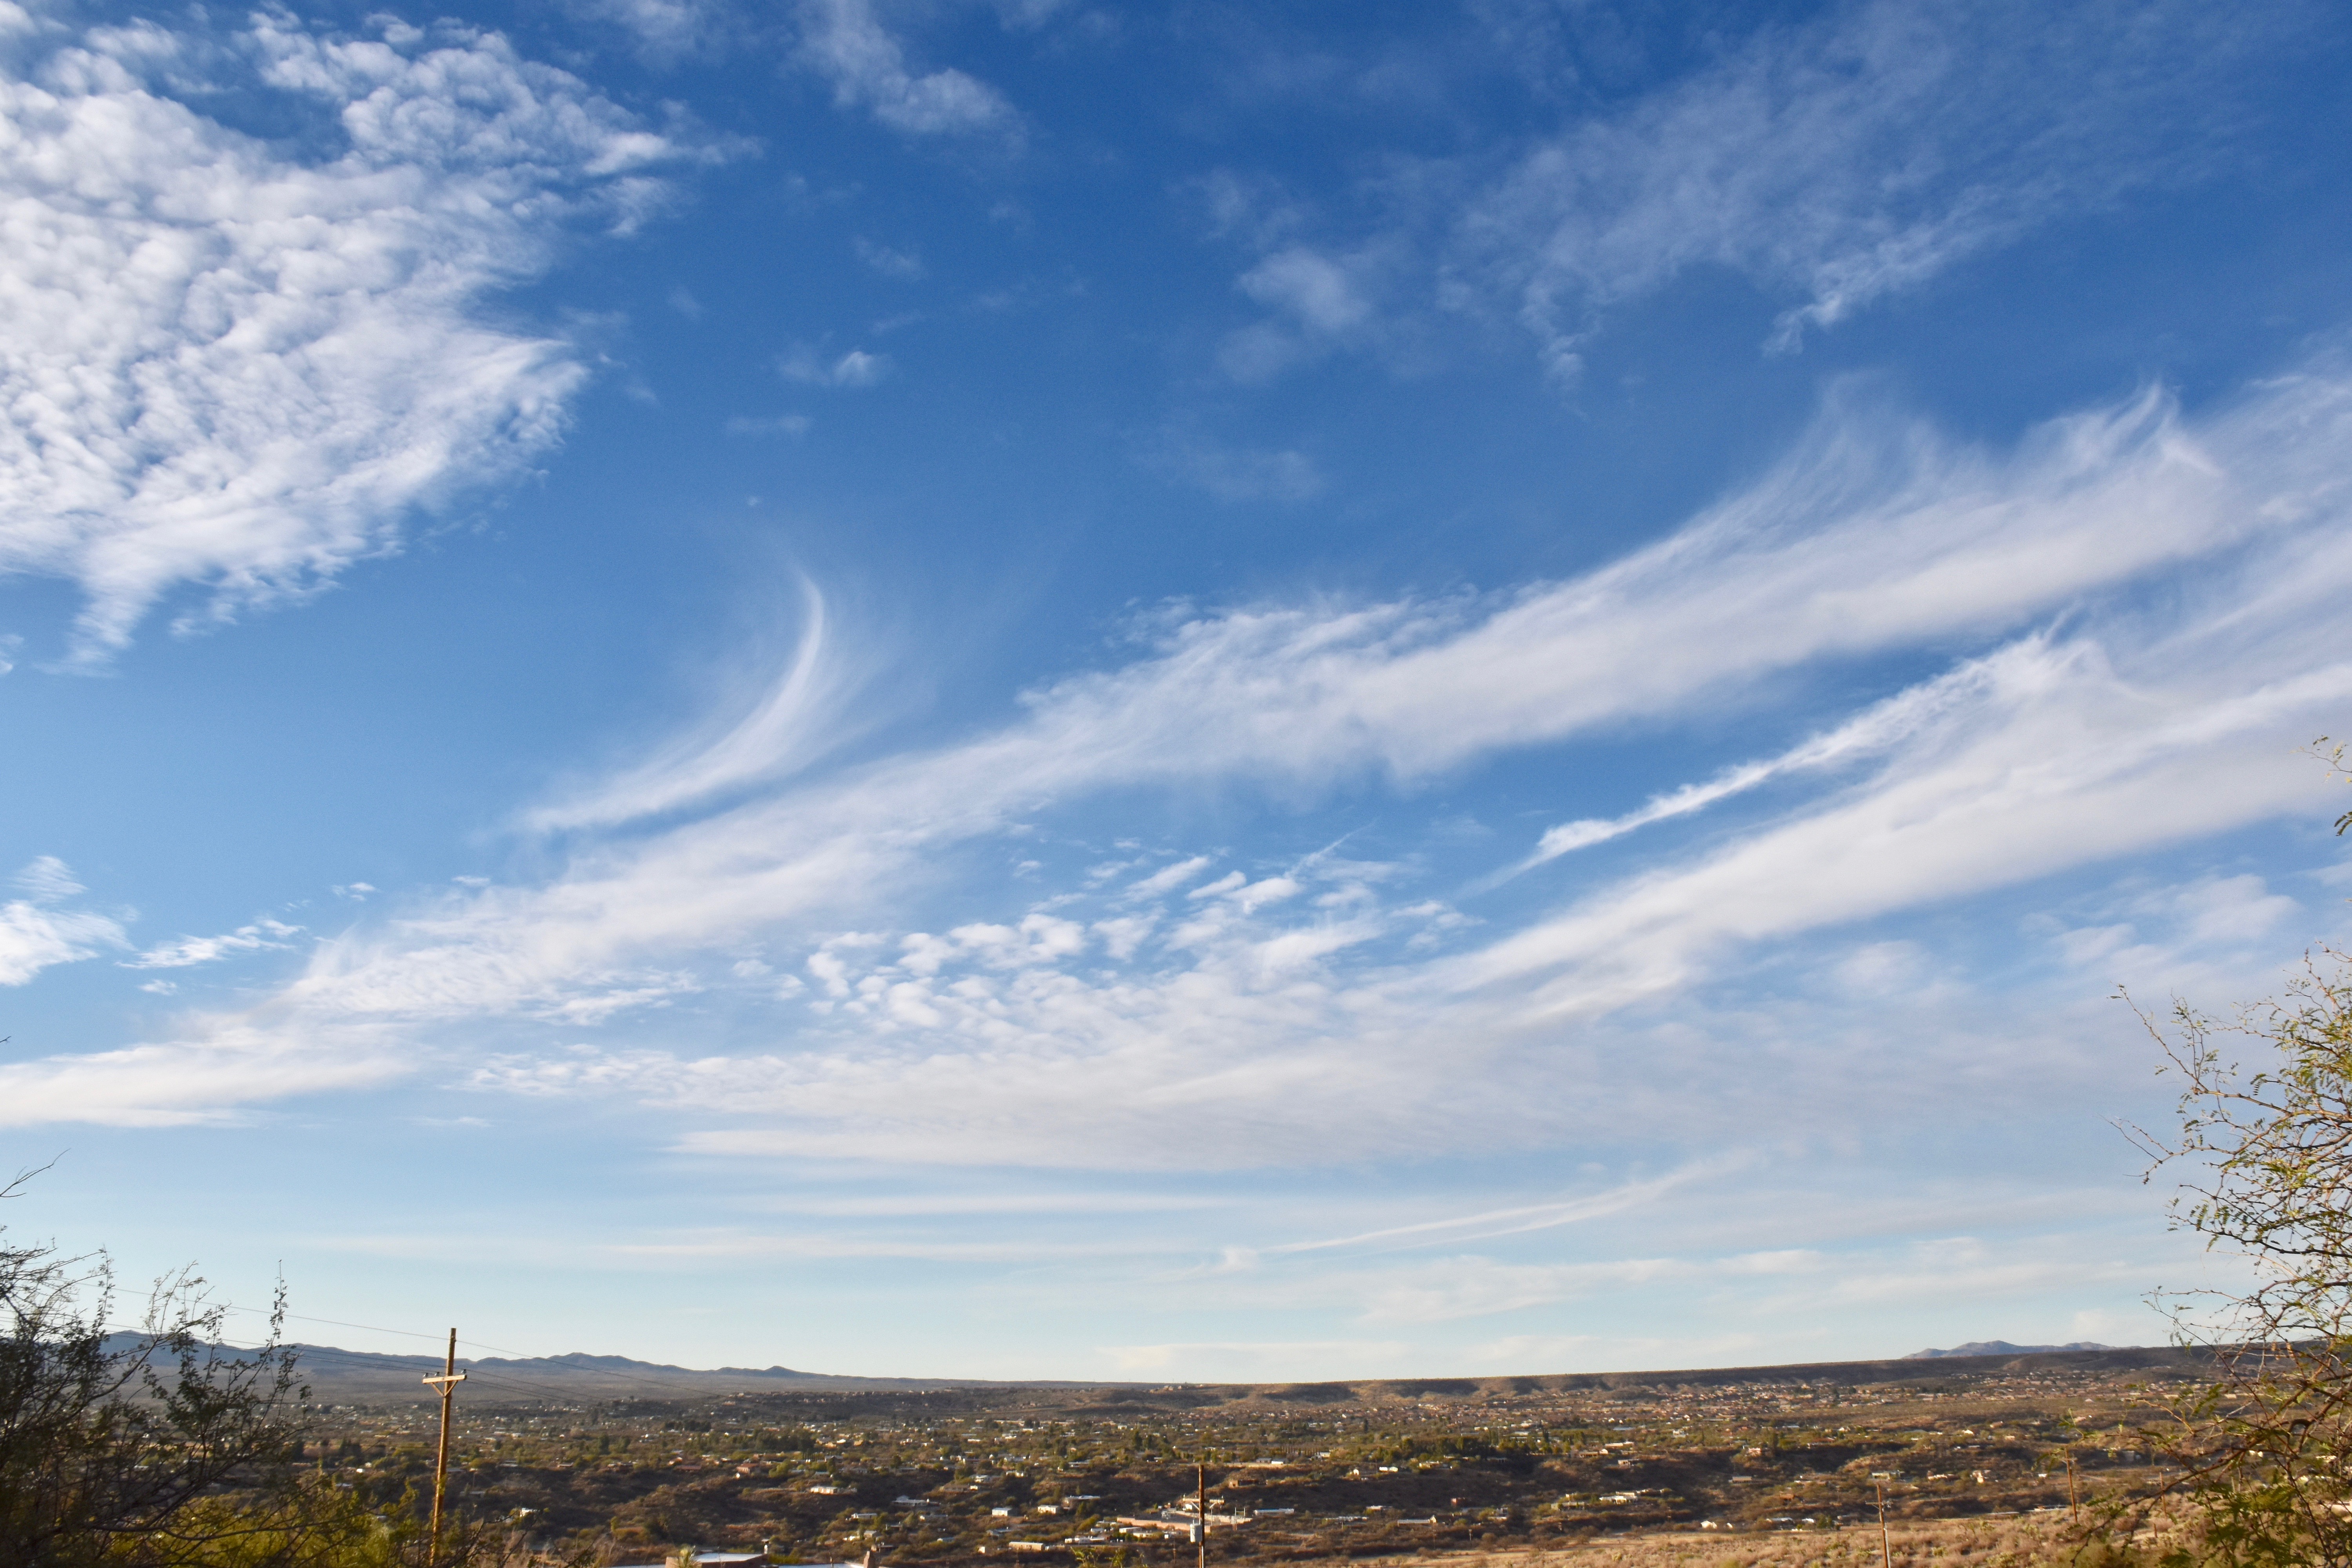
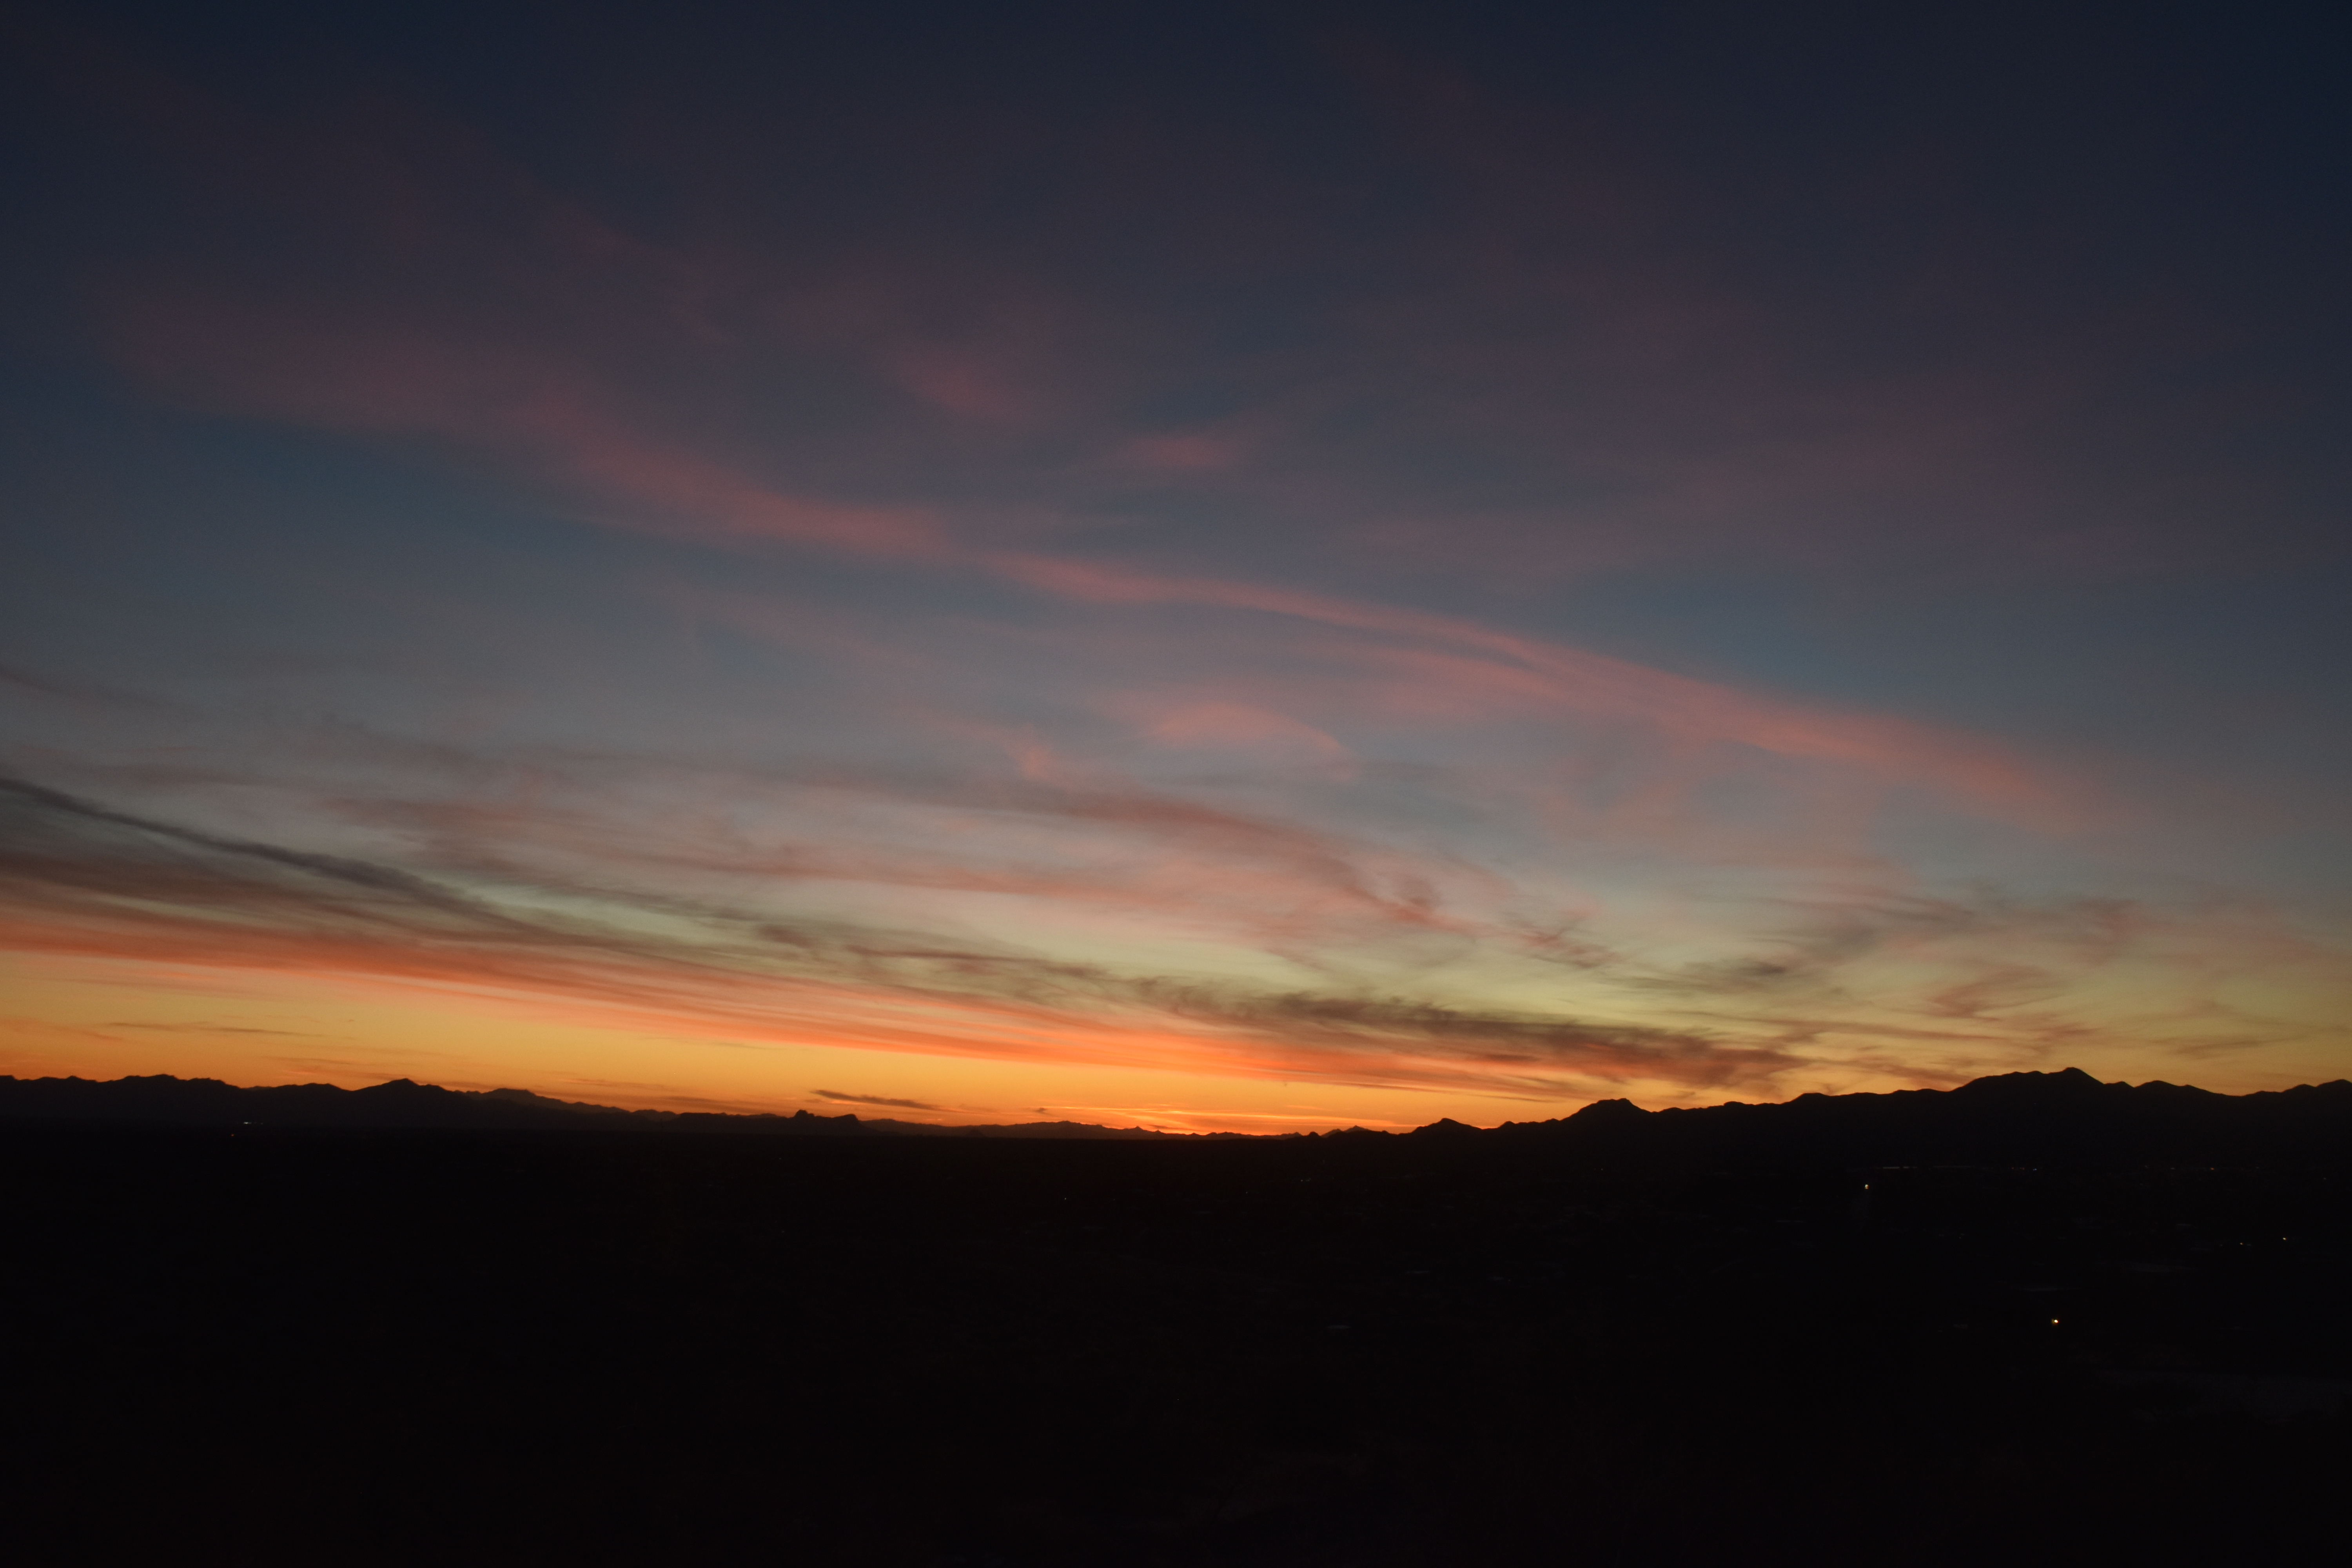
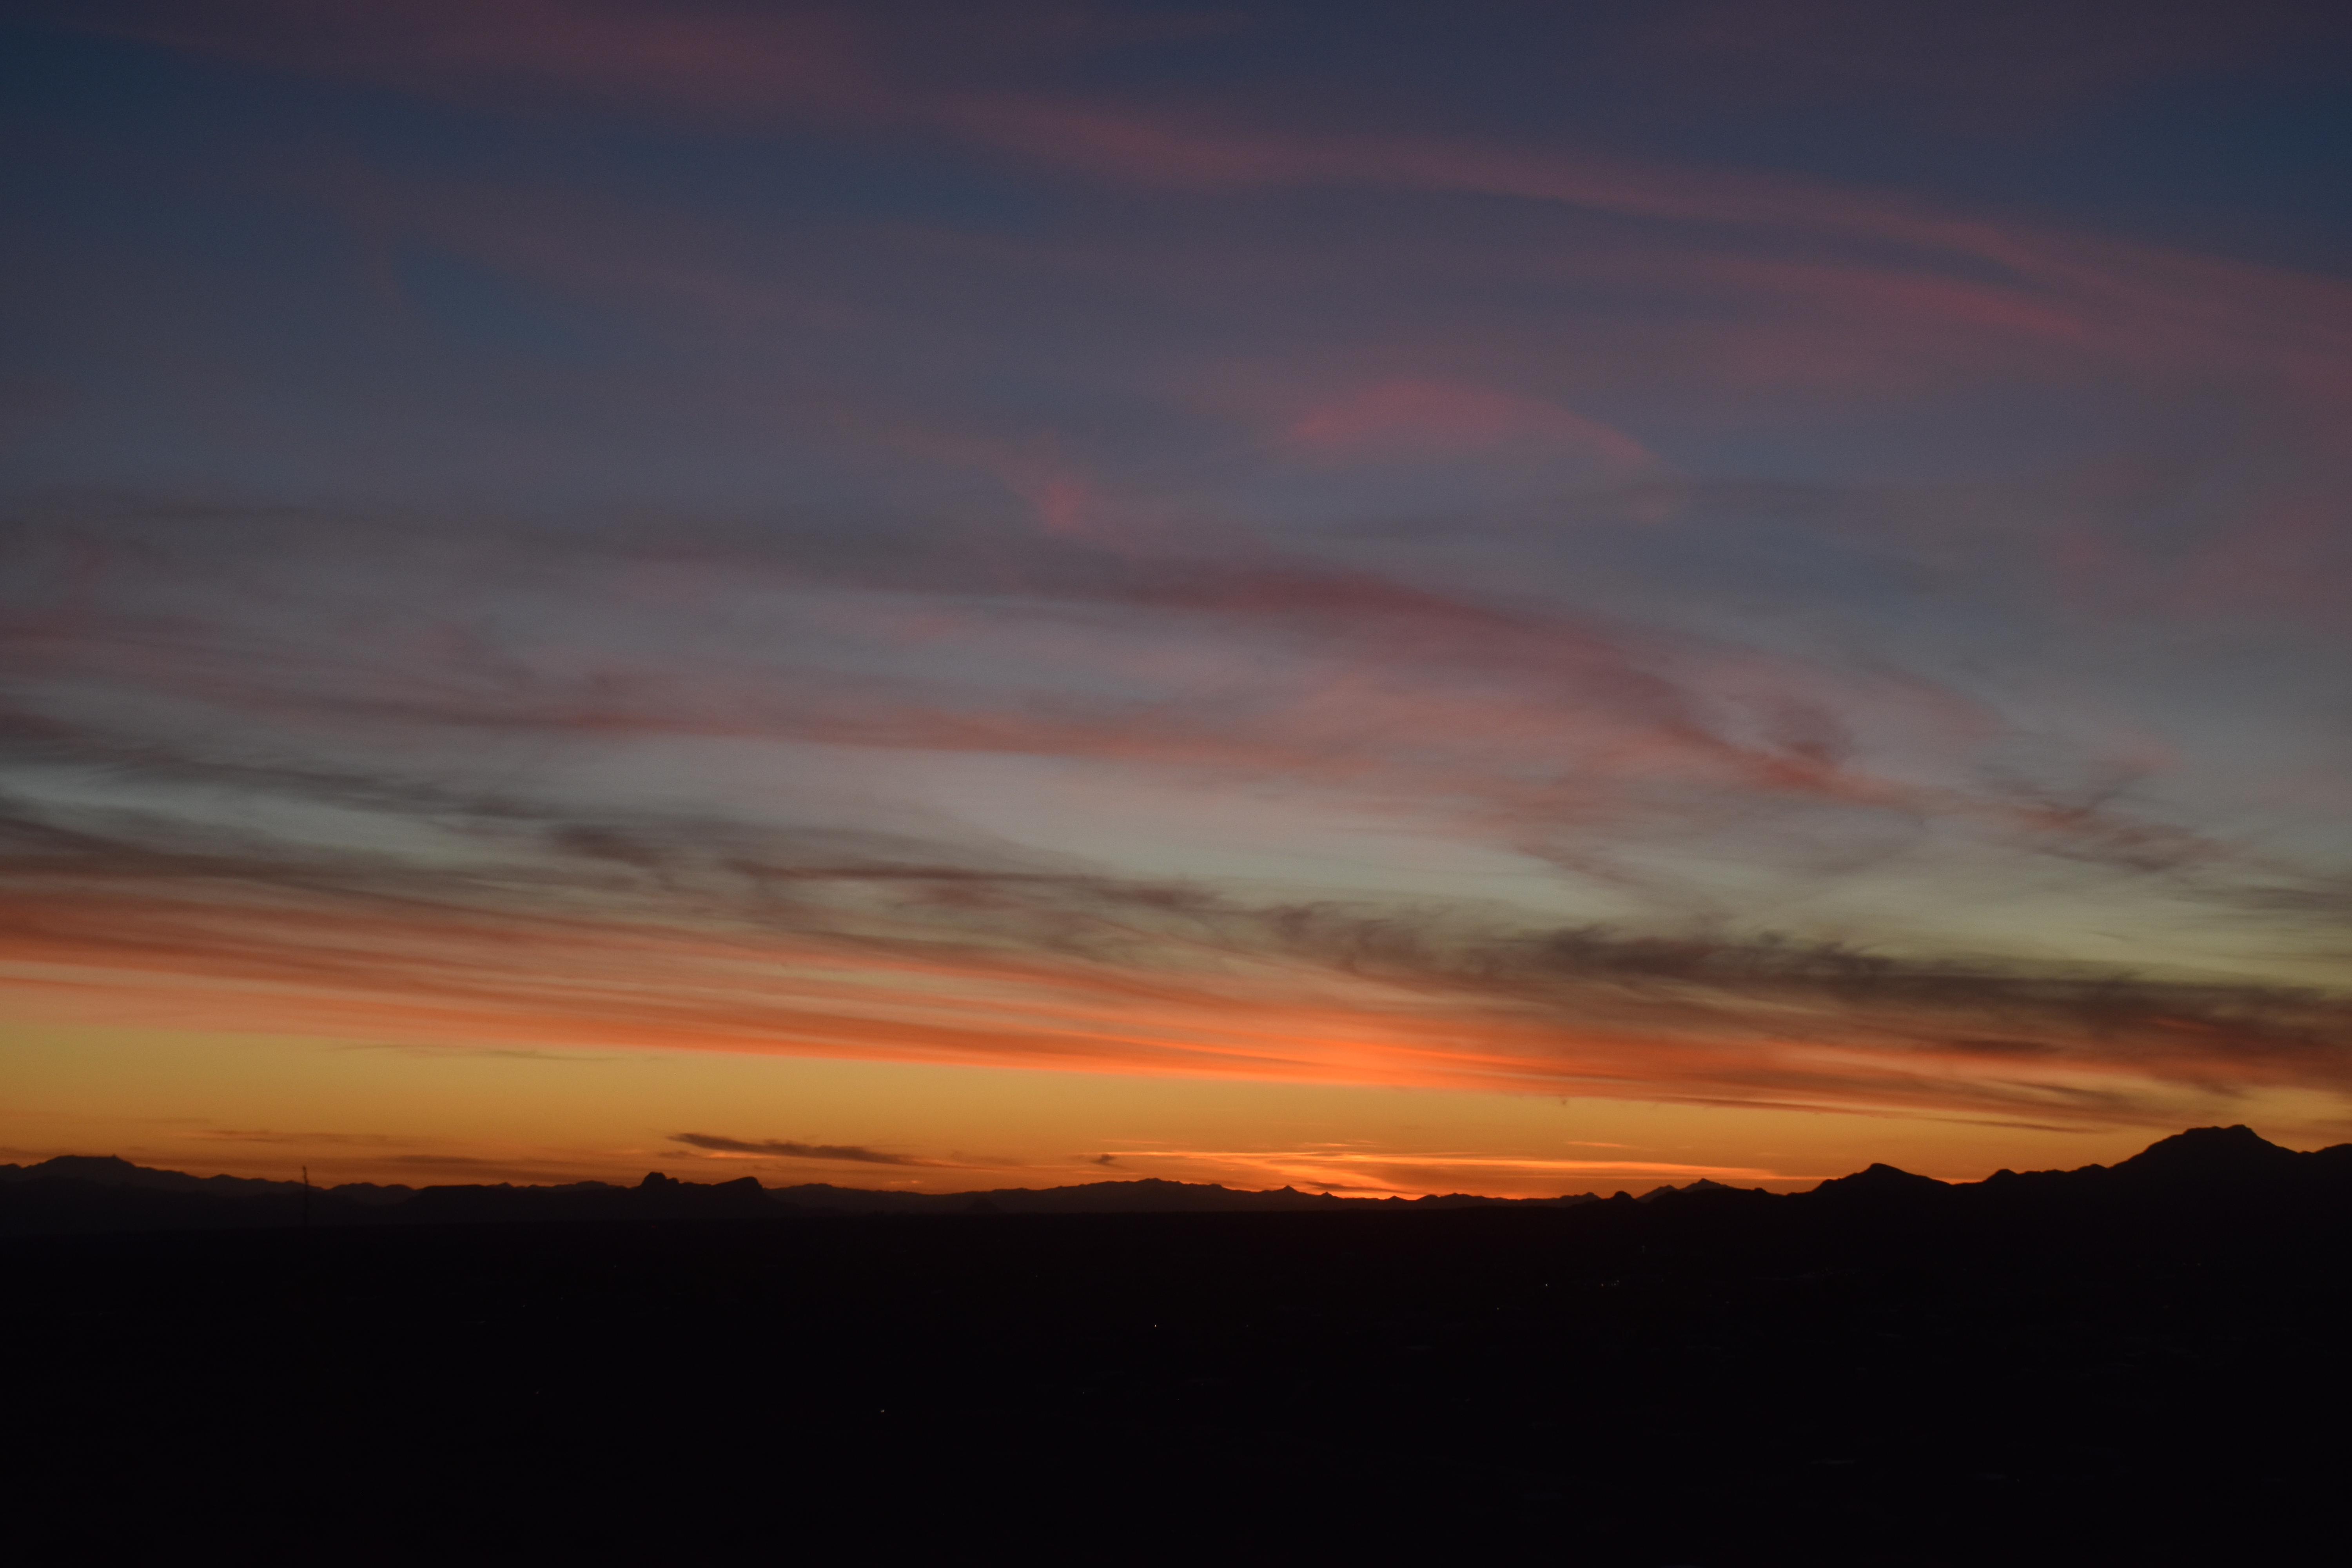
Have cameras ready for interesting clouds today as yet more storms approach. Winds at 500 mb (around 18,000 feet above sea level) are forecast to approach 100 kts by tonight (oops, TOMORROW NIGHT! Egad). With winds like that, likely will be some nice lenticulars around to add to your collection. Oh, I already see one downstream of the Catalinas….
Maybe some photos later if the upload problem can be resolved.
Its not resolved…. But, trying to look at the bright side, while this ONE photo was uploading, I got some more coffee, read a book (Cadillac Desert, Marc Reisner, and got a good start on, Mythical Rivers by Melissa Sevigny–both highly recommended for cloud maven readers.
6:27 PM AST last evening, though after the brutally slow uploading speed to WP, maybe its not the same day as I started this upload anymore….
Some more on the upcoming rain and wind event in the next 24-36 h:
From this keyboard, 10% chance of less than a trace (pitiful forecast), in other words, a zero from this storm, and 10% chance of more than 0.40 inches. The average of those two, which helps center a forecast in the forecaster’s mind, great or small, would be, say, 0.21 inches.
But the wind max during this storm event will be the most “interesting” part of it: 10% chance of puffs less than 35 mph, 10% chance of more than 65 mph , in this forecaster’s opinion. The average of those would lead me to think that very momentary gusts will reach 50 mph (averaging those extremes to center a forecast). So, the wind in the next 24-36 h is really the most interesting thing to keep an eye on; stuff will blow around, shingle fragments likely to come off. This is NOT a NWS forecast.
The End
——————— 1“Puffs”: almost instantaneous blasts of a few seconds.
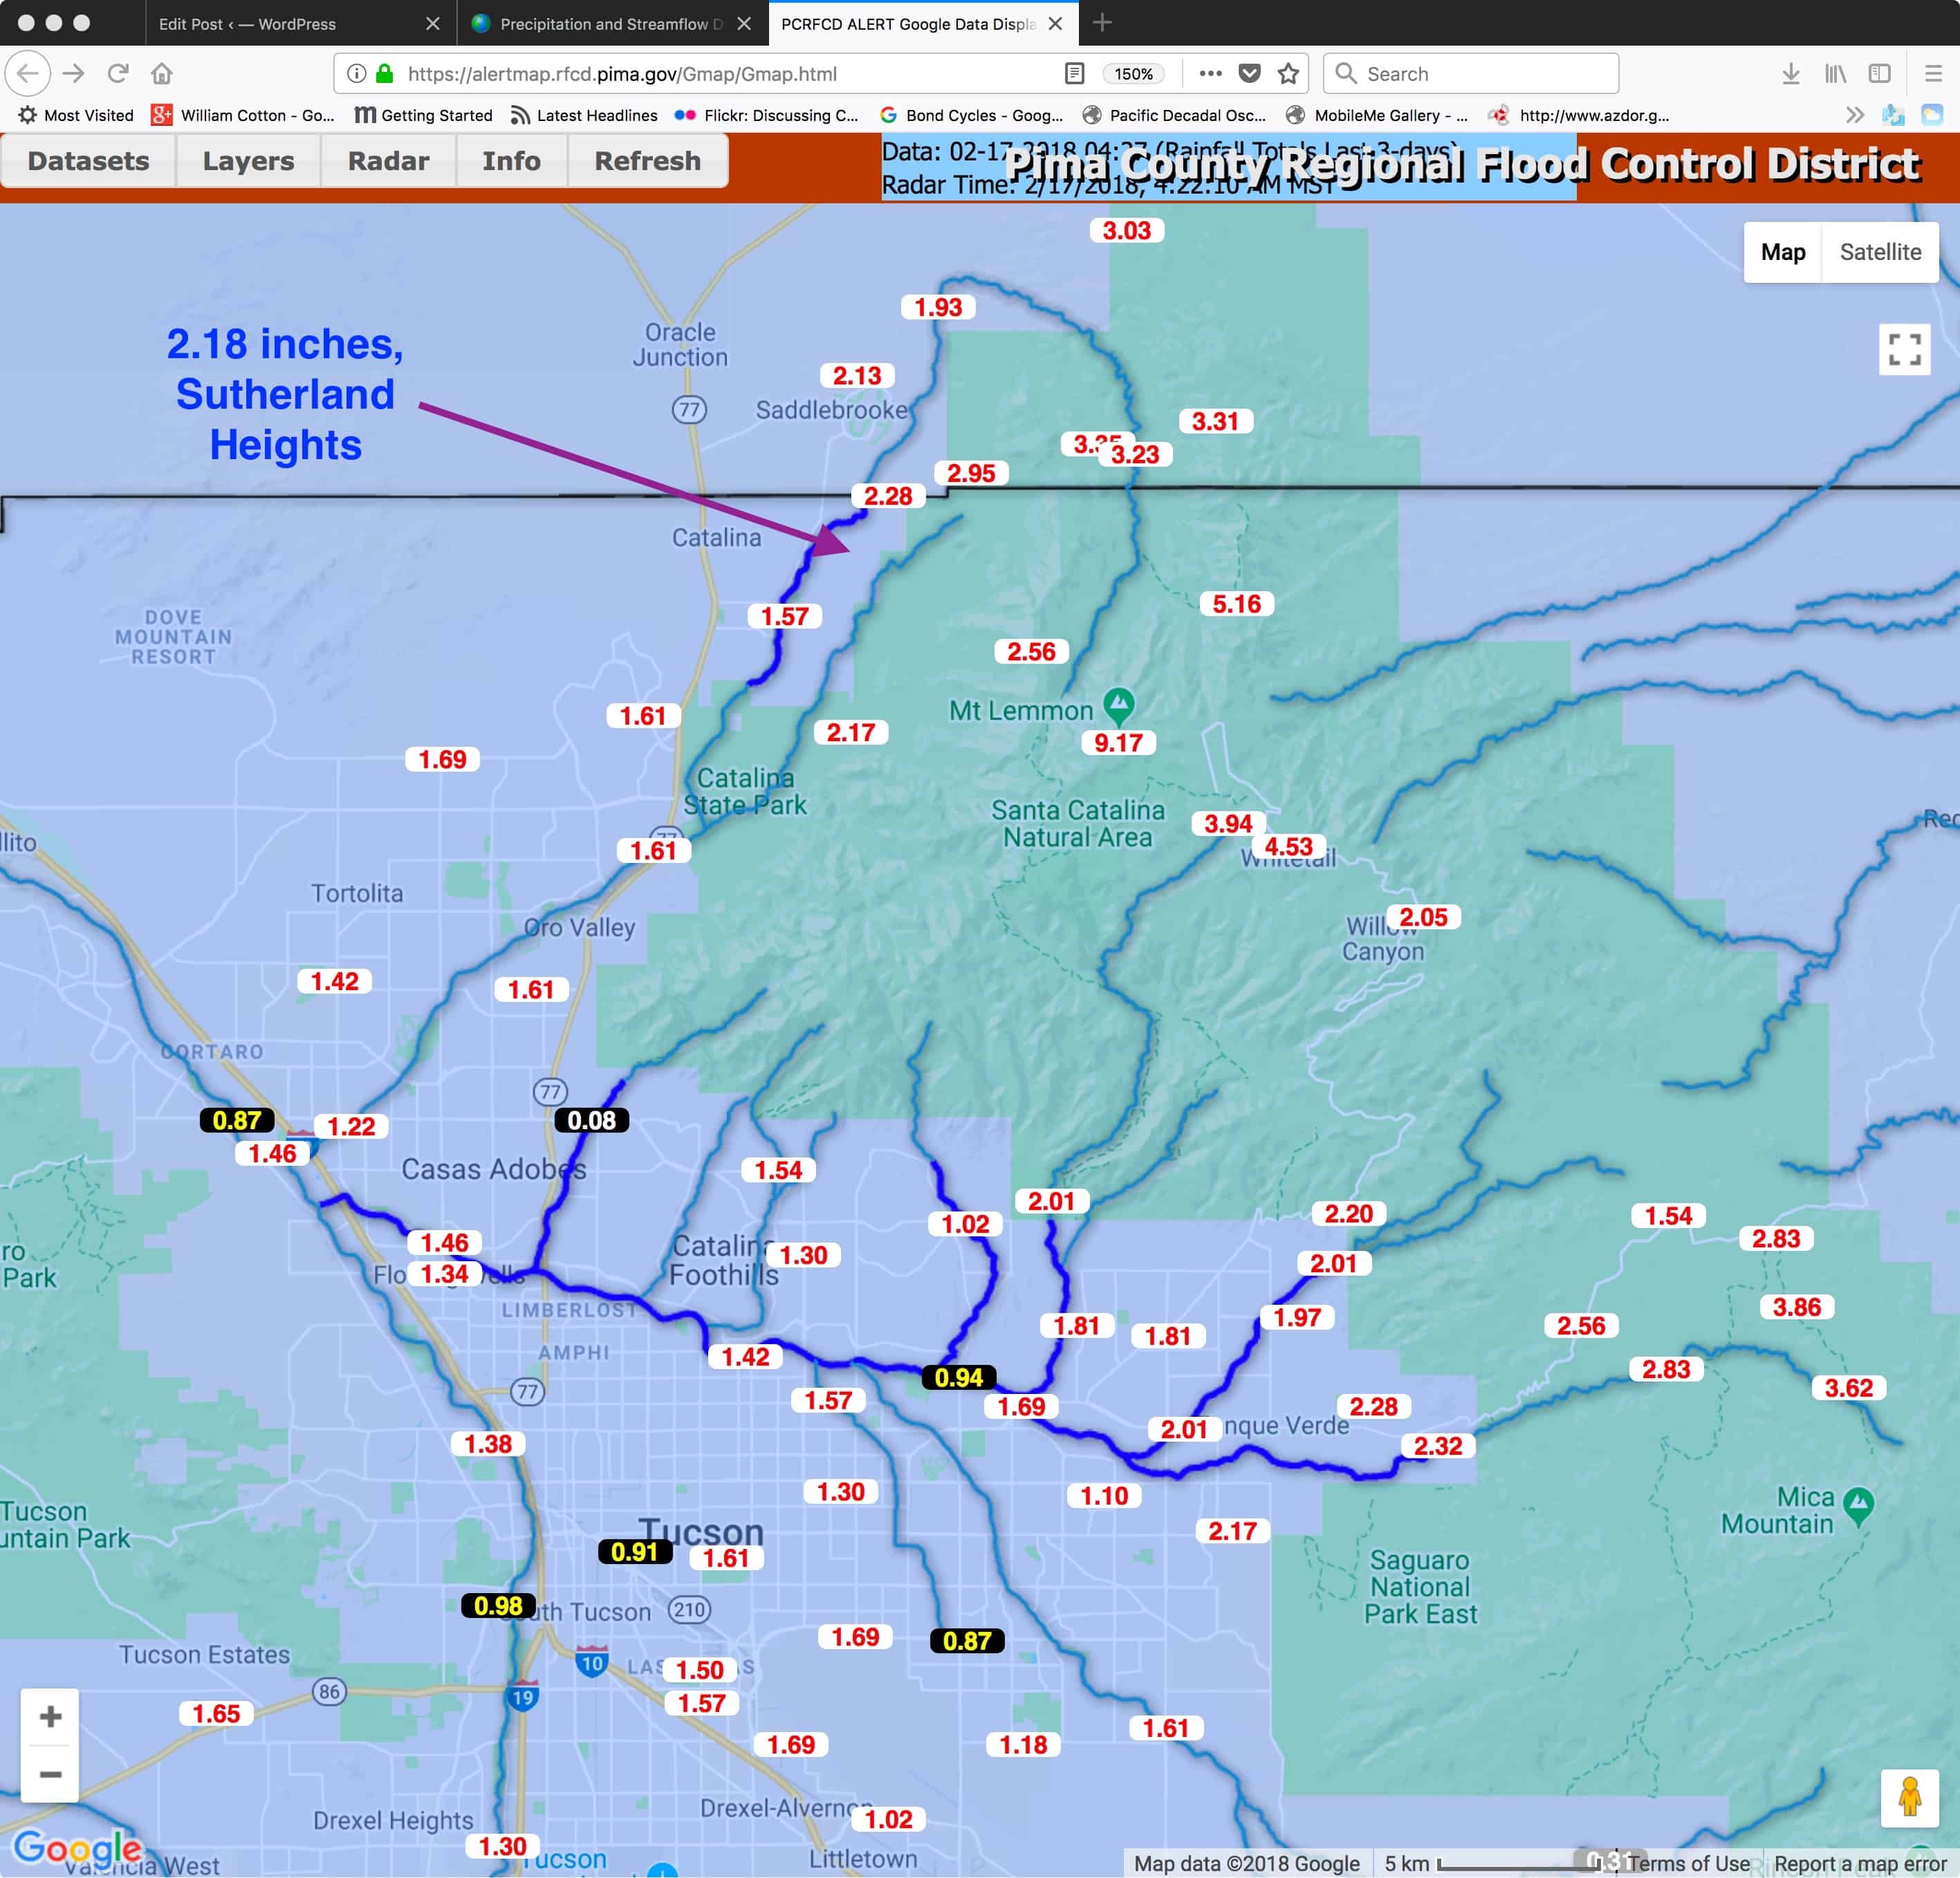
Toot, toot, drip, drip. Rain fell on Catalina, Arizona, for the third day in a row, bringing our three day total, at least in Sutherland Heights, Catalina, to 2.18 inches, and over NINE inches at Ms. Mt. Lemmon, subject to quality control later.
Here’s a nice map, courtesy of the Pima County ALERT network, whom I haven’t actually asked to post this but you can go here and see it in the original:
The three day totals for the Valentine’s Day starting storm of February 14th, of course, through the 17th, 4 AM to 4 AM AST. The map has been enhanced with a total over that time period from Sutherland Heights for comparison.
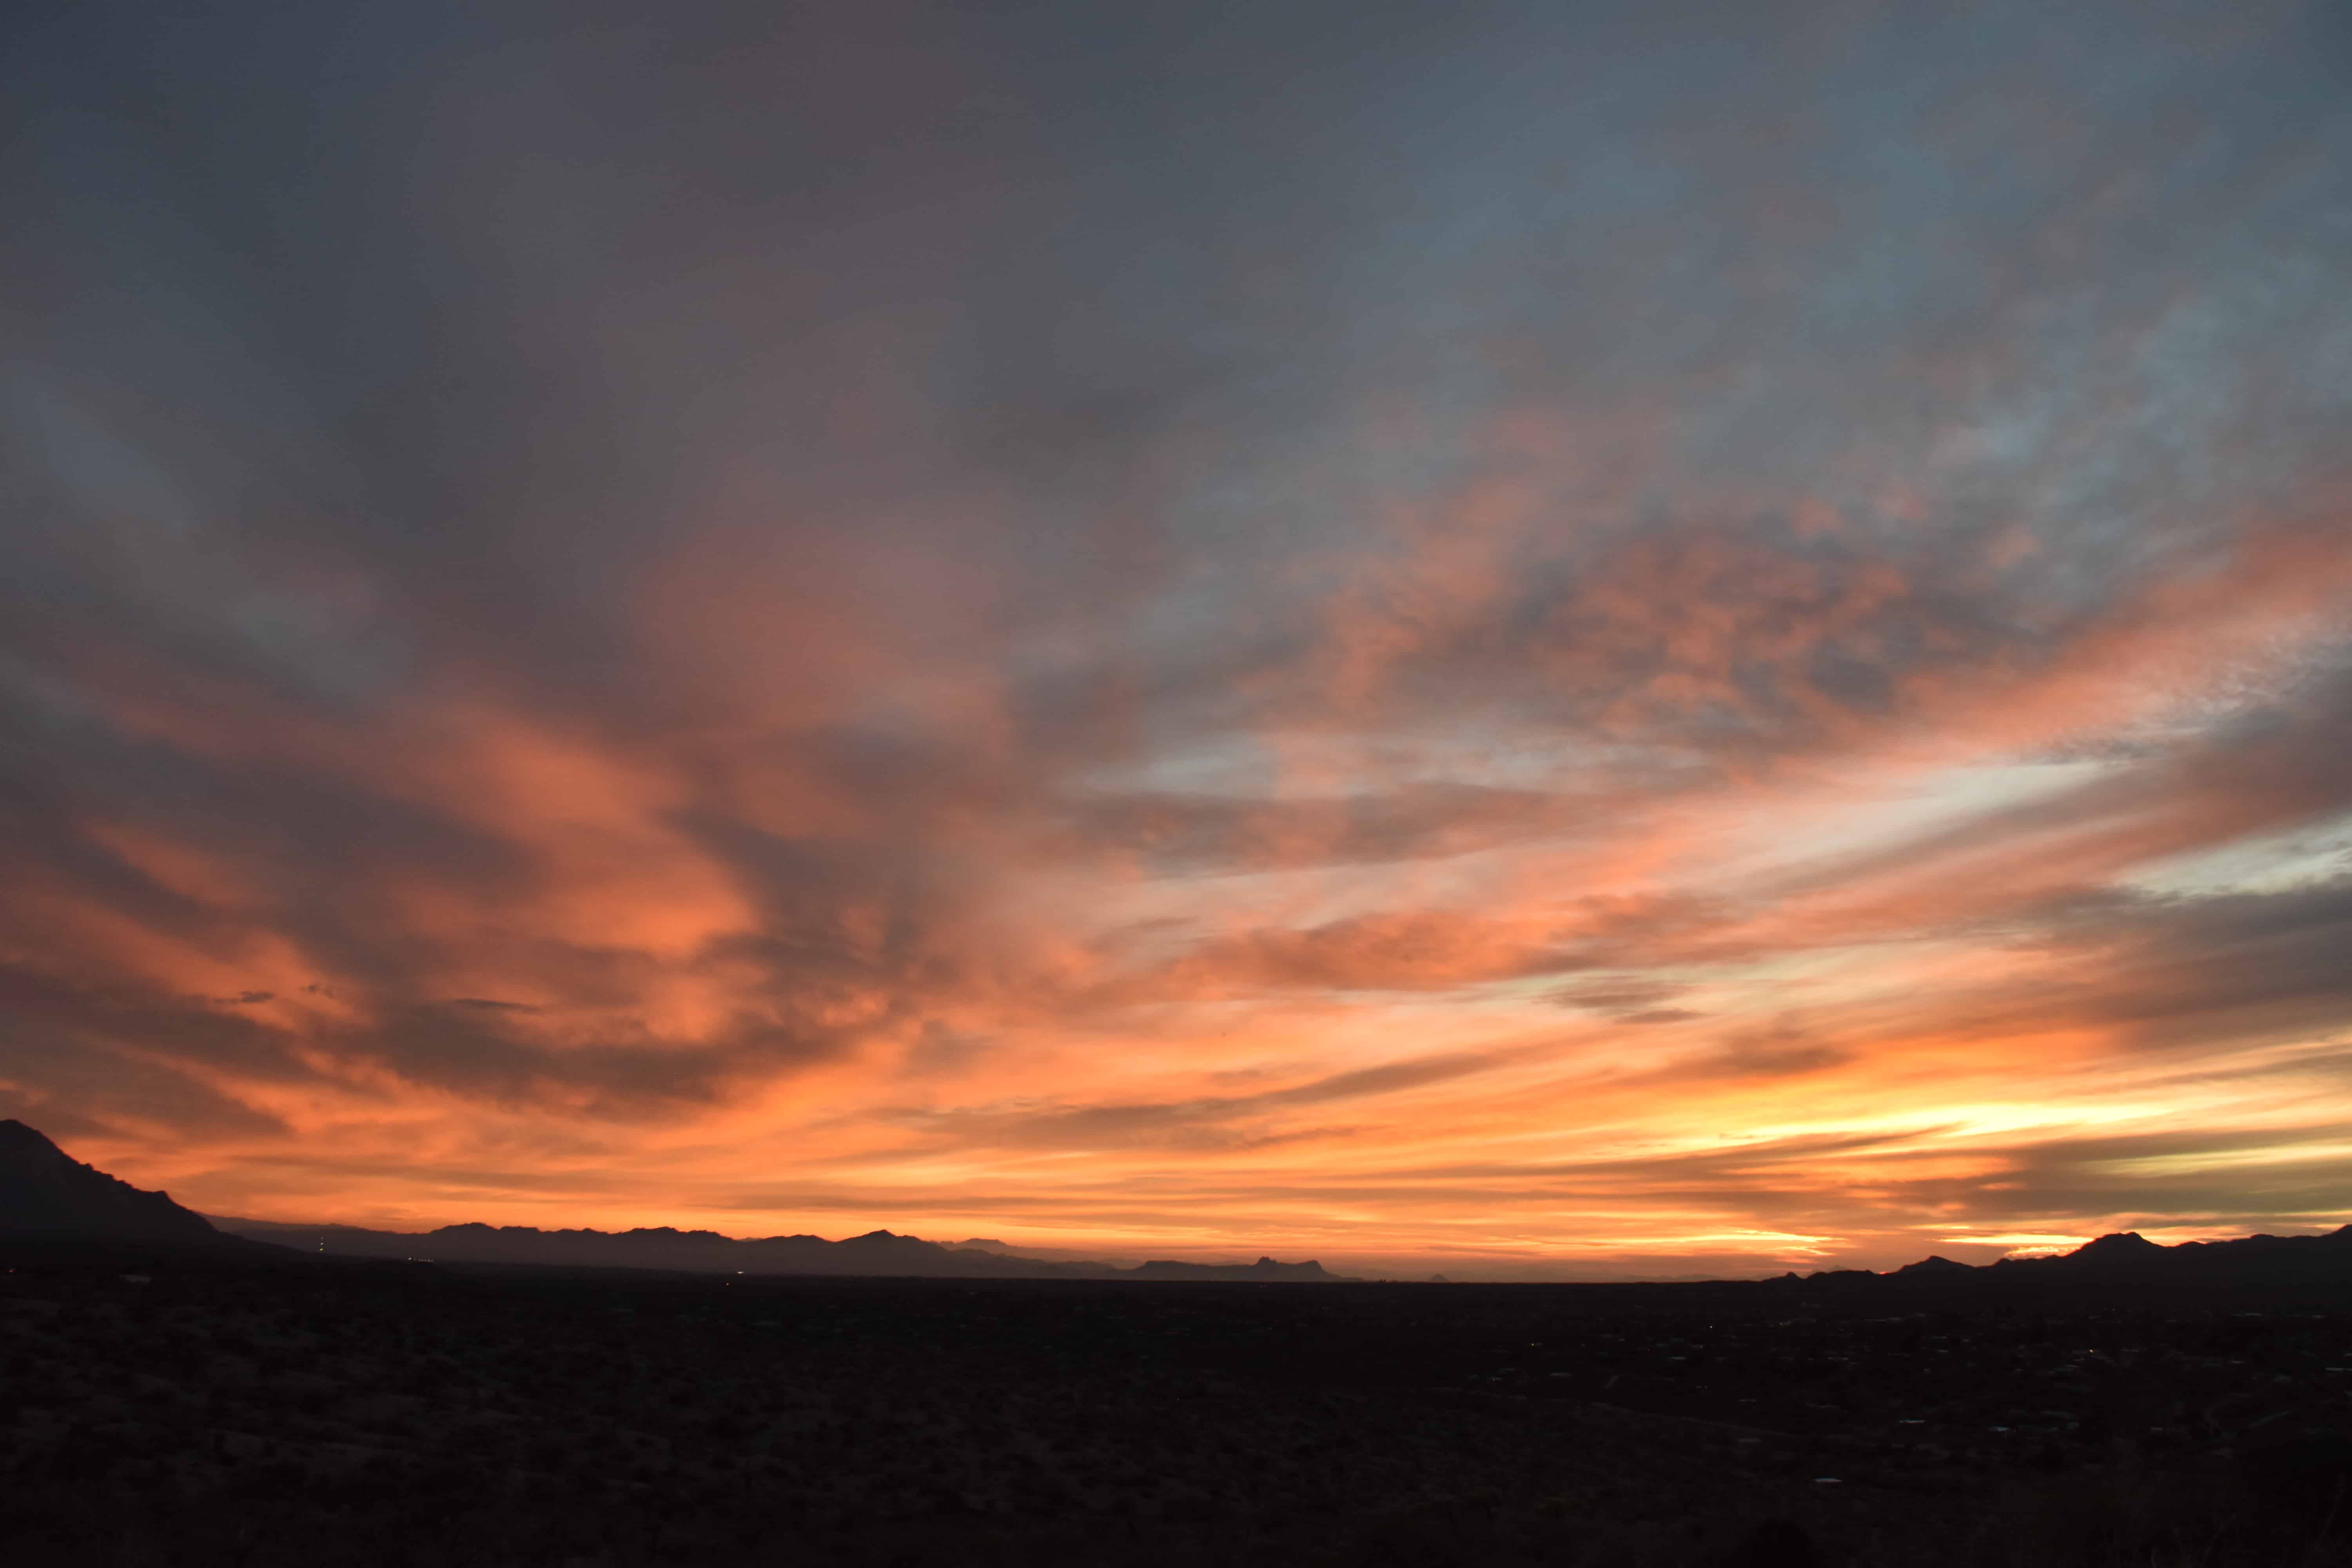
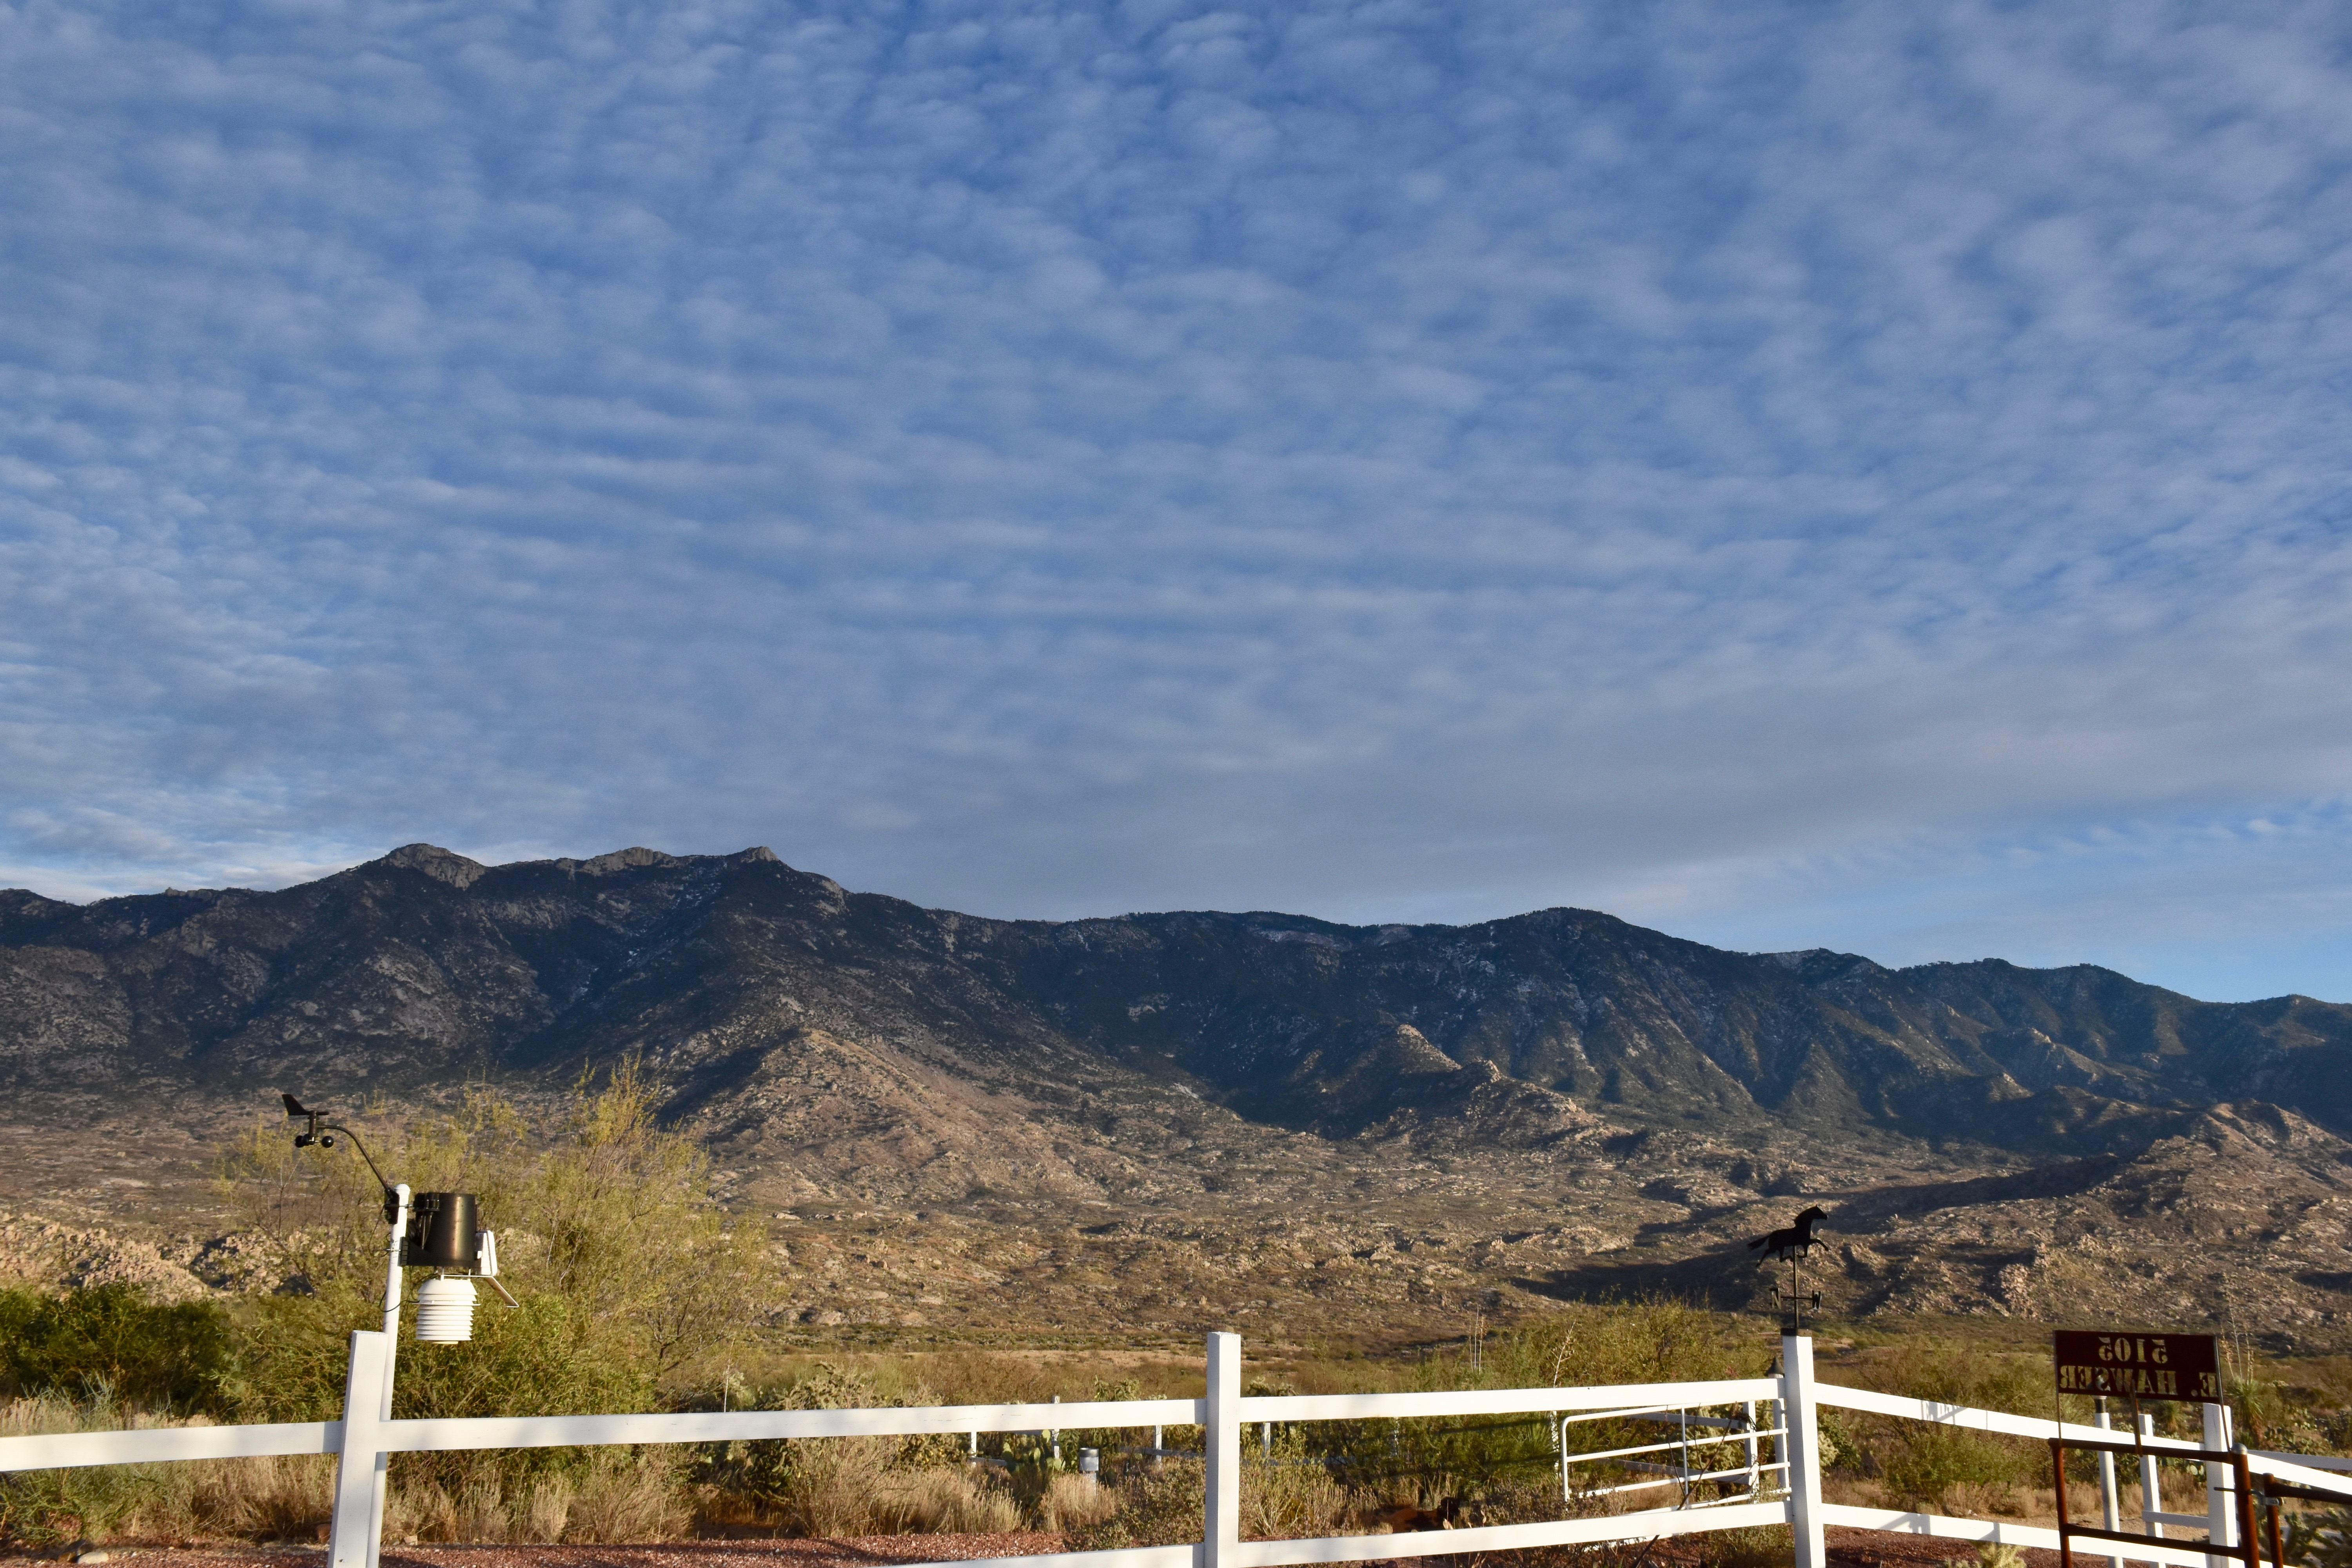
Yesterday’s clouds
No photos, still suffering from WP or godaddy hosting chokehold. Even text takes seconds to appear! Worse than dial up. The above jpeg, just 1.4 mb, took several minutes to upload!
The weather way ahead and soap-boxing the erroneous, “warm temperatures” expression
While the NOAA ensembles let us (me) down in mid-January when it appeared that troughs would dominate in late January through early Feb (it wasn’t even close to that interpretation, and the first time I’ve seen those crazy plots do so badly, will go with them now and present a couple that strongly suggest the drought pattern has been decimated for Arizona and the Southwest; no more weeks of no rain or rain threats, with ridiculously warm days (note, not days with “warm temperatures”, a temperature is a unit of measurement, not a thing that can be cold or warm—-got it? Its the AIR that’s warm or cold, or a day, a month. What if, when a high pressure sat on Arizona, that I said we had really “dense millibars today”, to make a comparison showing how WRONG it is to say, “warm temperatures.” Its HIGH temperatures or LOW temperatures, etc. Tell your friends….
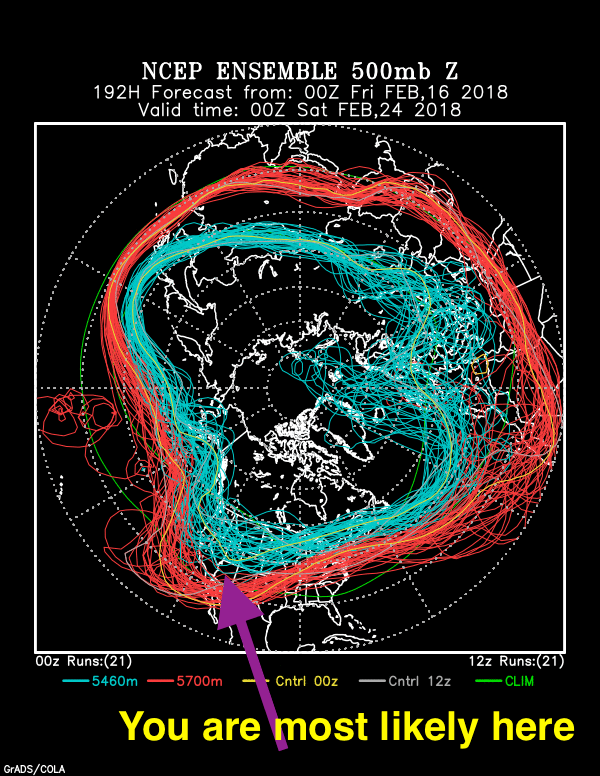
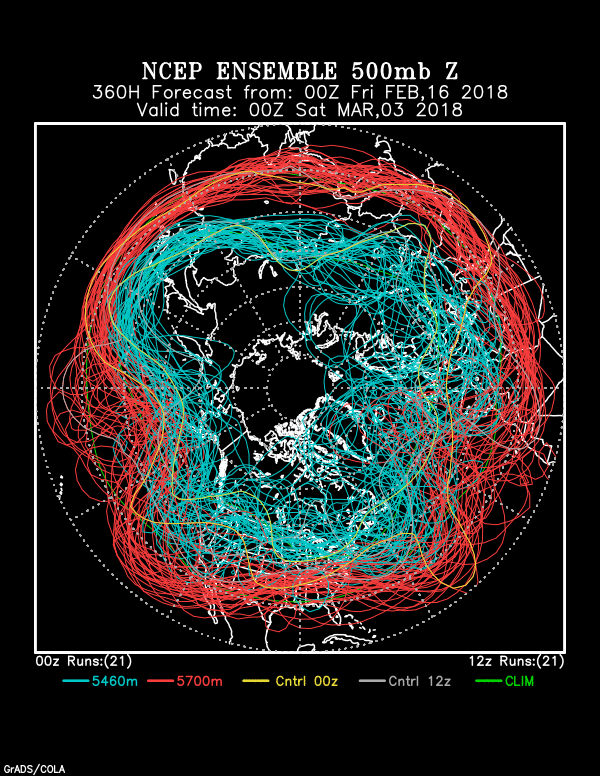
OK, will go through that bit more of uploading misery with these stupefying spaghetti factory plots. Inspect them and be happy if you like unsettled weather, storms threatening or actually occurring every few days. The first one is a week from nows, then ten days from now, and the last one two weeks from now. Exult over the troughulent regime we’re now in! Yay!
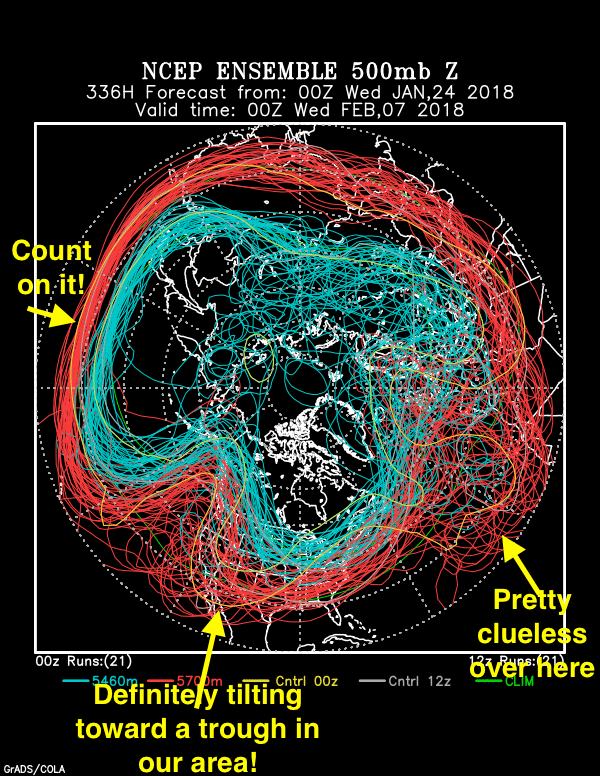
Note how the red and blue lines dip southward over the whole southwest US. That dip represents the location where upper air troughs will be occurring at this time. The red lines are more or less the periphery of the jet stream on the warm or tropical side, and the blue lines nearer the heart and cold side of the jet stream.
This “ensemble” approach, where tiny errors are deliberately input into the model data as the computer run begins is deemed one of the great advances in forecasting, this due to more powerful computers that can crunch so much global data so fast. There are always errors in the data, and we can’t measure the atmosphere over the whole globe in an instant, and this is a way of determing what the errors might do to the forecast. Heck, we don’t even know what the real errors are. So we input some and see what happens.
The greater the effect errors have, the more spread out and chaotic the patterns are. When the red and blue lines stay close together, it indicates that at least, tiny errors, don’t have much effect. Normally, after ten to 15 days, the lines are kind of a mess, with only general patterns discernible. (Sure is annoying typing and waiting seconds to see what it is you’ve typed!)
In last evening’s global data runs, the red lines in our domain stay pretty bunched up, indicating a strong indication of troughing over these next two weeks, even out to 15 days! So, cloud maven person is pretty excited thinking that maybe a wildflower or two can now pop up, and our spring greening will go forth.
Just yesterday on a dog walk to the Sutherland Wash, tiny plants were bursting forth from the ground. What a miracle that is. (The wash had no water in it.)
Sutherland Heights total as of 5:34 AM (tipping bucket): 0.90 inches! No way was this much expected from this keyboard. Looks like the rain is going to continue for a few more hours, too. Just terrific! Update: 1.21 inches in CoCoRahs gauge at 7 AM!
Catalina Area
0.87  Golder Ranch (Horseshoe Bend Rd in Saddlebrooke)
1.26  Oracle Ranger Stn approximately 0.5 mi SW of Oracle
0.94  Dodge Tank, Edwin Rd 1.3 mi E of Lago Del Oro Parkway               1.34  Cherry Spring, approximately 1.5 mi W of Charouleau Gap
1.38  Pig Spring, approximately 1.1 mi NE of Charouleau Gap
0.94  Cargodera Canyon, NE corner of Catalina State Park
0.79  CDO @ Rancho Solano, Cañada Del Oro Wash NE of Saddlebrooke
0.71  CDO @ Golder Rd, Cañada Del Oro Wash at Golder Ranch Rd

Santa Catalina Mountains
1.42 Oracle Ridge, Oracle Ridge, approximately 1.5 mi N of Rice Peak
4.06 Mt. Lemmon, Mount Lemmon
1.42 CDO @ Coronado Camp, Cañada Del Oro Wash 0.3 mi S of Coronado
1.02 Samaniego Peak, Samaniego Peak on Samaniego Ridge  (looks low)
3.03 Dan Saddle, Dan Saddle on Oracle Ridge
2.20 White Tail, Catalina Hwy 0.8 mi W of Palisade Ranger Station
0.83 Green Mountain, Green Mountain
1.97 Marshall Gulch, Sabino Creek 0.6 mi SSE of Marshall Gulch
Let us look noew at the precursor clouds from yesterday:
Sorry, no images. It took more than 2 h to upload several images yesterday, and now, as also has happened since downloading the latest version of WP, several seconds before I see what’ve typed!
This has been going on for weeks and weeks, ending the fun in blogging.
Will be spending the next few weeks either moving to another hosting site, blogspot, or figuring out why WP has become unusable (again).
We often have phony dramatizations suggested by titles with exclamation marks, and frankly, today is no exception. I do like Cirrus, though. Hope you do, too.
Why like Cirrus1?
They provide a lot of nice sunrises and sunsets. EOM.
Example of a recent CIrrus sunset, FYI.An example of a recent display of Cirrus at sunrise.
Yesterday’s displays of Cirrus, ending with a scruff of Cumulus toward Pusch Ridge:
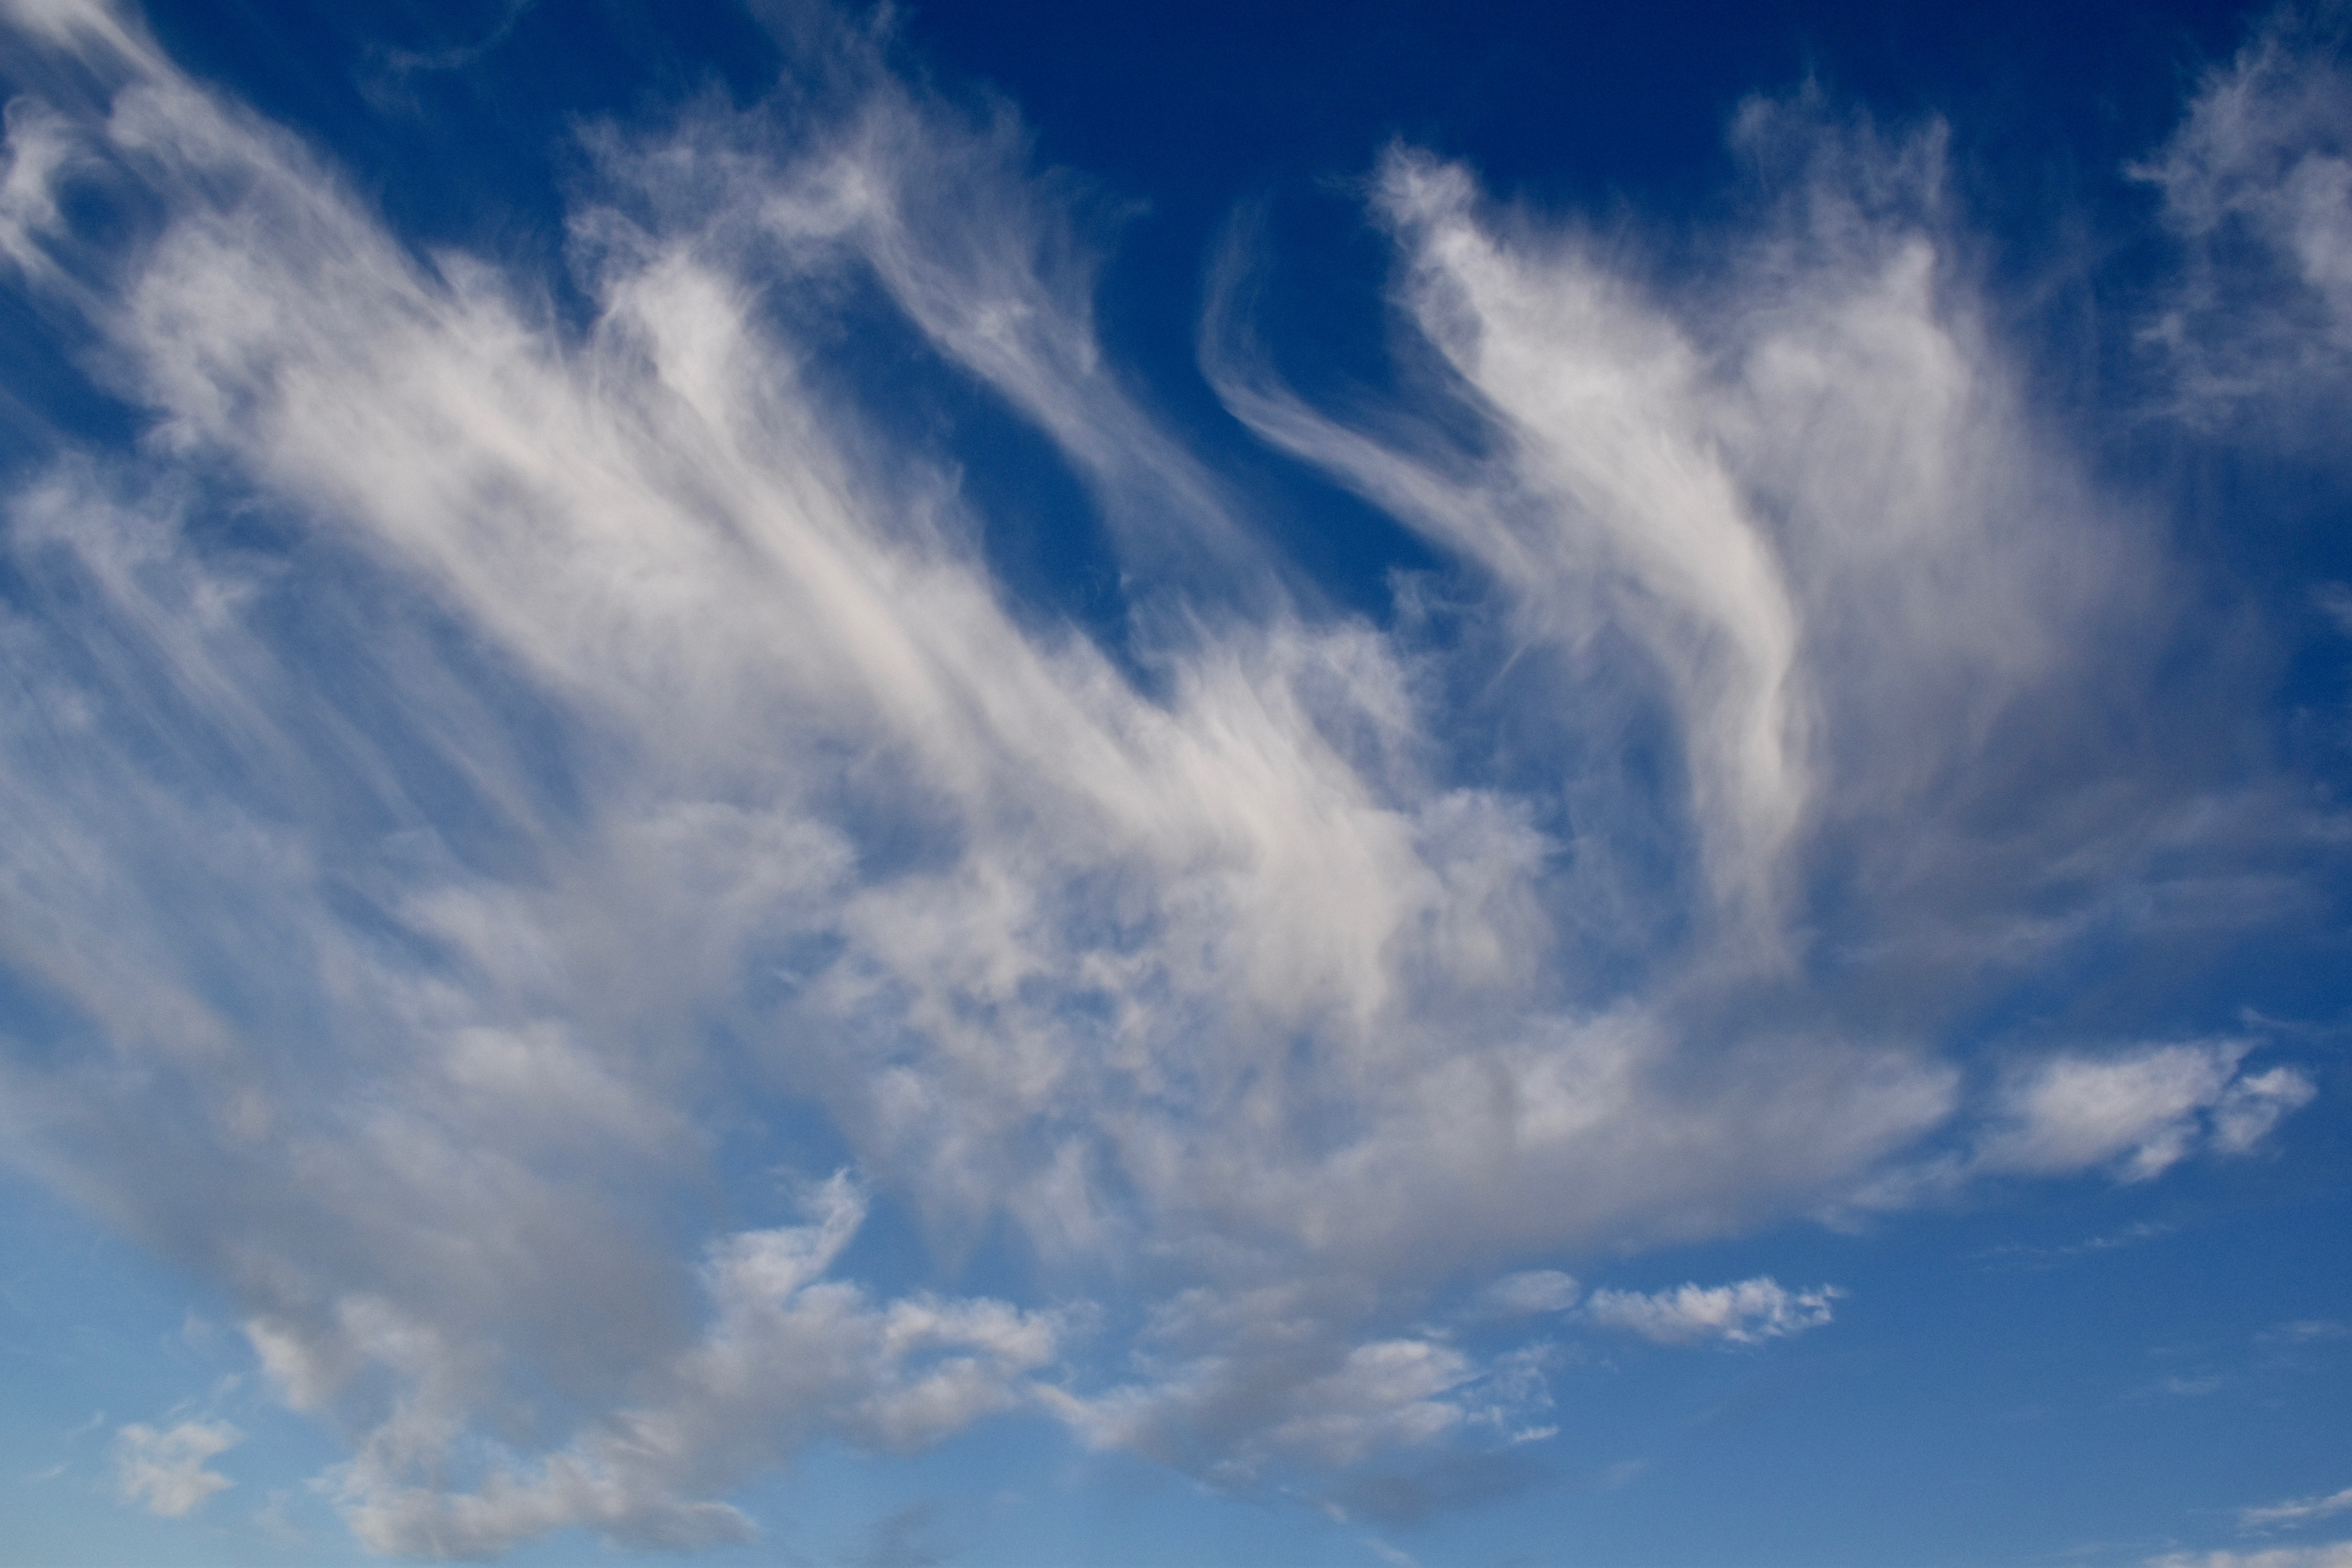
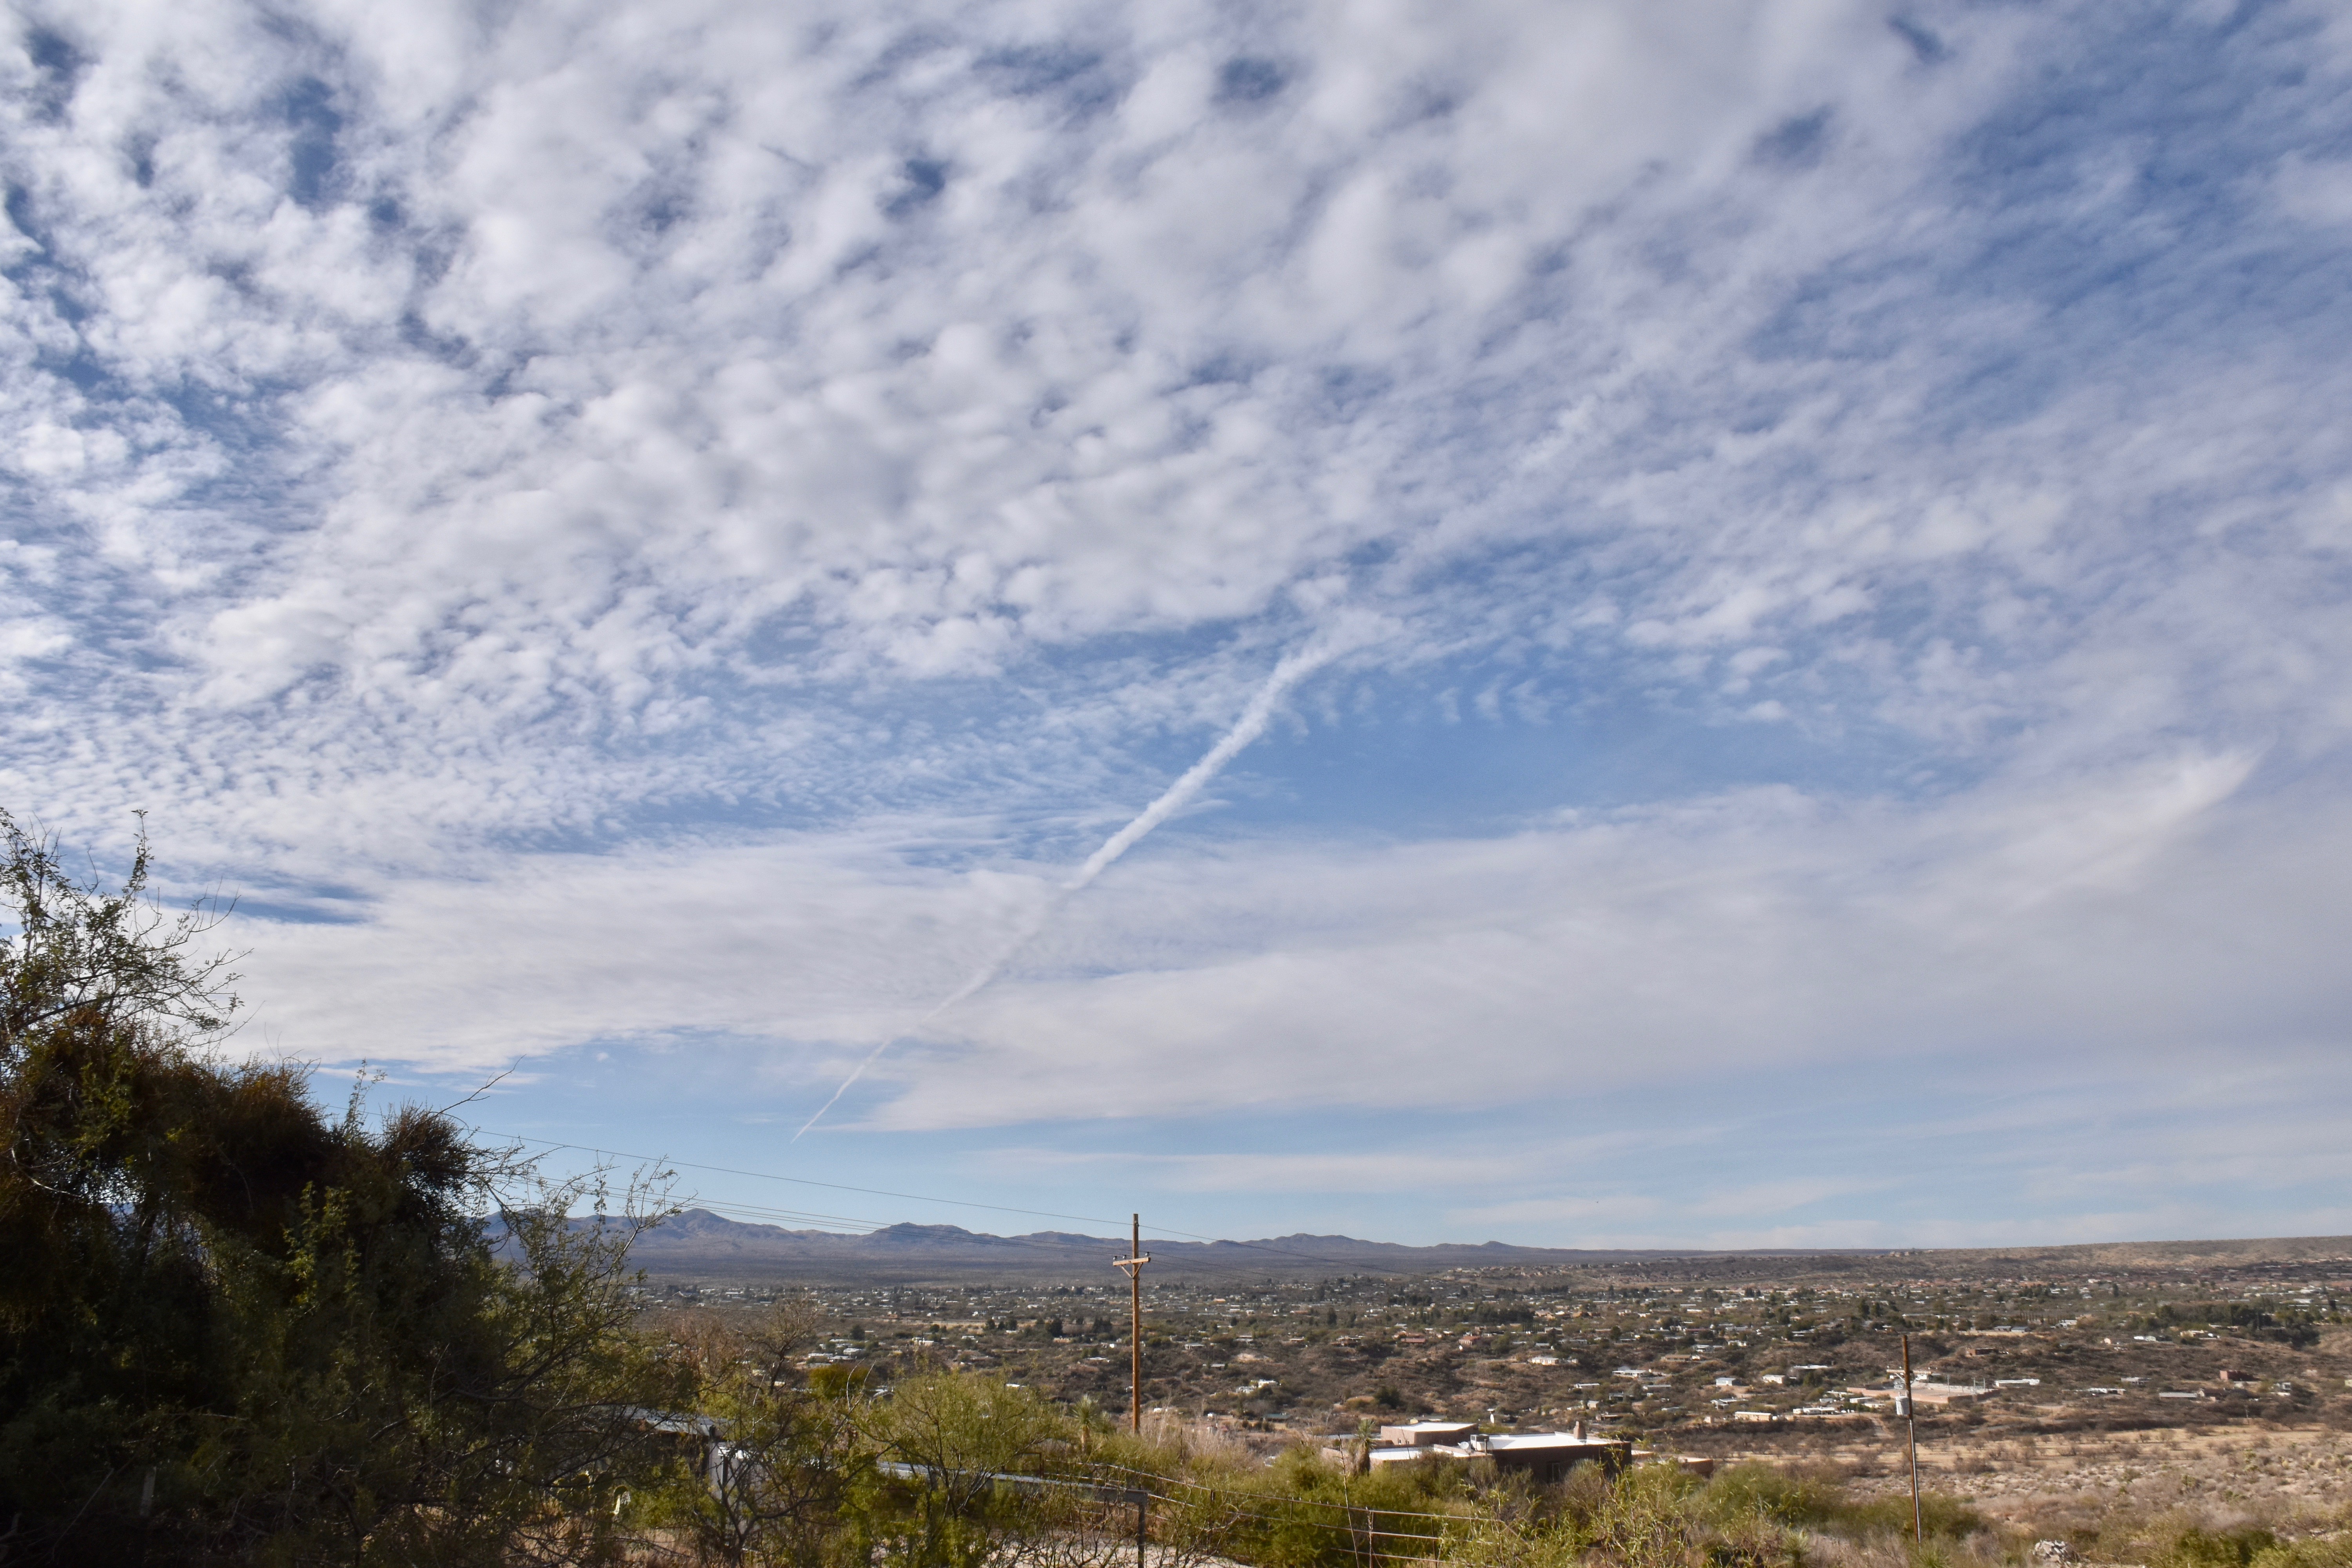
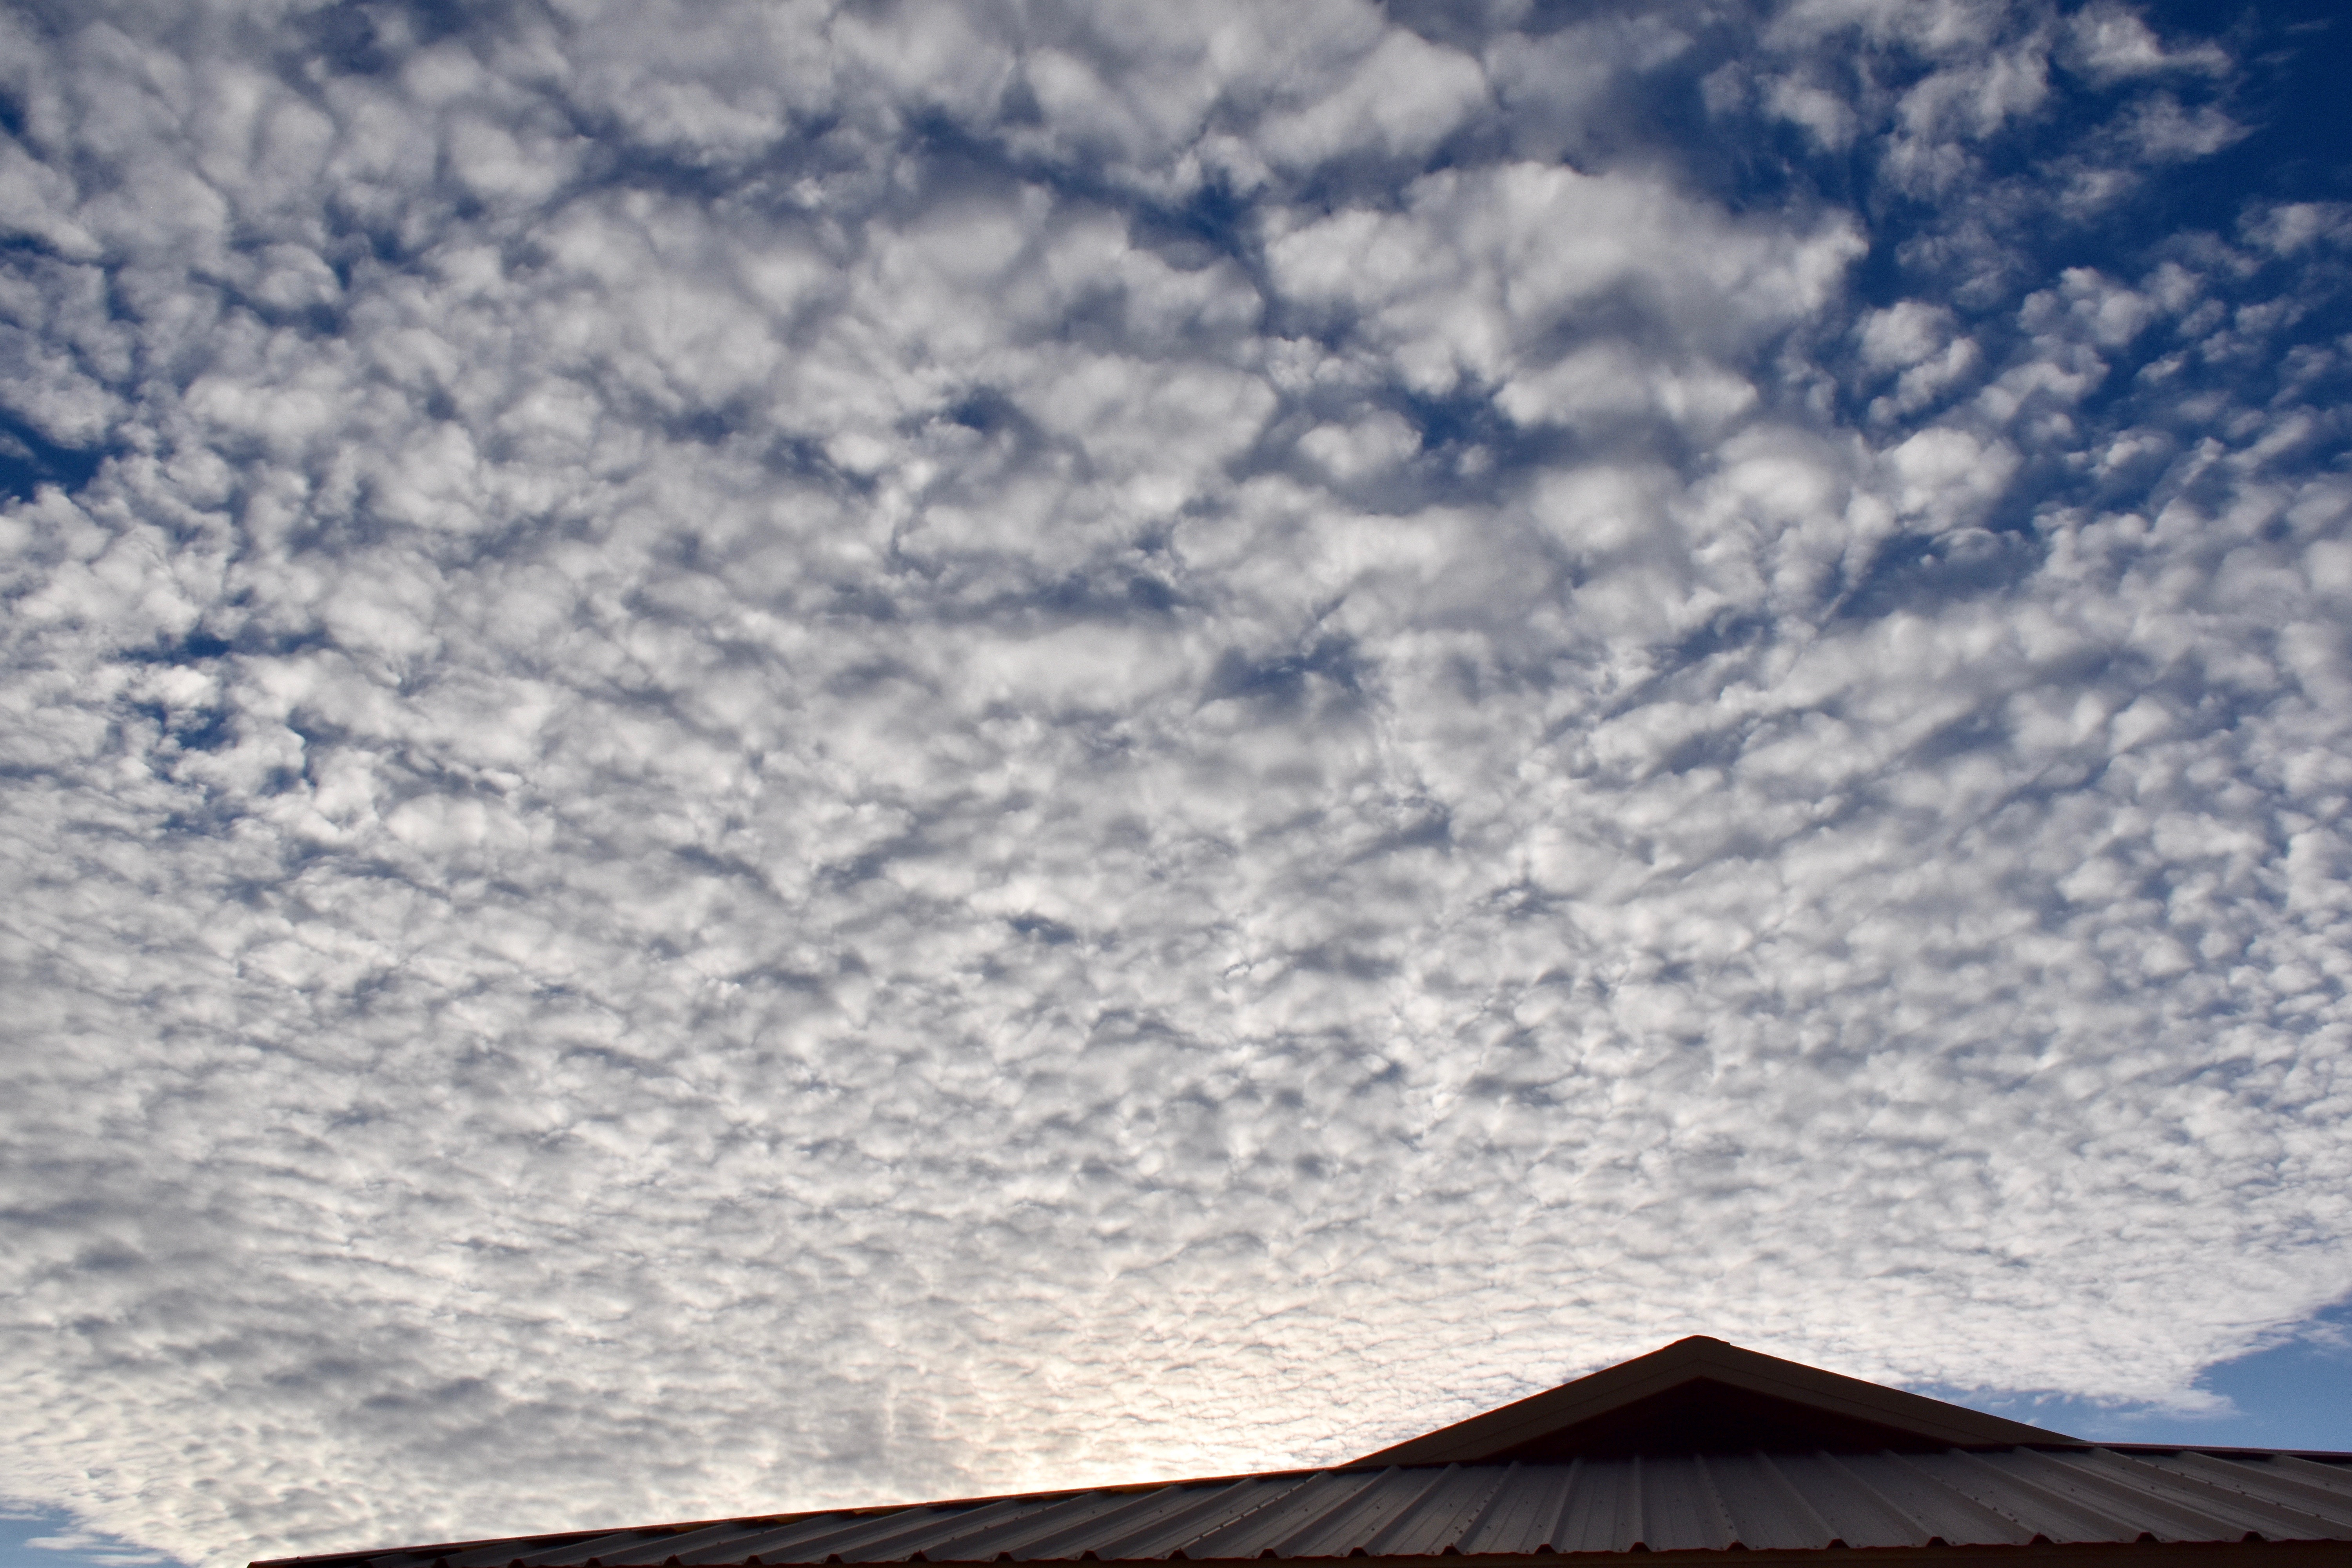
7:29 AM. Cirrus castellanus, or what we sometimes call, “Altocumulocirrus” because it looks so much like just Altocu.
At least 0.02 inches, as deduced from this keyboard–haha. Should be more than that, but, in a rain of drought, everything seems to work against getting a major rain. Raindrops will possibly begin as early as 12:02 AM on February 15th, though probably not. Maybe a day or two later if a tropical insertion of moisture around a low passes east of Catalina. In that case, we’ll have to wait for the Pacific polar air to reach us near the center of that upper low as it drifts eastward.
What is certain is that clouds will once again present themselves in great quantities over our skies in just a few days. The colorful sunsets and sunrises that visually spoil us with so much splendor will return, too, after being mostly absent over these past weeks of drought.
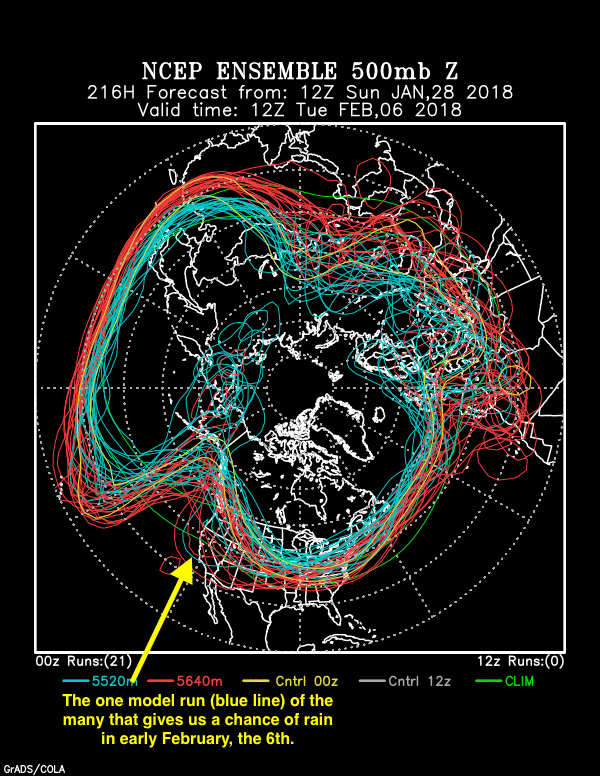
Blue, as in the 5520 meter height contour line as produced by a single run of the many NOAA GFS model re-runs with those little “perturbations” of the starting data. Below, our only hope for rain here in Catalina is if the model run with a 552 decameter height contour over eastern Pacific across southern California (see arrow) verifies. Its an outlier, a rogue, a voice in the wilderness, etc.
From the NOAA spaghetti factory based on the global data taken and perturbed at 5 PM AST last evening. The thin blue line to which the arrow points, would be a major, rain/snow producing trough. But since its an outlier from the other blue lines, representing the heart of the jet stream, its very unlikely to happen, even if it is produced by an actual model run for this date and time.
Some background and diversionary writing in excess; skip if busy
Now that we have more powerful computers, we can run the same model over and over again with very slightly different starting data and then see how the results diverge from one another in the days ahead. In the first few days to week of the model run, the various outputs are virtually the same because the starting conditions are tweaked so very slightly. This is chaos in action! And it makes sense because we measure everything perfectly in the atmosphere at the same instant. So, little errors abound in our starting data anyway.
Think of E. N. Lorenz, “Dr. Chaos”! In fact, he thought our existing atmosphere could shift into a pattern resulting in an ice age without any external forcing (oh, like an interstellar dust cloud coming by for a few thousand years, the sun dimming, etc.)
Pretty amazing thought when you think about it, which you just have.
Nobody really thinks that today, but he threw it out on the table in his seminole (haha) paper, “The Intransitive Atmosphere” back in 1967. He also wrote about that kind of thing in the 1968 American Meteorological Society Monograph, “The Causes of Climatic Change“, papers by 22 of the leading climate authorities of that time. (Based on a 1965 conference at the National Center for Atmospheric Research, located in “Potville”, CO (aka, Boulder-haha. But, they really do love their marijuana in Boulder…).
Strangely believe it, in a further diversion from current weather and a mea culpa downstream that maybe you won’t get to with a lot boring writing before it: not one paper in that AMS Monograph was about the climate effects of CO2! Talk about being asleep at the wheel! Wow.
Well, OK, you can’t blame them too much.
The earth’s temperature was slipping downward in those days, and while it was well-known that the effect of CO2 was to cause warming, it didn’t seem to be having enough effect to counter the cooling, and we were only just getting obs of CO2 from Mauna Loa. Sure, its kind of an embarrassing chapter of science, so your not gonna hear much about it from scientists; the monograph above is almost never cited, or course. We like to avoid mentioning embarrassing chapters.
I could name some others, in my specialty, like those cloud seeding experiments at Climax, CO, in the 1960s which looked so good, so complete, and fooled the National Academy of Sciences because it was really all “smoke and mirrors.” Or those in Israel in the 1960s and 1970s that fooled everyone for a long time, too, but, upon further review, were also “smoke and mirrors.” Yes, that’s right, there was a “consensus” of scientific opinion about the results of each of those cloud seeding experiments that for a time was wrong, as, to beat a dead horse, happened in the early 1970s concerning the prospect of “global cooling;” the preponderance of scientific thought was that an ice age was ahead (as indicated by a climate change conference at Brown University in 1972, the results of which were summarized in Weather and Climate Modification, 1974, Wiley-Interscience publishers, W. N. Hess, Ed. Hell, the earth was cooling, so it made sense at that time!
Pretty amazing when you think about it, which you just have.
We know better now. CMP, like most everybody else, is predicting warming dead ahead, only how much is in question.
Here, we address embarrassing chapters head on, if anyone is still reading, which I hope they are not. Check it out.
About 13 days ago, the NOAA spaghetti ensemble factory showed a result that strongly “IMI” (in my interpretation) indicated a vast weather change beginning at the end of January. Sure, it was WAY out beyond what we consider to be a reliable forecast window, and unprofessional to make a forecast that far in advance, that is, much beyond a week, but the signal, the bunching of lines was so great, I went for it anyway. I got excited and brought to your attention that a likely drought-interrupting weather change was to occur in 12-15 days from then, troughs would occupy the entire Southwest beginning at the end of January into the first week of February.
Its not gonna happen.
Cloud maven person was too confident in his interpretation of spaghetti back then, that a trough positioned in the SW was virtually in cement; it had to happen. I was so excited and so wrong, got carried away, like I did with Sharon so many decades ago, thinking we were surely going to be a couple. I was rongno then, too. Arthur Rongno…. Oh, well, we learn and sort of move on.
Oh, there could still be a major trough toward the 5-6th of February, but as the title imputes, we’re down to a single blue, a rogue contour produced by one of the many model runs repeating forecasts last evening with those little errors in starting conditions. the Lorenz model runs. 🙁 🙁 :{
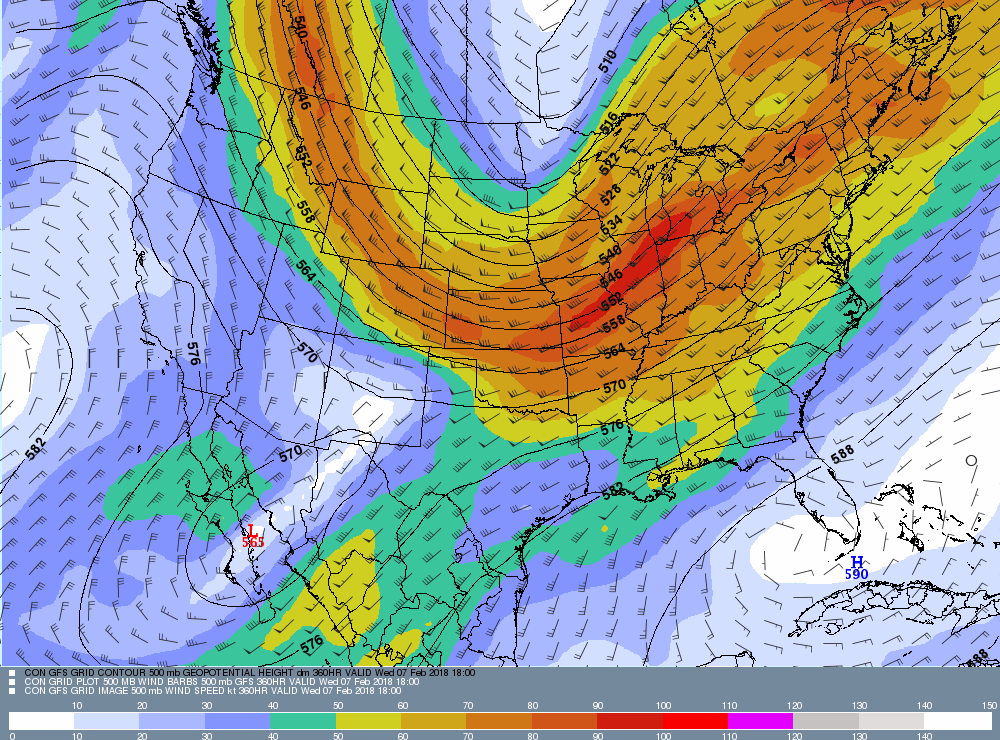
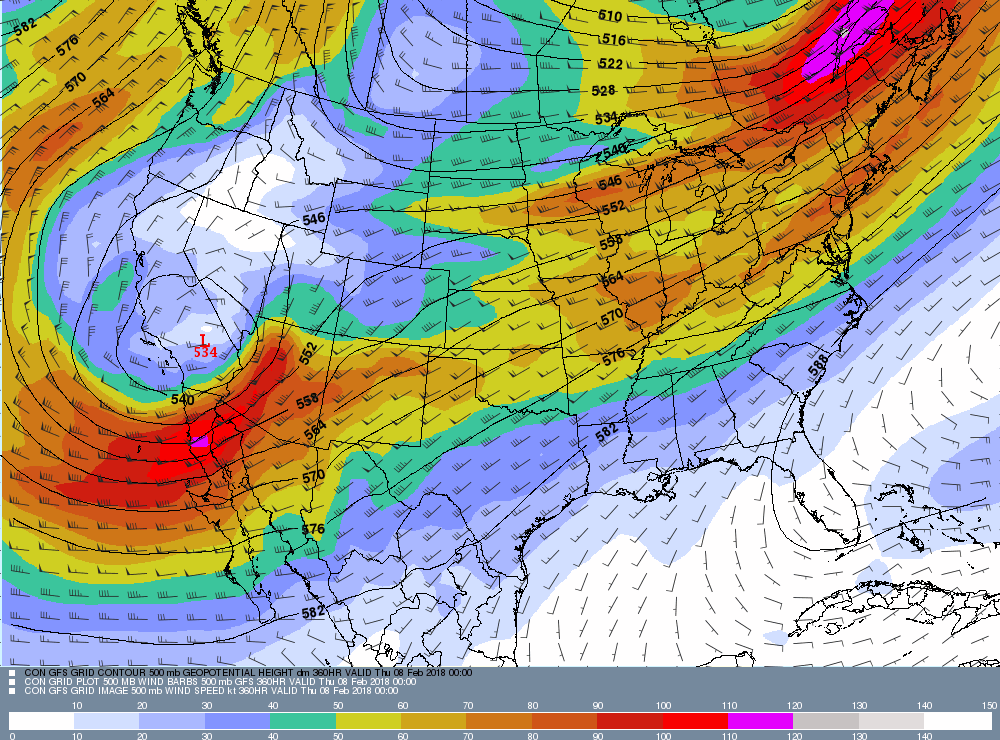
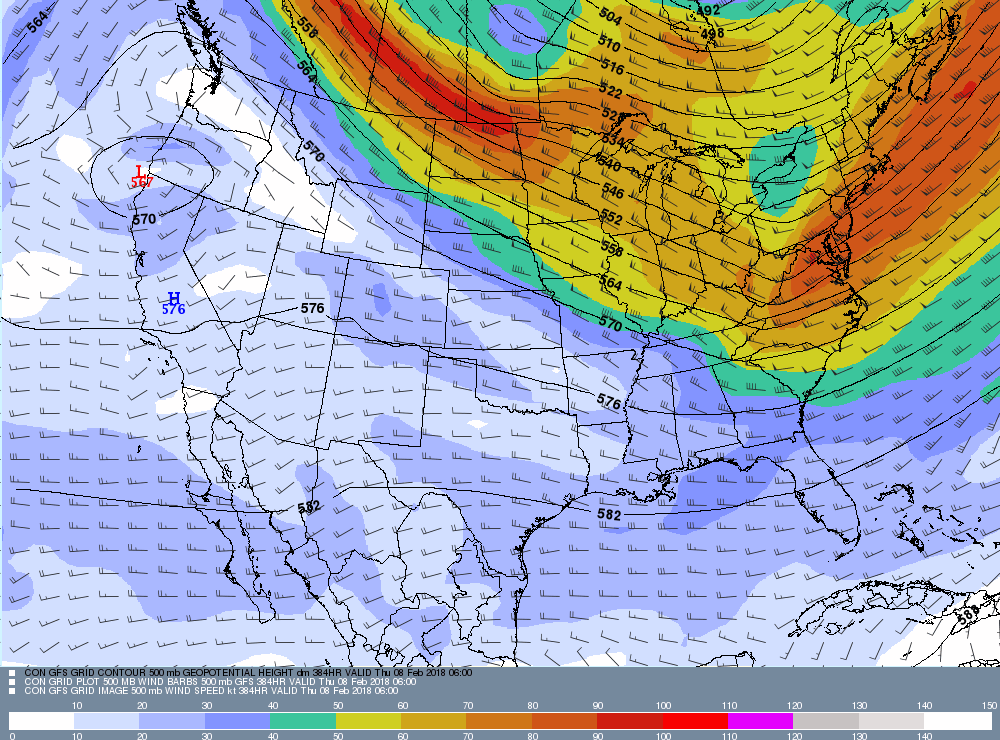
Check this out. Unbelievable, really, though it is kind of what our ensembles have been telling us would happen. These outputs of jet stream location shown below are but 6 h apart, and that’s what makes this comparison so remarkable; they are so drastically different (check how the orange colors have moved around, and then say, “Oh, my gosh!!”):
The question now is which one is right?
The answer, of course, is NEITHER ONE!
They’re both a little crazy because exact forecast maps like this for 300 h (13-15 days) can never be relied on exactly.
But, here’s where we fall back on our ensembles (spaghetti plots) to help us figure out which one is CLOSER to the truth; that’s the best we can do. Sometimes those plots aren’t helpful; there’s too much noise in the pattern around the world, so the spaghetti plots don’t converge to a pattern in which you can have confidence in.
So, here’s the ensemble (spaghetti) plot from last evening’s global data where the model computer model is started with tiny errors, ones that make no difference in the first few days of the model run, but then due to those, the repeated runs with slightly different errors start diverging, sometimes ending up looking like a ball of yarn. Its where these model runs produce the same result that we have confidence in a forecast as far out 10-15 days. In the plot below, the constricted contours in east Asia and across most of the Pacific, represents high confidence in where the jet stream will be in 14 days. The left turn to AK and a big hump off the West Coast is also almost surely the pattern that will be in place as well, as is the dive in the jet into the Plains States. Thus, a pattern of warm and wet in Alaska, and cold east of the Rockies is a VERY good bet at the time of this plot.
How about us?
The plot below is tilting toward a trough here, which would mean rain/snow chances along with below average temperatures. This, by the way, is the OPPOSITE of what the ACTUAL model runs have been telling us would happen for the past two to three days (as was the subject of a somewhat comprehensible blogulation just yesterday here). Sadly, though, the ensembles were off in their strong suggestion of a trough here, starting in late January and continuing into early February. So, we’ve lost a little of the precip expected when that pattern faded.
What about panel 2 above, which suggests a major storm for Arizona?
Its almost certainly a bogus outlier; its not supported. Its not impossible, but you wouldn’t make a forecast on that pattern. Most likely our trough pattern will, from another interpretation of the ensembles, be farther inland from the coast, which would mean colder and not as much precip as would be suggested in panel 2. But its pretty certain that its not going to be hot and dry, a computer solution that’s been roundly rejected from this keyboard all along.
No clouds; no photos.
How about a pilot weather joke instead? Fits with the models joking us around I think:
They seem to go together every time we have Altocumulus clouds; aircraft flying through them create holes or canals! Have been photographing this phenomenon since the early 1980s, and I have not seen it so consistently occur every time there was a flake of Altocumulus around as has been the case here this winter! Its likely because our Altocumulus clouds have mostly been so cold, having temperatures lower than -15° C. Mid-level Altocumulus clouds can range in temperature from well-above freezing to below -30° C.
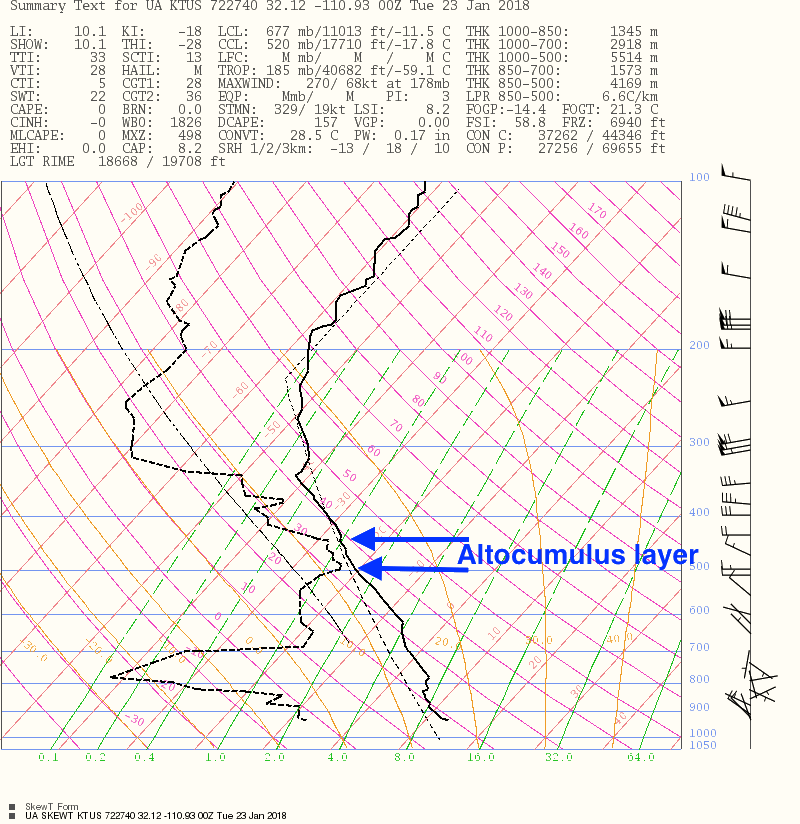
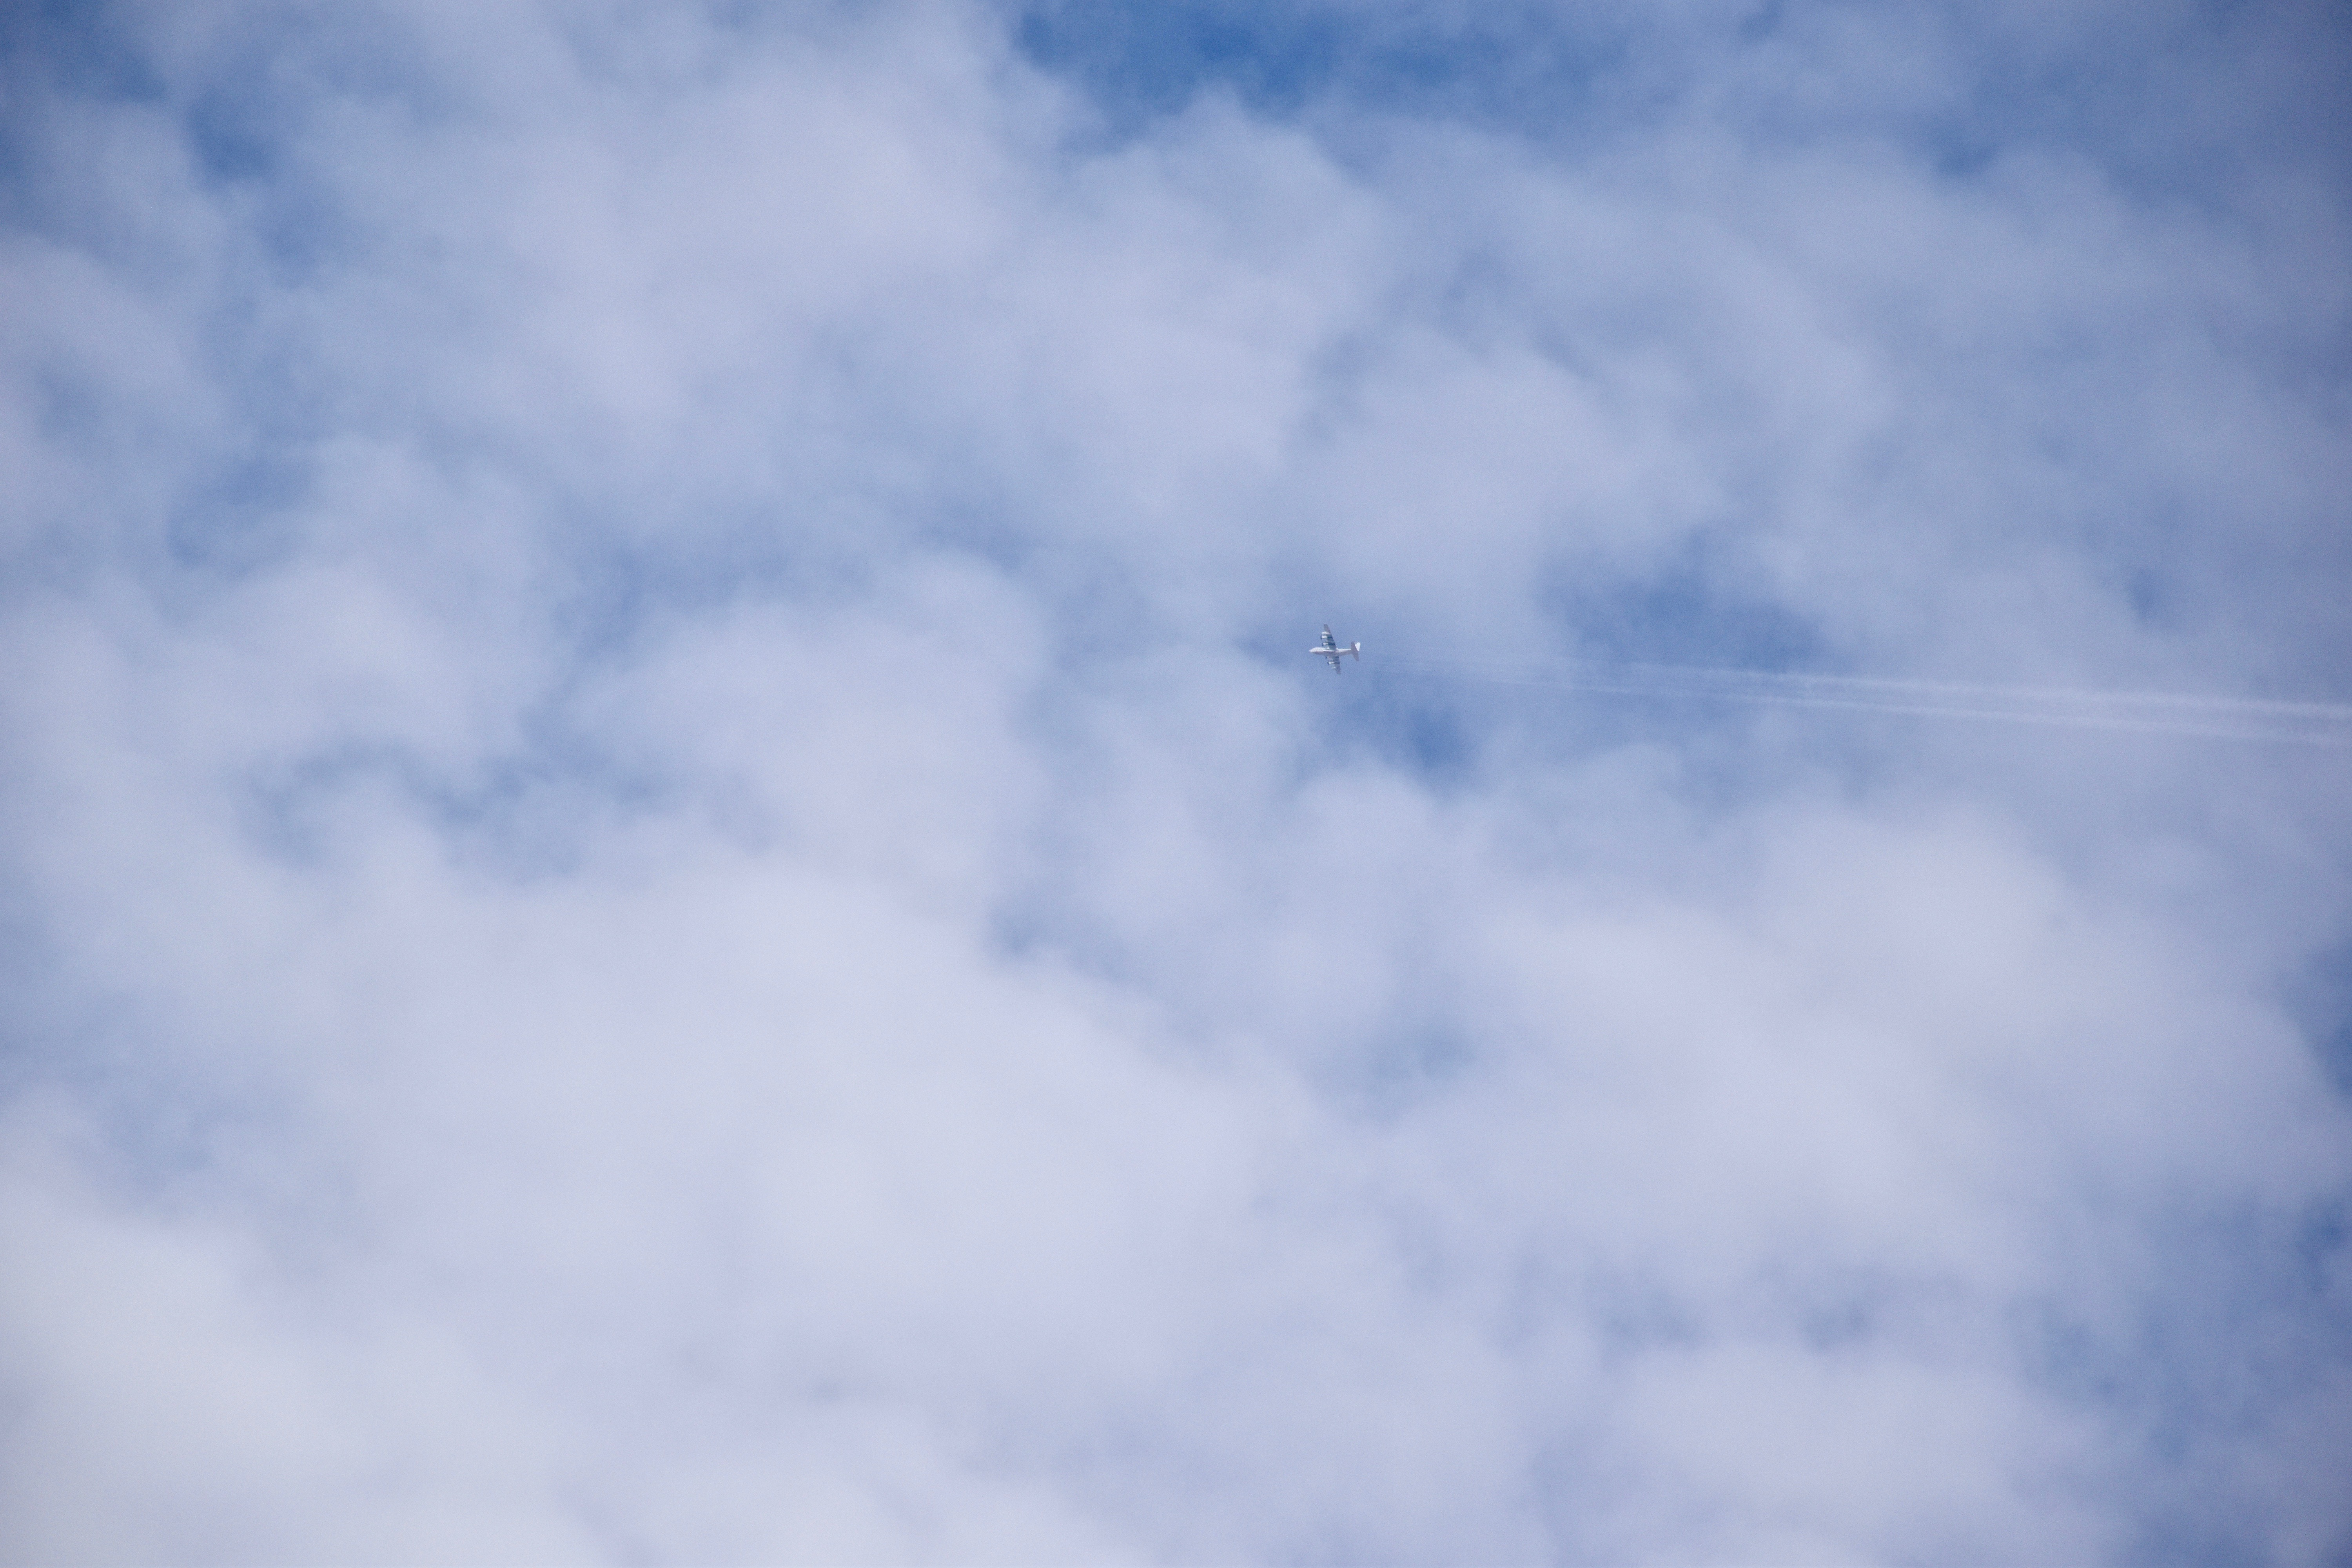
What was unusual about yesterday afternoon, if you caught it, was that you could make out the aircraft producing the “high temperature contrail” (aka, APIPs), a four engine prop aircraft flying just under the bottom of the Altocumulus layer. Even if you see a contrail in the Altocu, you can almost never make out the aircraft type for sure because its too high or in the clouds. But, because of our cool spell, those cold Altocumulus clouds were lower than usual, around 15,000 feet off the ground, or near the 500 millibar pressure level. The temperature at the bottom of this layer was -21° C. See annotated NWS sounding, courtesy of IPS Meteostar, below:
The National Weather Service sounding launched from the U of AZ about 3:30 PM, near the time that the “high temperature” contrail was being produced. A slight amount of Altocumulus was over and downwind of the launch site.
Here’s your aircraft shot, full size so’s you can really zoom in and see those engines:
3:37 PM. A four prop engine aircraft flies just below (maybe 100-300 feet is all) the base of the Altocumulus layer and left a LONG contrail.3:37 PM. The long contrail behind that plane. Note that it goes into clear air; cloud droplets not required. Looks exactly like a normal contrail, those produced by jets at temperatures lower than -35°C when the air is moist.3:44 PM. That contrail now extended from horizon to horizon. it appeared that he climbed through this layer on the way out. The broadening with visual evidence of ice is in the upper right hand corner.4:16 PM. Now the classic ice canal is obvious in our Altocumulus layer. More aircraft produced ice is present as well.4:16 PM. Zooming in on a segment of this canal shows that while its completely ice, there are no virga trails showing. Am guessing that those prop engines produced prodigious numbers of ice crystals via prop tip cooling to below -40°C, where homogenous nucleation of ice occurs (producing prodigious concentrations of ice crystals, maybe tens of thousands per liter in the immediate lee of the prop tip). Here the crystals have spread out due to turbulence, but there are just too many competeing for the available vapor to produce crystals big enough to have much of a fall speed.5:12 PM. Due to the low windspeed at cloud level, just 15 knots or so, this ice canal was visible for more than an hour and a half. It was remarkable how close to natural Cirrus looked at that time. It would be almost impossible to assign this ice to the level of the Altocumulus. Check the close up, next.5:12 PM. Cirrus uncinus homogenitus (I’m not kidding. that would be the name for this Cirrus, having been produced by man (well, or a woman pilot, of course).5:13 PM. Unperturbed Altocumulus perlucidus translucidus (the latter, little or no shading due to thinness of elements).5:14 PM. Shadow drama on the Catalina Mountains from those Altocumulus clouds, made even more interesting by the presence of a weather station in the photo.
S
5:58 PM. The setting sun illuminates that last bit of the aircraft-produced ice canal (“homoCirrus” on the right). This was probably the longest viewing time for any such event over one location, again due to the light winds up there.
The weather ahead, WAY ahead
Not a single model run since two days ago has produced a big trough in the SW US, in complete opposition to the interpretation of spaghetti ensemble output at that time. This would be, IMO, one the greatest busts of all time (not for me, of course), but for spaghetti ensembles (I was only foretelling what they told me), spaghetti considered to be one of the great forecasting advances of all time when computers became powerful enough to produce them in a timely manner.
If we believe these later model runs, it will be relatively hot and dry here, not cold and wet, as was suggested here.
But being of a stubborn nature, Cloud Maven Person is not yo-yo-ing on his forecast just yet. Surprises are almost certain in these model runs, since spaghetti still supports troughing beyond 10-12 days… Standing by for model yo-yo-ing….
A laugher (???) below from our very latest computer run (from IPS Meteostar again). This map in incredible in the lack of jet stream activity over most of the US!
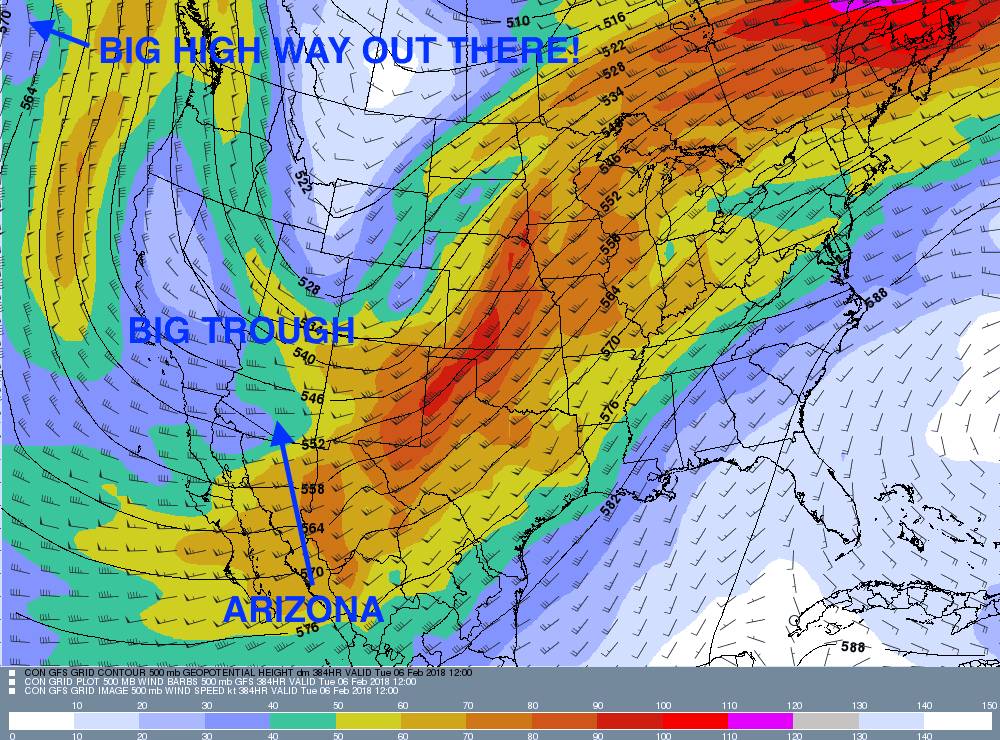
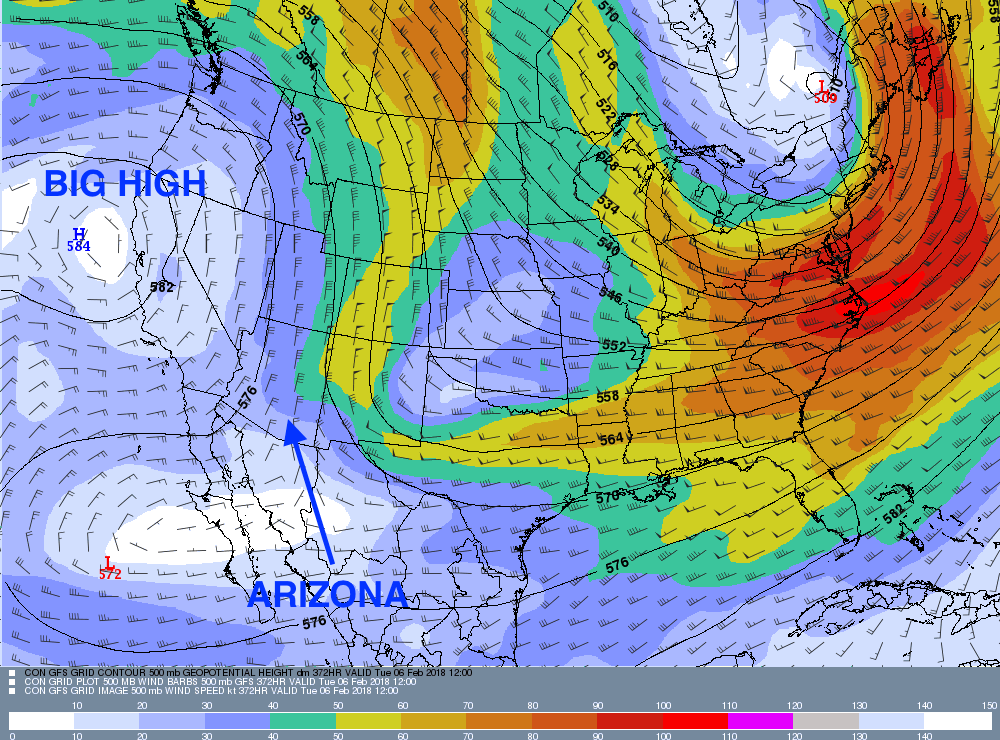
This 500 millibar map is based on global data from 11 PM AST. last evening. Its valid for February 7th, 11 PM AST, way out there. This is a remarkably quiet map for wintertime in the US! Can it possibly be right? Hope not, at least in our area.
Yesterday, after I finally saw the model run based on global data from 5 AM AST for Feb 6th, CMP (the writer) was gloating that bit. The troughy, cold spaghetti for AZ, that which had been excitedly written about yesterday, was being confirmed; the interpretation right on, it seemed. Why even look at more model outputs until later January, I thought.
Then, just now in the pre-dawn darkness, I examined the computer outputs from last night’s 5 PM AST global data, also for Feb 6th, 5 PM AST. That is, global data crunched just 12 h later than the first panel I was gloating over, feeling really great about.
But, a completely, ghastly different weather regime had popped out!
How could this be? We don’t know. Relatively small changes would be expected, but the model outputs should gravitate back to where spaghetti placed the high and lows aloft. But this change was ridiculous, and must be rejected.
Some people, like neighbor and big professor “emeritius” of meteorology at Colo State U, Bill Cotton, refer to such differences as “delta model”. “Hence”, if that word is still used, today’s title.
(For snowbirds who have just moved to Arizona, the maps below have been annotated to show where you are relative to the rest of the US).
Yikes!
The first regime is cold, maybe some snow down in Catalina at some point about this time (early Feb), whilst the 2nd regime for the same time is suggests warm conditions, and definitely dry; no rain nowhere.
CMP (the writer) spoke of a high probability, based on ensemble spaghetti, of cold and lots of precip chances here in Catalinaland beginning at the end of January through the first week of February So, what’s up with that, this dichotomy?
Moving on to a new topic, let us look at last evening’s sunset rather than ponder what happened to the weather computer model, that is, which panel above is likely correct1:
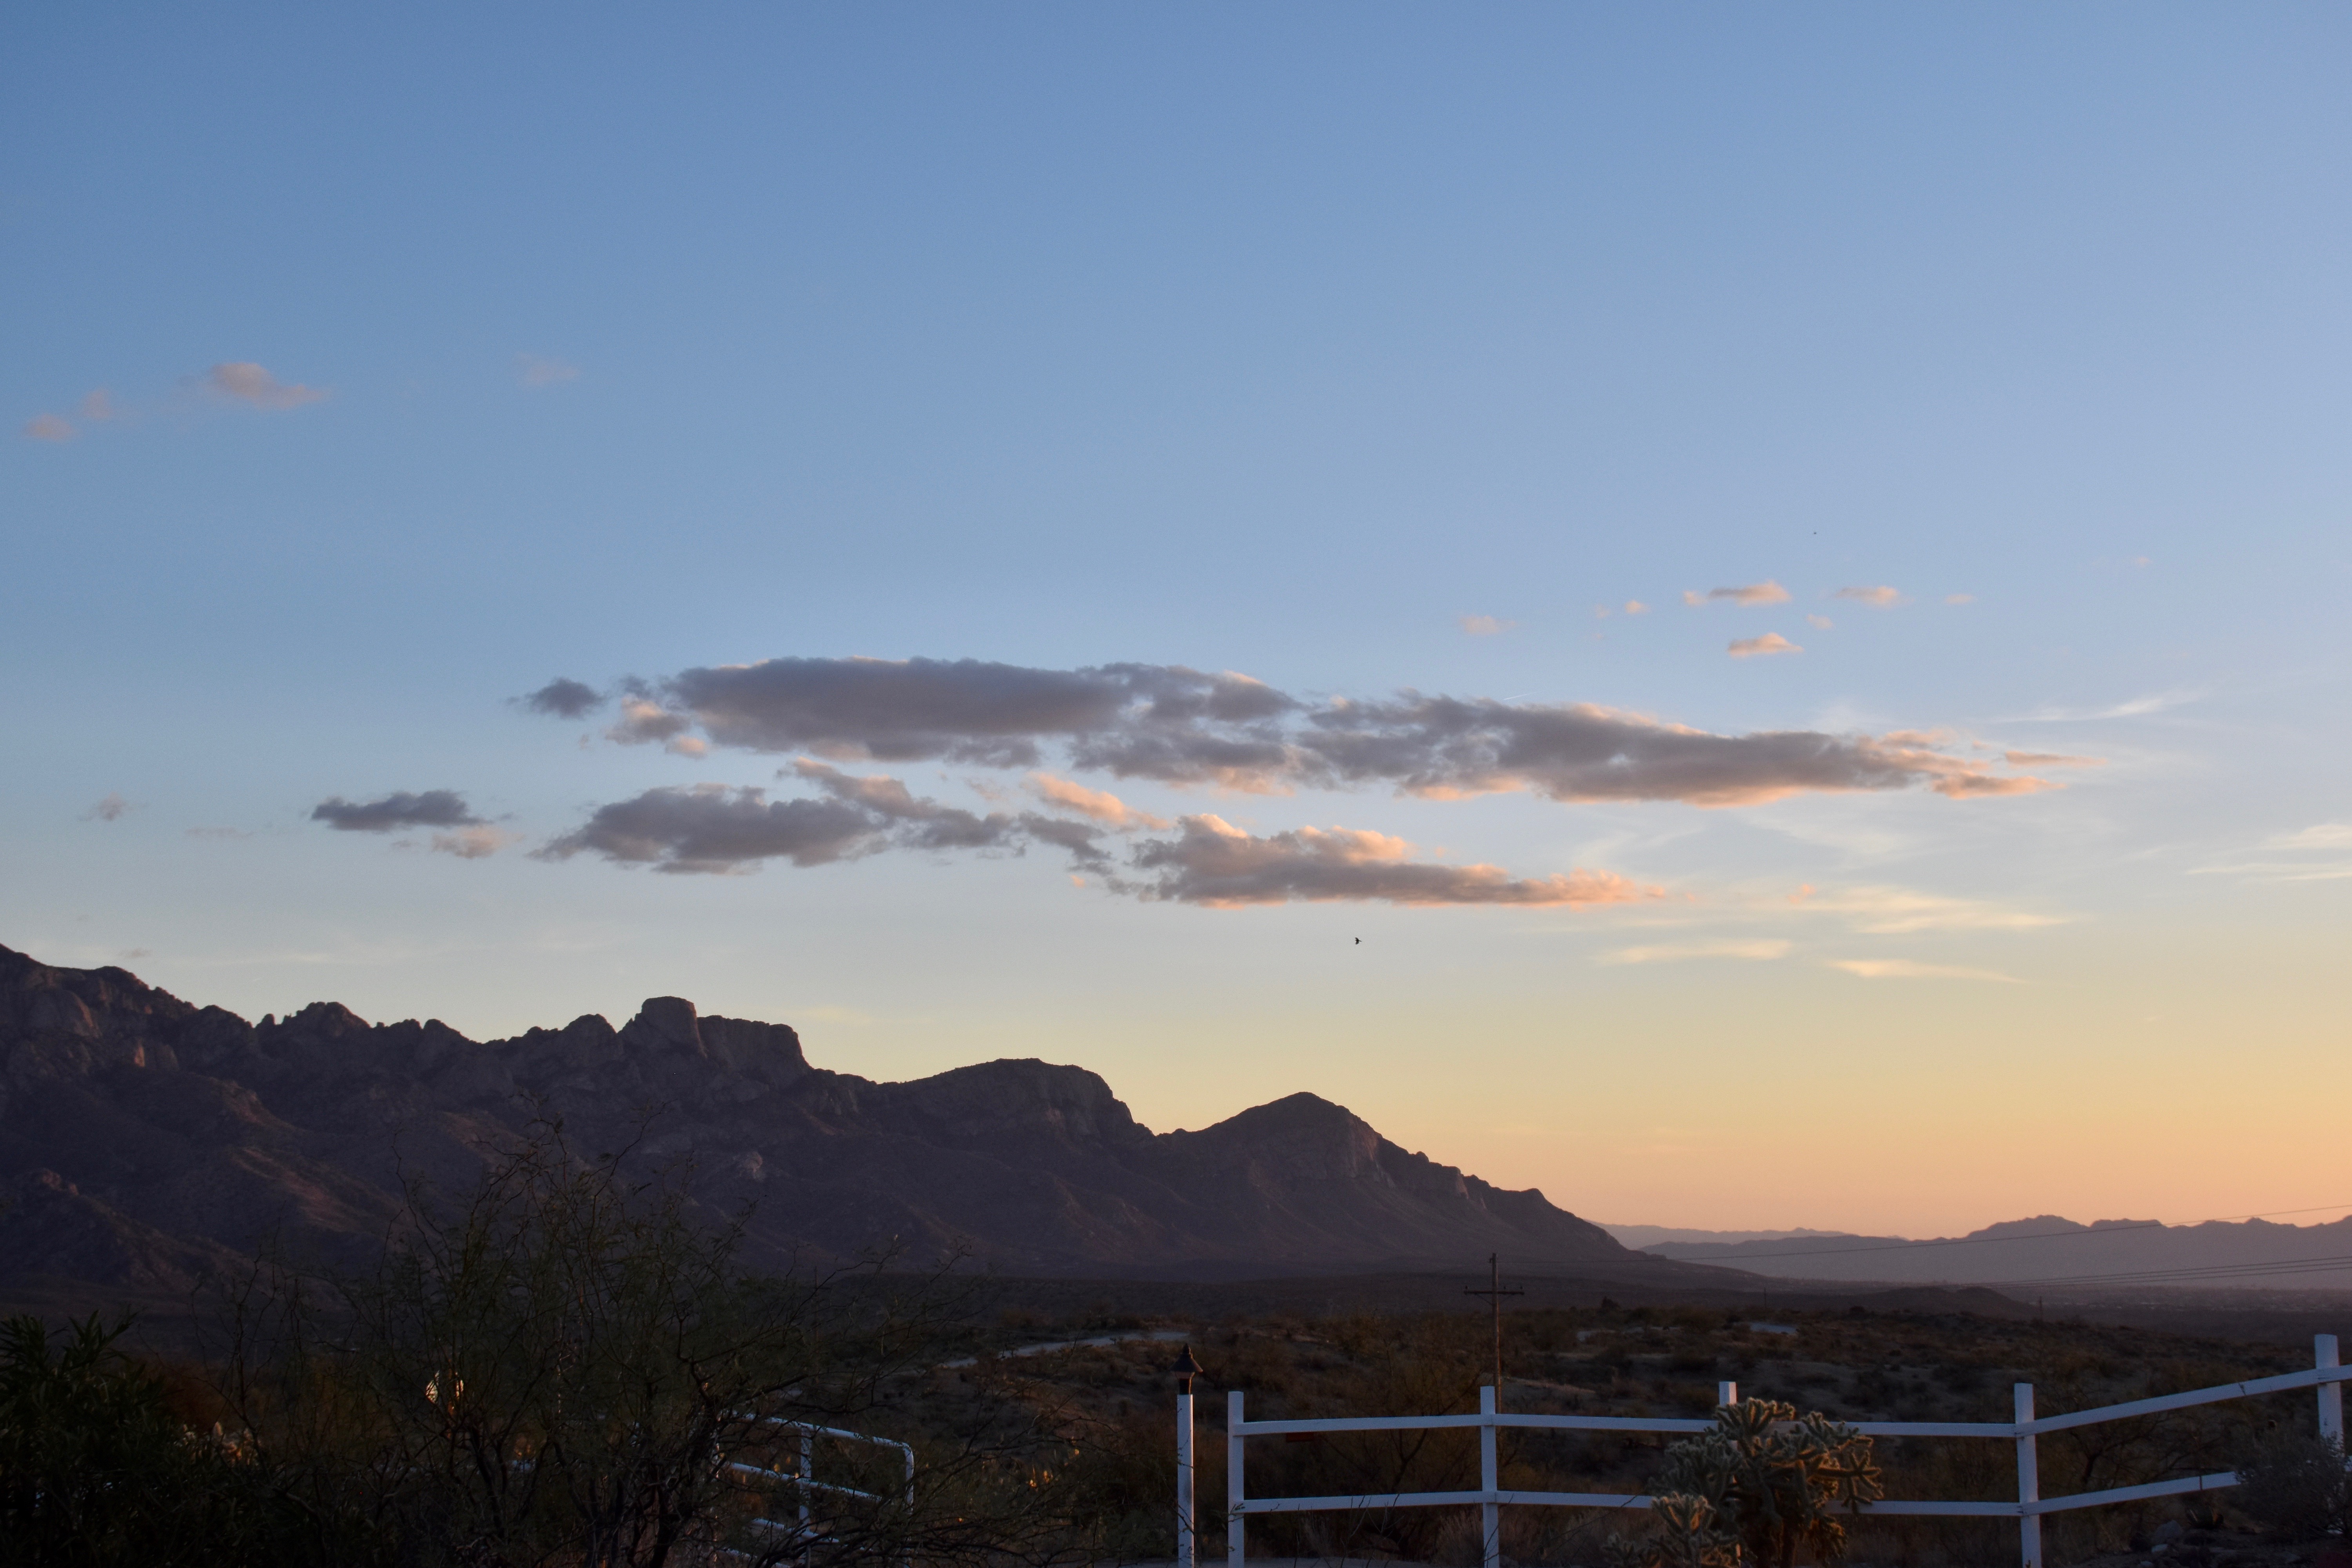
6:09 PM. Cirrus uncinus and other forms of Cirrus provided a beautiful sunset highlight.
The End.
—————————————
1The first regime above, the troughy, cold one, is strongly supported by ensemble outputs whose crazy-looking output plots are fondly referred to as “spaghetti”. The second panel served up from just last night’s 5 PM AST global data is not.
Have not looked at last night’s ensembles, but will ignore the bottom run anyway; will not panic as weaker elements might, that is, change my overall interpretation of troughy conditions in late Jan, early Feb., that is#2, reverse course now, predict drought and warmth for early Feb. , that is#3, “yo-yo”, as forecasters describe reversing course, confuse the public, lose credibility, where are my pills?
……yet. :}.
Still, “egad re this delta model”, as Bill likes to say. Its astounding! A total joke! The later one to be totally and completely rejected!
In no way did I expect to see what’s in the bottom panel, which is now above here! Trying to not panic real hard. (more kidding)
Still, how can there be an outlier of that magnitude as we see from last night? Must be a real bad error somewhere (maybe 2 kts of wind, 1.5 deg in temperature, wind direction, 5 decameters in geopotential height, etc), not an itty-bitty error as ensembles start with. Maybe Russian2 hackers did something, the North Koreans, or the Chinese? Just kidding
with weather noise and pseudo-paranoia, your Catalina cloud-maven of sorts.
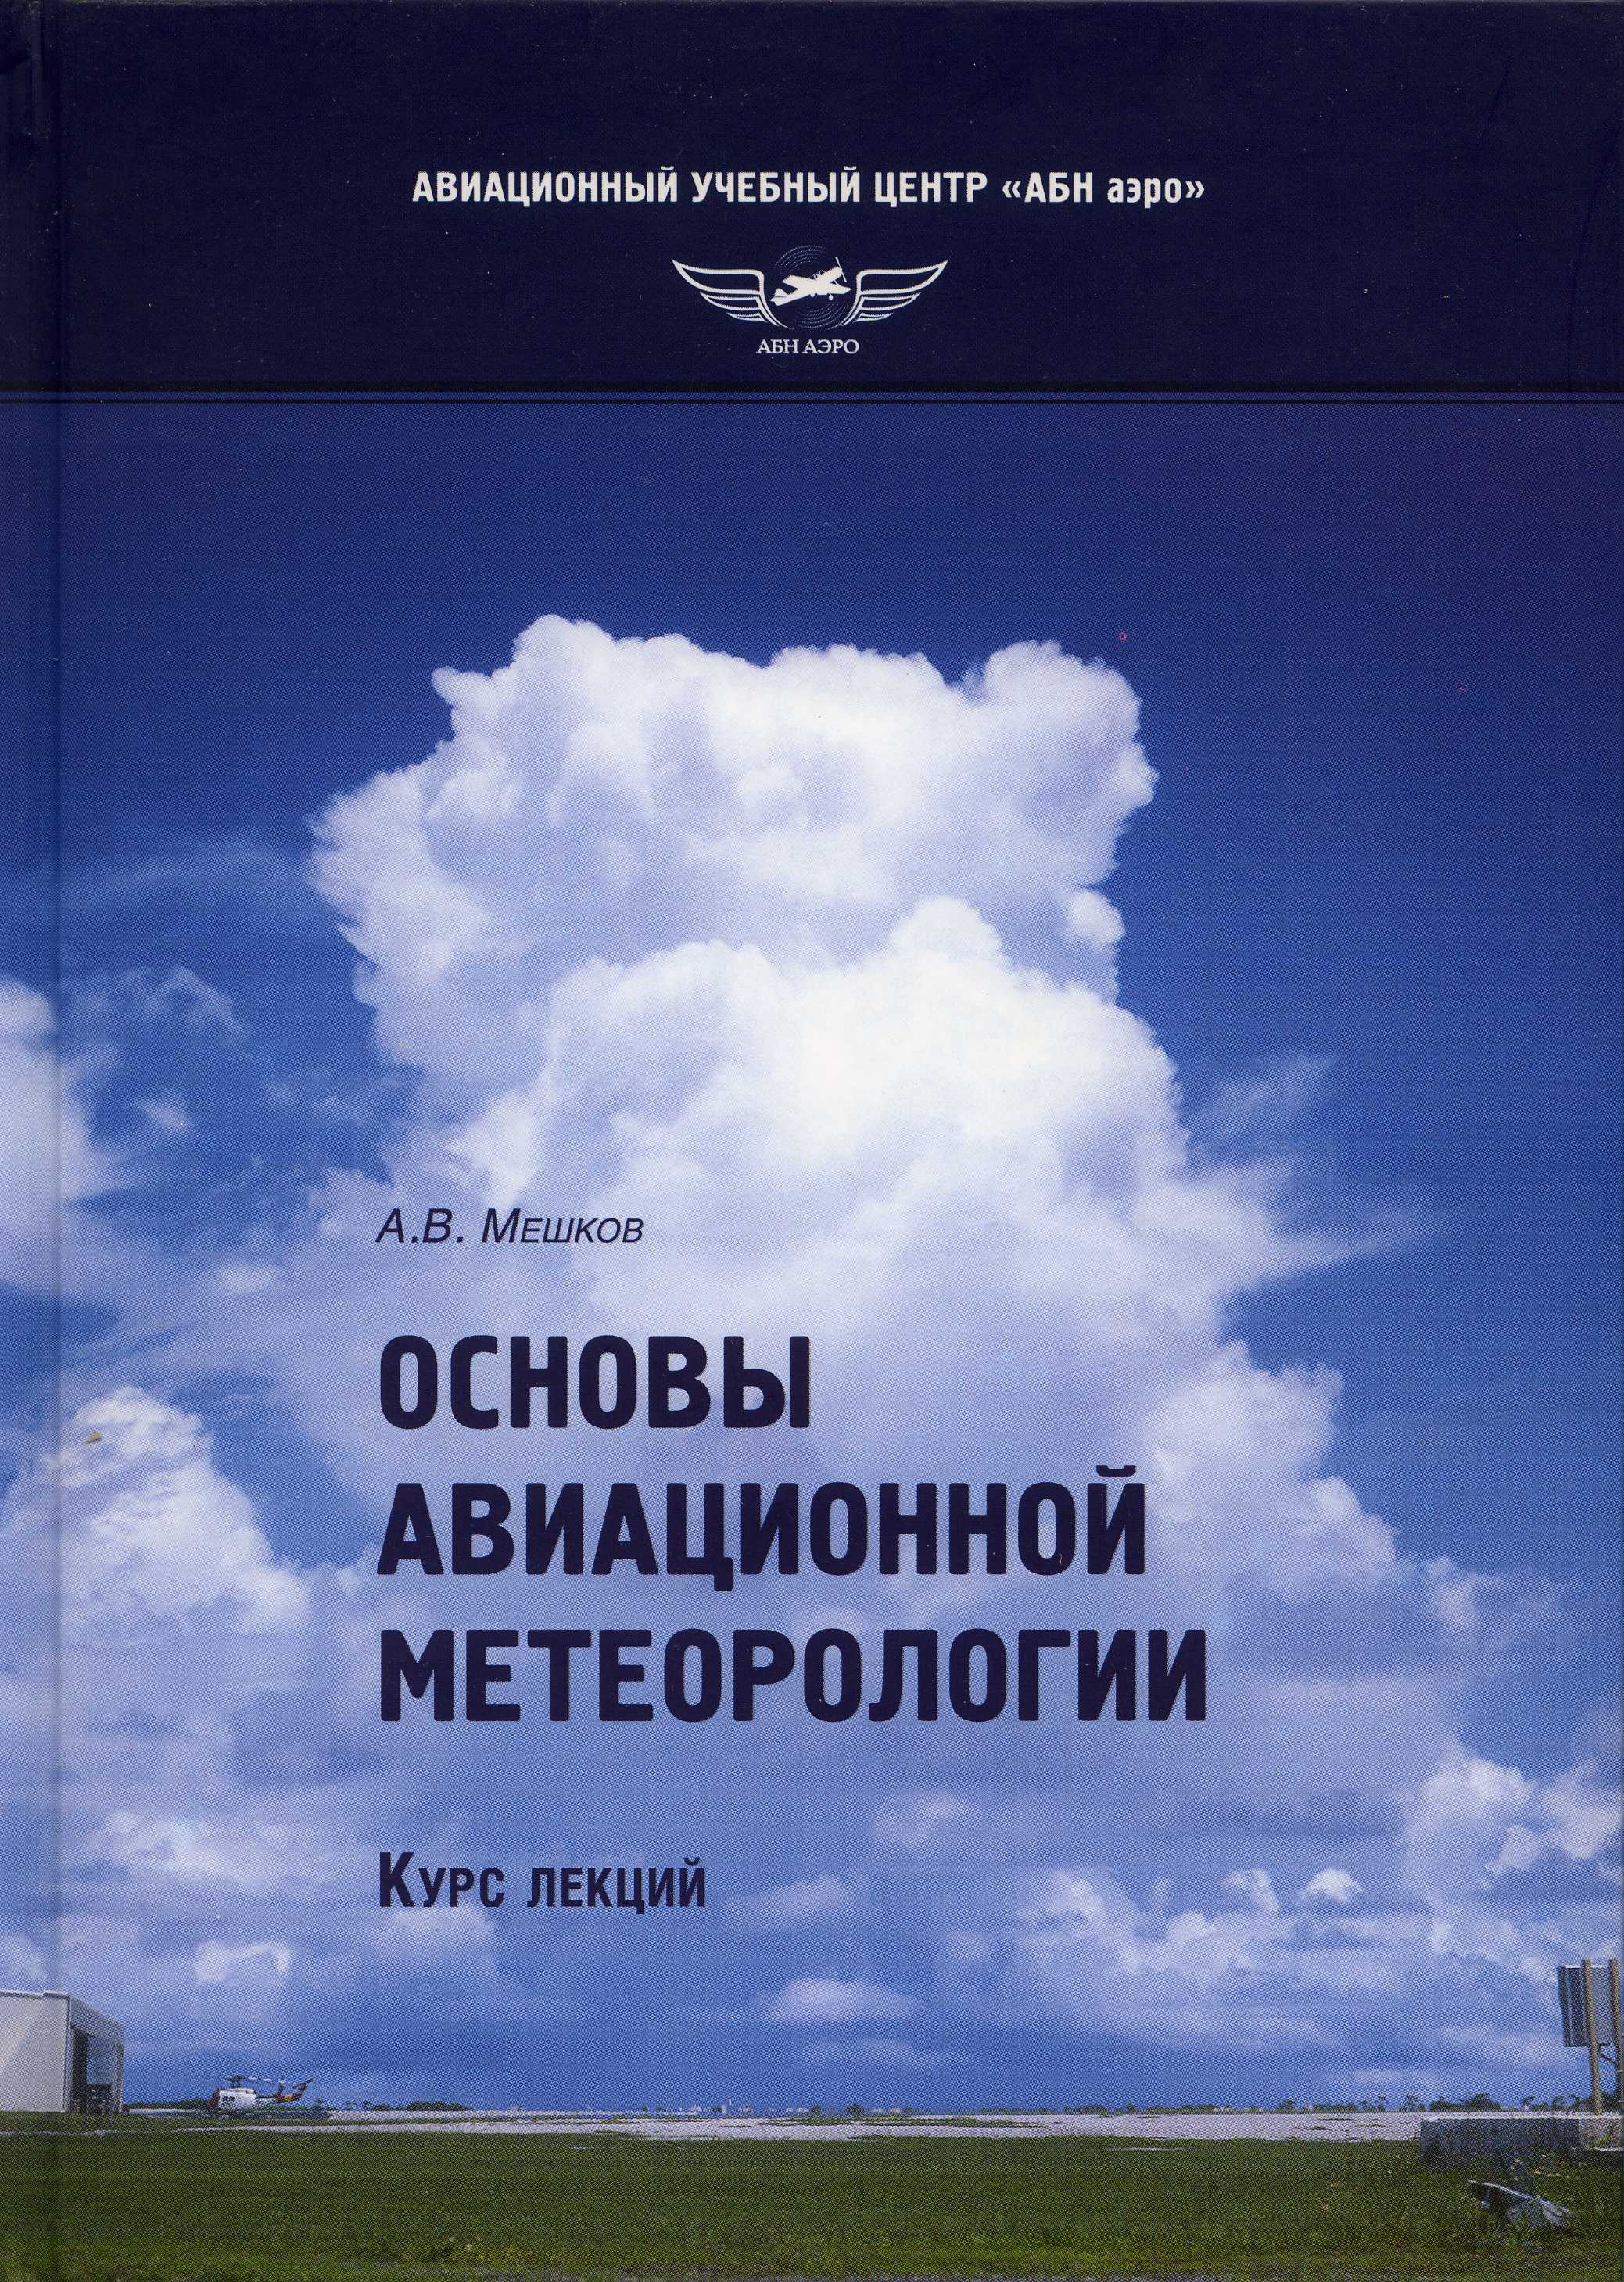
Speaking of Russia, my great-grandparents emigrated from the Ukraine, here’s the cover of my latest book, published a few years ago. Well, its not my book per sé, but all the cloud photos in it are mine! How great izzat?
A book about flying. I asked that my contributions be dedicated to A. M. Borovikov, the great Russian cloud physicist. Did a lot of airborne stuff in the 1950s and 60s. The cover photo above I took while in KWAJEX in 1999, a tropical cloud study featuring several research aircraft centered at Kwajalein Atoll, Marshall Islands. Of note, seeing a monument to the bravery of the Japanese soldiers (fair enough), and seeing a Japanese military plane land there during our six weeks. Gorgeous clouds! Kwajalein Atoll is the terminus of missle launches from Vandenberg. Alerts on TEEVEE tell you when they’re coming in. Unlike in Hawaii where people panic when missles are coming in, folks on Kwajalein go out to “see the show.”